Transcription
TECHNICAL FEATURE ASHRAE www.ashrae.org. Used with permission from ASHRAE Journal. This article may not be copied nor distributed in either paper or digital form without ASHRAE’spermission. For more information about ASHRAE, visit www.ashrae.org.Optimizing CoolingPerformanceOf a Data CenterUsing CFD Simulation and MeasurementsBY AMIR RADMEHR, PH.D.; JOHN FITZPATRICK; KAILASH KARKI, PH.D., MEMBER ASHRAEIn this article, we present a case study that combines computational fluid dynamics(CFD) modeling and measurements to evaluate the cooling performance of a raisedfloor data center. To improve the cooling efficiency, we propose enhancements suchas equipping the blowers of computer room air-handling (CRAH) units with variable frequency drive (VFD) electric motors, adjusting the speed of the blowers tomaintain a certain pressure below the raised floor, and increasing the temperaturesettings of the CRAH units. These enhancements were evaluated and fine-tunedusing CFD modeling. After their implementation, the temperatures of the racksand energy consumption of the data center were monitored for several months.This data showed that the inlet temperatures of the racks stayed below the ASHRAErecommended maximum value and the energy consumption of the data center wasreduced by 58%. The cost of the enhancement will be recovered by the saving inoperating cost over 1.5 years.A large number of data centers are routinely overcooled, resulting in unnecessary increase in theenergy consumption and operating cost. The reasonsfor overcooling include concerns, mostly unfounded,about the reliability of computer equipment, inability of the cooling infrastructure to respond to thechanges in the data center, and lack of proper toolsto get guidance for changes required to improve thecooling efficiency and to predict the effect of thesechanges. Several developments in the recent yearshave eliminated much of the rationale for overcooling. These developments include: A better understanding of the effect of cooling-airtemperature on the performance of serversAmir Radmehr, Ph.D., is a member of the technical staff at Innovative Research, Inc. John Fitzpatrick is the director of enterprise data centers at University of Rochester. KailashKarki, Ph.D., is a member of the technical staff at Innovative Research, Inc.22ASHRAE JOURNALashrae.orgJ U LY 2 0 18
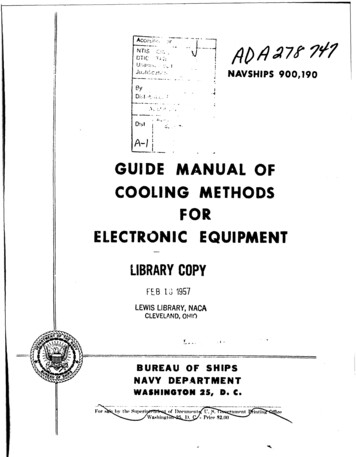
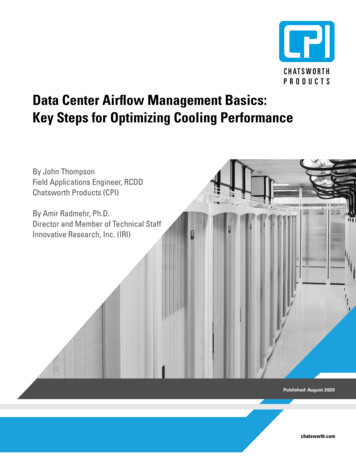
TECHNICAL FEATUREFIGURE 1 The CFD model of the data center. (a) Three dimensional view, (b) plan view.PDUsCRAH UnitsCRAH 7CRAH 8Row 31CRAH 5CRAH 6Row 19Racks AB9 to AT9Perforated TilesRacksA Availability of control systems on cooling devices Adoption of CFD modeling for predicting airflowand temperature distribution in data centersIn this study, we took advantage of these developmentsto improve the cooling efficiency of a data center. Weused CFD to identify the cooling issues in the data centerand to evaluate various enhancements. CFD modelinghas been used widely in other industries since the early1970s. It became popular for data center applications inearly 2000.1-3 Now, it has become a standard practice inboth designing new data centers and resolving coolingproblems and inefficiencies in existing facilities.We have used CFD simulations to propose changes inthe data center and study the effect of these changes oncooling. For this simulation-based strategy to be successful, the CFD model must be validated. For this validation, we used measurements for the current (as-is)conditions in this data center. In an operating data center, there are uncertainties in the descriptions of certaininputs needed in the model. These measurements werealso used to verify and fine-tune such input parameters.The Data CenterThe data center is a raised-floor space, with floorarea of approximately 750 m2 (8,000 ft2), located inRochester, N.Y. At the time of the study, the data centerhoused 175 server racks positioned in the hot aisle-coldaisle arrangement. The total IT heat load in the datacenter was 320 kW (1,088 kBtu/h). The space was beingcooled by eight down-flow, chilled-water CRAH unitsworking at 100% fan speed.The data center does not have a drop ceiling;CRAH 4RacksD18 toQ18CRAH 3Row 7BCRAH 2CRAH 1therefore, the hot air returns to the CRAH unitsthrough the room. However, extension ducts areinstalled at the return side of the CRAH units to pull inhot air from regions closer to the ceiling, preventingthis air from reaching the racks. Perforated tiles with25% open area equipped with dampers were used todeliver the airflow to the racks. For perforated tiles infront of racks with little or no heat load, the damperswere closed.Under each rack, there was a cutout on the floor forcables. Blanking panels were used to close the openspaces between the servers inside the racks. There are12 power distribution units (PDUs) in the data center.Underneath them, there were large openings for cables.The CFD ModelThe CFD model was created using the commerciallyavailable software package4 that has been designedspecifically for data centers and has an extensivelibrary of objects, such as perforated tiles, CRAHunits, and server racks, needed to build layouts. Thefindings of this article are general and independentof the choice of the modeling tool. The details of themethodology are given in Radmehr et al.5.6 Figure 1shows the layout of the CRAH units, racks, perforatedtiles, and other objects in (a) three-dimensional and(b) plan views.Measurements and Validation of the CFD ResultsMeasurements were performed for two purposes:1. To obtain reliable inputs for the CFD analysis.These measurements included the power consumptionJ U LY 2 0 18ashrae.orgASHRAE JOURNAL23
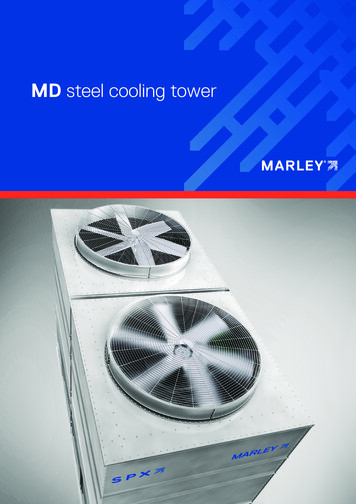
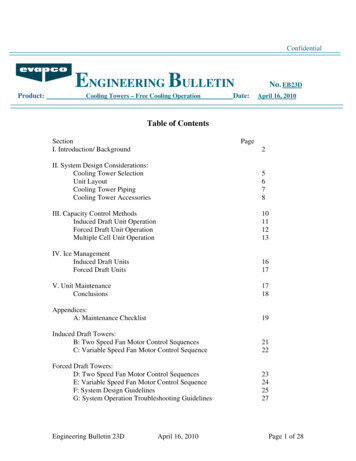
TECHNICAL FEATUREFIGURE 2 Comparison of the calculated and measured flow rates of the tiles for a typical row.Flow Rate (m3 /s)0.200Cooling Produced by a CRAH unit T ρVc Tp24ASHRAE JOURNAL(returnashrae.orgsupply)J U LY 2 0 18Measured0.1000.050E GIKM OU WY AA AC AE AG AJ AK AM AO AQPerforated Tile LabelASRack Rate Temperature ( C)FIGURE 3 Comparison of the calculated and measured temperatures of the racks at 0.9 m for a typical ed10.05.00.0AB09AC09AD09AE09AF09AG09Rack NameAH09AI09AJ09FIGURE 4 Comparison of the calculated and measured temperatures of the racks at 1.8 m for a typical row.Cooling D18E18F18G18H18I18Rack NameK18L18M18FIGURE 5 Comparison of the calculated and measured CRAH units return temperatures.30.0Return Temperature ( C)The nominal cooling capacity of eachCRAH unit at 100% fan speed and at 24 C(75 F) return temperature is reported by themanufacturer to be 91 kW (309 kBtu/h). Atthe time of the study, all eight CRAH unitswere working at 100% speed, which makesthe nominal cooling capacity 728 kW (2,575kBtu/h). The total IT heat load measured atPDU units was only 320 kW (1,088 kBtu/h),which indicated that CRAH units were providing partial cooling. The cooling producedby a CRAH unit can be calculated by applying the energy equation across the unit:Calculated0.1500.000Rack Temperature ( C)of the racks and the airflow rates and supplytemperatures of the CRAH units.2. To validate the values calculatedby the CFD model. These measurementsincluded the flow rates of perforated tiles,the inlet temperatures of racks at variousheights, and the average return temperatures of CRAH units.Details of the measurement process andtechniques are given by Radmehr, et al.5Figure 2 shows the comparison of the measured and calculated flow rates of perforated tiles. The flow rates of the perforatedtiles with closed dampers are significantlylower than the flow rates of the tiles withopen dampers. Figures 3 and 4 show thecomparison of the measured and calculatedinlet temperatures for two sets of racks. Thetemperatures were measured at the heightof 0.9 m (3 ft) for one set and at 1.8 m (6 ft)for the other. Figure 5 shows the comparisonof the measured and calculated return temperatures of CRAH units. The results for theflow rates of the tiles and racks temperaturesare similar for other rows. It can be seen thatthe agreement between the measured andcalculated values is good, indicating that theCFD model is an accurate representation ofthe data center and the results are reliable.CalculatedMeasured20.010.00.0(1)12345CRAH Number678This equation involves the air density ρ, volumetricairflow rate V , specific heat cp, and return and supplytemperatures. (The return and supply temperatures were
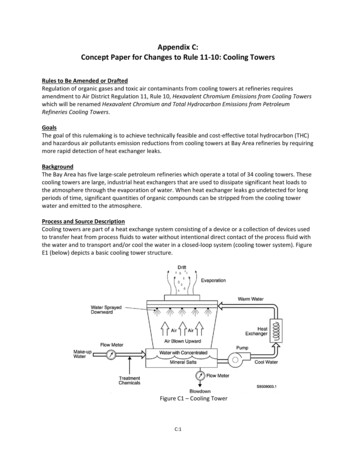
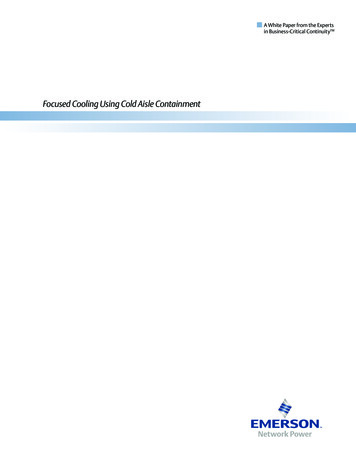
TECHNICAL FEATURETABLE 1 Cooling produced by CRAH units.CRAHTABLE 2 The split of airflow among various openings on the floor.FLOW RATERETURNSUPPLYm 3 /s (cfm) TEMPERATURE C ( F) TEMPERATURE C ( F)OPENINGFLOW RATE m 3/s (cfm)Perforated Tiles22.18 (47,000)Large Openings Under PDUs9.91 (21,000)COOLINGkW (kBtu/h)15.53 (11,712)25.6 (78)16.1 (61)63.4 (215.6)25.44 (11,520)27.2 (81)15.0 (59)80.7 (274.4)35.30 (11,232)25.0 (77)22.2 (72)17.9 (60.9)45.37 (11,376)25.0 (77)20.0 (68)32.6 (110.8)55.22 (11,072)24.4 (76)24.4 (76)0.0 (0.0)65.47 (11,600)25.6 (78)16.6 (65.5)46.2 (157.1)75.58 (11,824)26.1 (79)17.5 (63.5)58.4 (198.6)85.51 (11,680)24.4 (76)21.7 (71)18.6 (63.2)Total Cooling317.8 (1080.5)measured at several points across the return and supplyfaces and their average values are used in Equation 1). Theresults, presented in Table 1, show that the total coolingproduced by the CRAH units was 317.8 kW (1,081 kBtu/h)which matched the total IT heat load. This is an independent validation of the IT heat load. Note that the coolingproduced by each CRAH unit was less than its nominalcooling of 91 kW (309 kBtu/h). Moreover, two CRAH units,Units 3 and 8, produced less than 25% of their nominal cooling, and one, Unit 5, produced no cooling. Thisresult showed that there was a significant opportunityfor improving the cooling performance and reducing theenergy consumption of the data center.To provide recommendations for improvements, itwas essential to know how the supplied cooling air wasdistributed. The CFD model provided the split of airflowamong various openings on the floor. The results areshown in Table 2.More than 40% of the cooling air leaked through thelarge openings under PDUs and cable openings underracks. Nearly 8%, 3.3 m3/s (7,000 cfm), leaked throughthe gaps between the tiles. This is called distributedleakage and cannot be avoided. Readers interested inthe distributed leakage topic are encouraged to readRadmehr, et al., and Karki, et al.5,7 Only slightly morethan 50% of the airflow was discharged through perforated tiles.Figure 6 shows the inlet temperatures of racks predictedby CFD simulation. Some of the racks received air attemperatures above 27 C (80.6 F), which is the upperlimit of the recommended value by ASHRAE.8 This wasbecause the cooling air was not distributed according tothe demand of the racks. Figure 7 shows the temperaturedistribution in the room at 2.13 m (7 ft), just above theCable Openings Under Racks8.02 (17,000)Distributed Leakage Through the Floor3.30 (7,000)Total43.42 (92,000)FIGURE 6 The inlet temperatures of racks.Temperature in C18.022.326.530.835.030.835.0FIGURE 7 Temperature distribution at 2.13 m (7 ft).Temperature in C18.022.326.5Cooling Air Returning to CRAH Unitsracks. It can be seen that a large quantity of the cooling air at low temperature returned to the CRAH unitswithout participating in the cooling of the racks. Figure8 highlights the areas where the hot air penetrated intothe cold aisles through open spaces at the end of the coldaisles and between the racks.J U LY 2 0 18ashrae.orgASHRAE JOURNAL25
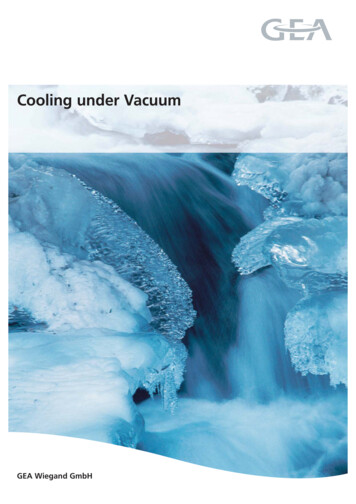
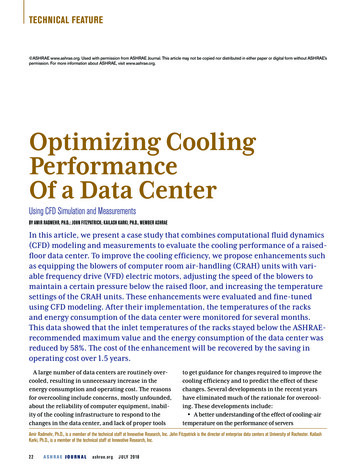
TECHNICAL FEATURERecommendationsFIGURE 8 Hot air penetration into cold aisles; the temperature distribution isThe results produced by the CFD simulation for as-isconditions provided the insights to assess the coolingperformance of the data center and propose modifications, which can be further evaluated and fine-tunedwith CFD simulations. The proposed modifications andtheir objectives are discussed below.at 1 m (3.3 ft).Temperature in C18.022.326.530.835.0Balancing the Supply and Demand of Airflow for Each Cold AisleTo provide the needed airflow at the proper temperature to the racks, the supplied airflow from theperforated tiles to each cold aisle should be equal orslightly higher than the airflow demand of the racksfacing the cold aisle. Moreover the supplied airflowshould not leave the cold aisle without entering theservers. The CFD simulation provides the airflowsupplied to each cold aisle which can be comparedto the airflow demand of the racks. In order to balance the airflow for each cold aisle and make surethe supplied airflow enters the servers before leaving the cold aisle, the following modifications wererecommended:1. Closing cable cutouts under racks and largeopenings under PDUs to minimize the airflow leakage;2. Replacing perforated tiles with a closed damperwith solid tiles to eliminate the airflow leakage throughthem;3. Rearranging perforated tiles to improve the balance between the supply and demand in each cold aisle;and4. Placing vertical partitions to close the openingsat the end of the cold aisles and the large gaps betweenracks. This is done to prevent supplied airflow leavingthe cold aisle and to prevent penetration of hot air intothe cold aisle.Addition of VFD to CRAH Units and Pressure Sensors Under the FloorThe CFD simulations indicated that the blowers of theCRAH units can be operated at 75% of the rated speedand yet they provide the required airflow. A reductionin the blower speed will lower the energy consumption of the CRAH units. Although the blower speed canbe adjusted manually, it is desirable that the speedresponds to the changes in the data center. In this project, the blowers were equipped with variable frequencydrive (VFD) and pressure sensors were installed belowthe raised floor. The blower speed was adjusted to26ASHRAE JOURNALashrae.orgJ U LY 2 0 18maintain a certain average pressure in the underfloorplenum.An increase in the heat load is expected to beaccompanied by an increase in the open area on theraised floor, either by using more open tiles or byadding new tiles. For the current blower speed, thisincrease in the open area will cause a reduction in theunder-floor pressure. The control system will tendto maintain the pressure at the specified level and,therefore, will increase the blower speed. Thus, thiscontrol system properly responds to changes in theheat load.Since it is the static pressure under the floor thatdrives the airflow through the perforated tiles, thepressure sensors need to measure the static pressureand not the total pressure, which is the combinationof the static and dynamic pressure. Therefore, theplacement of the sensors is important. They should beplaced away from the CRAH units and in areas with lowvelocities. Pressure sensors equipped with a perforatedshield that reduces the effect of the dynamic pressureare preferred.CFD simulations were used to decide the setpointfor the underfloor average pressure, the number ofpressure sensors, and their optimum locations. Therequired average pressure under the floor depends onthe airflow demand of the equipment and the resistancecharacteristics of the perforated tiles. Attention needsto be paid to ensure adequate cooling for all racks with
TECHNICAL FEATUREthe recommended average pressure under the floor. Inthis case, the required average pressure under the floorwas calculated to be 12 Pa (0.048 inches of water). Thisvalue was chosen as the setpoint for the average sensorpressure. Since the underfloor pressure in regions awayfrom the CRAH units is nearly uniform, we decided touse only four sensors and place them in areas where thepressure is close to the set point pressure. As discussedabove, the sensors should be placed in the regions wherethe velocities are low. To decide the locations, we tookguidance from the airflow pattern. These are shown inFigure 9.FIGURE 9 The location of the sensors and the pressure/velocity fields under the floor.UF Pressure (Pa) at z 815 mm–23.2–3.33.39.816.353.84321Increasing the Temperature Settings of the CRAH UnitsThe CFD model shows that after implementing theabove-mentioned modifications, there will be adequatecooling air for each rack and the variation of the inlettemperature across the face of the racks will be small. Asa result, the supply temperature of the CRAH units canbe increased to reduce the energy consumption of thechiller plant.Cooling Assessment After ModificationsThe CFD simulations were used to fine-tune theproposed modifications. The results shown in Table 3and Figures 10 and 11 are generated after implementingAdvertisement formerly in this space.J U LY 2 0 18ashrae.orgASHRAE JOURNAL27
TECHNICAL FEATURETABLE 3 The split of airflow among various openings on the floor aftermodifications.OPENINGFLOW RATE m 3/s (cfm)Perforated Tiles25.48 (54,000)Large Openings Under PDUs1.65 (3,500)Cable Openings Under Racks1.89 (4,000)Distributed Leakage Through the Floor3.54 (7,500)Total32.56 (69,000)all the modifications under the Recommendationssection.The CFD results indicated that the CRAH units’blower speed was reduced to 75%, based on the feedback from the underfloor pressure sensors, to maintainthe desired underfloor pressure of 12 Pa (0.048 inchesof water). Table 3 shows the split of airflow rates amongvarious openings on the raised floor for the modifiedlayout. This table shows the benefit of closing the cableopenings under the racks and PDUs, replacing perforated tiles with closed damper with solid tiles, rearranging perforated tiles, and using CRAC units withVFD system and pressure sensors. The airflow leakagethrough openings under PDUs and racks is reducedsignificantly while the airflow rates through perforatedtiles are increased.Figure 10 shows the effectiveness of partitions in preventing the hot air penetration into the cold aisles.The CFD simulations also indicated that the thermostat setting of the CRAH units can be increased by 4.4 C(8 F) and still inlet temperatures for all racks could bemaintained below the ASHRAE-recommended maximum temperature of 27 C (80.6 F). Figure 11 shows theinlet temperatures of the racks after implementing thismodification along with the ones stated in the previousparagraphs. That the inlet temperatures for all racks arewithin the acceptable range is a significant achievementconsidering the total airflow supplied by the CRAH unitsis reduced by 25% and the return temperatures of theCRAH units are higher.These modifications inside the data center also presented opportunities for enhancements in the chillersystem, such as increasing the temperature of thechilled water and reducing the speed of the pumps,which led to further reduction in energy consumption.After implementing these changes in the data center and chiller system, the energy consumption of the28ASHRAE JOURNALashrae.orgJ U LY 2 0 18FIGURE 10 Prevention of hot air penetration into cold aisles by partitions; the tem-perature distribution is at 1 m (3.3 ft).Temperature in C18.022.326.530.835.0FIGURE 11 The inlet temperatures of racks after modifications.Temperature in C18.022.326.530.835.0cooling system was monitored over a few months. It wasreduced by 58%, from 132 kW (449 kBtu/h) to 55 kW (187kBtu/h), which resulted in 86,000 reduction in annualcooling cost. The total cost of the modifications was 135,000, which will be recovered in 1.5 years.ConclusionWe were able to improve the cooling performance ofthe data center significantly by getting guidance fromCFD simulations and field measurements. The measurements were done to validate the simulation results and
TECHNICAL FEATUREimprove the accuracy of inputs to the CFD model. TheCFD simulations were particularly instrumental in thefollowing areas: Identifying the cause of the cooling problems; Showing how the cooling air splits among the openings on the floor; Evaluating various strategies, such as VFD on CRAHunits and use of partitions; Finding the optimum locations for pressure sensors; and Fine-tuning recommended changes, such as reducing the flow rates of CRAH units and increasing theirtemperature settings.Each data center is unique and has its own coolingchallenges. The remedies and enhancements proposed in this study may not be entirely relevant toother data centers. However, the approach based onCFD simulations and field measurements can be usedin any data center to ensure efficient cooling of computer equipment and to reduce the energy consumption and operating cost.Advertisement formerly in this space.30ASHRAE JOURNALashrae.orgJ U LY 2 0 18References1. Kang, S., et al. 2000. “A methodology for the design ofperforated tiles in raised floor data centers using computationalflow analysis.” ITHERM, Proceedings, (1):215–224.2. Schmidt, R. R., et al. 2001. “Measurement and predictions ofthe flow distribution through perforated tiles in raised-floor datacenters,” Paper No. IPACK2001-15728, Proceedings of InterPack’01, ThePacific Rim/ASME International Electronic Packaging TechnicalConference and Exhibition.3. Karki, K.C., A. Radmehr, S.V. Patankar. 2003. “Use ofcomputational fluid dynamics for calculating flow rates throughperforated tiles in raised-floor data centers,” Int. J. of HVAC&RResearch, (9):153–166.4. Innovative Research, Inc. 2018. TileFlow Version 6.0.5. Radmehr, A., R.R. Schmidt, K.C. Karki, S.V. Patankar.2005. “Distributed leakage flow in raised-floor data centers,”IPACK2005-73273. ASME InterPack’05.6. Radmehr, A., B. Noll, J. Fitzpatrick, K.C. Karki. 2013. “CFDmodeling of an existing raised-floor data center,” 29th IEEE SEMITHERM Symposium.7. Karki, K. C., A. Radmehr, S.V. Patankar. 2007. “Predictionof distributed air leakage in raised-floor data centers” ASHRAETransactions, 113(1):219–226.8. ASHRAE. 2015. Thermal Guidelines for Data ProcessingEnvironments. 4th Edition. Atlanta: ASHRAE.Advertisement formerly in this space.
The Data Center The data center is a raised-floor space, with floor area of approximately 750 m 2 (8,000 ft ), located in Rochester, N.Y. At the time of the study, the data center housed 175 server racks positioned in the hot aisle-cold aisle arrangement. The total IT heat load in the data center was 320 kW (1,088 kBtu/h). The space was being .