Transcription
Class of 2015College and Career Readiness IndicatorsHawai‘i State Board of Education MeetingApril 5, 2016
Hawai‘i P-20 Partnerships for Education Statewide partnership led by– Executive Office on Early Learning– Hawai‘i State Department of Education (HIDOE)– University of Hawai‘i System (UH) Working to strengthen the educational pipelineFOUR STRATEGIC ROLESState PolicyAdvocateKey Communicatorand ConvenerBest PracticesProgram DeveloperInteragency DataCoordinator
College and Career Readiness Indicators (CCRI) High school feedback report– Introduced in 2009 for the Classof 2008– Created for each Hawai‘i DOEgraduating class by school Three sections:– High School Outcomes– College Enrollment– High School to College Transition
CCRI Highlights Updates: Timeline for Public Release and Packet Info Trends and Top Performers– Advanced Placement (AP)– Dual Credit– College Access Spotlight Schools New Data:– College Persistence– College Access Disaggregated by Demographic Info Q&A
CCRI Publication TimelineFEBRUARYFeb 29: Hawaiʻi P-20 releases CCRI to CAS and designees via UH FileDrop; CAS releases CCRI to PrincipalsMARCHMarch 1 – 11: Principals review CCRI for questions and comments todesignees, who will pass along to Hawaiʻi P-20March 14 –18: Hawaiʻi P-20 and HIDOE conduct final review andadjustmentsMarch 21: Public release of CCRIAPRILApril 5: Board of Education briefing at General Business MeetingCAS and CAS designees to direct comments, requested edits,or questions to Jean Osumi at josumi@hawaii.edu
TRENDS AND TOP PERFORMERS
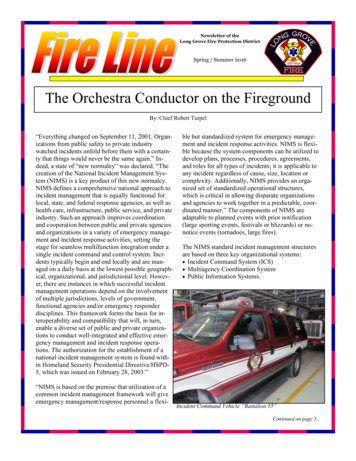
Advanced Placement (AP) Trends4,0003,5003,268 (30% ofCompleters)3,158 (28% ofCompleters)3,022 (27% ofCompleters)3,0002,5002,0001,5001,355 (43% ofExam Takers)1,245 (41% ofExam Takers)1,379 (42% ofExam Takers)1,0005000Class of 2013Class of 2014Took AP ExamsScored 3 On 1 ExamClass of 2015
Advanced Placement (AP) Top SchoolsTOP PERFORMERS:COMPLETERS TAKING AP EXAMSTOP INCREASE:COMPLETERS TAKING AP velt32%53% 21%King Kekaulike49%Nānākuli†3%26%† 23%Waialua48%Pearl City17%32% 15%Kalani45%Waialua36%48% 12%Leilehua & Radford42%King Kekaulike38%49% 11%Statewide30%Statewide27%30% 3%
Advanced Placement (AP) Top SchoolsTOP PERFORMERS:AP EXAM TAKERS SCORING 3TOP INCREASE:AP EXAM TAKERS SCORING 0% 20%Moanalua69%Farrington30%45% 15%Mililani68%Kaiser45%57% 12%Kaiser & Kahuku57%Kapa‘a25%37% 12%Aiea55%Kahuku48%57% 9%Statewide42%Lahainaluna27%36% 9%Statewide41%42% 1%
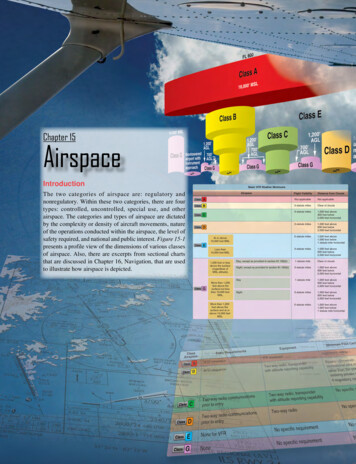
Dual Credit Trends2,0001,8001,6001,4001,058 (10% ofCompleters)1,2001,000800879 (8% ofCompleters)723 (6% ofCompleters)60040037% ofParticipants41% ofParticipants39% ofParticipants2000Class of 2013Class of 2014Participated in Dual CreditEarned 6 CreditsClass of 2015
Dual Credit Top SchoolsTOP PERFORMERS:COMPLETERS IN DUAL CREDITTOP INCREASE:COMPLETERS IN DUAL u13%32% 19%Kailua18%Kailua5%18% 13%Kaimukī16%Farrington3%15% 12%Farrington15%Wai‘anae4%15% 11%Wai‘anae15%Kaimukī6%16% 10%Statewide10%Statewide6%10% 4%
Dual Credit Top SchoolsTOP PERFORMERS: PARTICIPANTSEARNING 6 COLLEGE CREDITSTOP INCREASE: PARTICIPANTS EARNING 6 COLLEGE 32%69% 37%Waiākea69%Baldwin17%45% 28%Kaimukī52%Campbell12%37% 25%Roosevelt49%Wai‘anae0%24% 24%Waipahu48%Maui7%26% 19%Statewide39%Statewide41%39%-2%
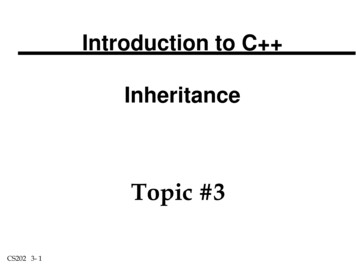
College Access Nationwide, First 0%35%30%27%26%25%20%23%Class of 200924%Class of 201027%28%28%26%26%26%26%25%Class of 2011Class of 2012Class of 2013Class of 2014Class of 2015College Access Nationwide, Fall2-year4-year
College Access Nationwide, First FallTOP PERFORMERS:COLLEGE ACCESSTOP INCREASE:COLLEGE 7%58% 11%48%57% 9%HighestRoosevelt Percentage % 7%Moanalua71%Roosevelt70%76% 6%Mililani67%Kapa‘a51%57% 6%Statewide56%Leilehua45%51% 6%Statewide54%56% 2%
Why Focus on the University of Hawai‘i?OF THE HAWAI‘I DOE COMPLETERS WHO ACCESSED COLLEGE IN FALL,64%Class of 2015ENTERED ONE OF THE TEN UNIVERSITY OF HAWAI‘I CAMPUSES
High School to College Transition HighlightsUH MATHEMATICSClass of 2015UH ENGLISHClass of 2013Class of 201535%College-Level33% 2% PtsCollege-Level-4% PtsRemedial or Developmental28%Remedial or Developmental32%37%Not Enrolled in Math35%0% 2% Pts10% 20% 30% 40% 50% 60%Class of 201352%46% 6% Pts25%31%24%Not Enrolled in English23%0%-6% Pts 1% Pts10% 20% 30% 40% 50% 60%
UH Mathematics Enrollment, FallTop ImprovementsSCHOOLALL COLLEGE-LEVELREMEDIAL OR DEVELOPMENTAL20132015DIFF20132015DIFFWaimea18%48% 30%36%19%-17%Kea‘au24%44% 20%44%23%-21%Maui23%43% 20%28%28%0%Kaua‘i28%43% 15%34%24%-10%Kahuku19%33% 14%31%27%-4%STATEWIDE33%35% 2%32%28%-4%
UH English Enrollment, FallTop ImprovementsSCHOOLALL COLLEGE-LEVELREMEDIAL OR DEVELOPMENTAL20132015DIFF20132015DIFFWaimea37%62% 25%45%21%-24%Kapa‘a29%53% 24%30%19%-11%Kaua‘i39%62% 23%28%13%-15%Kea‘au29%51% 22%43%24%-19%Kahuku36%57% 21%43%30%-13%46%52% 6%31%25%-6%STATEWIDE
SPOTLIGHT SCHOOLS
Spotlight: Waipahu High School Increased dual credit participation and credits earnedDUAL CREDIT**CLASS OF 2013CLASS OF 2015DIFFERENCECompleters Who Participated in Dual Credit65 (13%)172 (32%) 19%Dual Credit Participants Who Earned 6College Credits28 (43%)83 (48%) 5%**Dual Credit includes Running Start, Jump Start, and Early Admit
Spotlight: Waipahu High School Increased college accessCollege Access Nationwide, FallStatewideWaipahu56%52%50%Waipahu is moving closer tothe statewide average: 14% Gap, Class of 2009 4% Gap, Class of 201536%Class of2009Class of2010Class of2011Class of2012Class of2013Class of2014Class of2015
Spotlight: Waiākea High School Increased on-time graduation rateWaiākea High SchoolStatewideClass of 201380%82%Class of 201483%82%Class of 2015 (Preliminary)86%82%ON-TIME GRADUATION RATE
Spotlight: Waiākea High School Increased dual credit participation and credits earnedDUAL CREDIT**CLASS OF 2013CLASS OF 2015DIFFERENCECompleters Who Participated in Dual Credit19 (8%)39 (14%) 6%Dual Credit Participants Who Earned 6College Credits6 (32%)27 (69%) 37%**Dual Credit includes Running Start, Jump Start, and Early Admit
Spotlight: Waiākea High School Increased college-level enrollment Decreased remedial/developmental enrollmentUH MATHEMATICSClass of 2015UH ENGLISHClass of 2013Class of 201539%College-Level34% 5% PtsClass of 201356%College-Level47% 9% Pts23%Remedial or Developmental-4% Pts27%39%Not Enrolled in Math17%Remedial or Developmental25%27%Not Enrolled in English10% 20% 30% 40% 50% 60%-2% Pts29%39%0%-8% Pts0%10% 20% 30% 40% 50% 60%
Spotlight: Kailua High School Increased dual credit participationDUAL CREDIT**CLASS OF 2013CLASS OF 2015DIFFERENCE8 (5%)30 (18%) 13%Completers Who Participated in Dual Credit**Dual Credit includes Running Start, Jump Start, and Early Admit
Spotlight: Kailua High School Increased college accessCollege Access Nationwide, FallStatewideKailua58%56%50%Class of2009Class of2010Class of2011Class of2012Class of2013Class of2014Class of2015
NEW CCRI DATA: COLLEGEPERSISTENCE
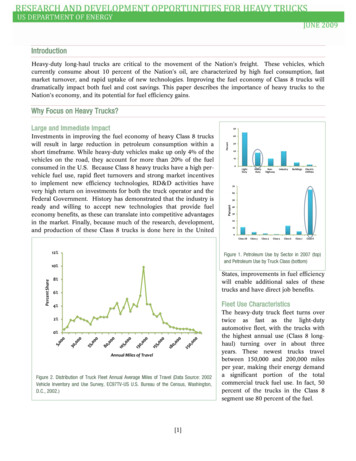
College Persistence* from First Fall to Second 66%65%60%Class of 2012Class of 2013All Institutions2-yearClass of 20144-year*Percent of HIDOE high school completers who enrolled in college during the first fall after high schooland who enrolled in any college during the second fall after high school
NEW CCRI DATA: COLLEGE ACCESSBROKEN DOWN BY DEMOGRAPHICCHARACTERISTICS
College Access Rate Disaggregatedby Gender, Race/Ethnicity, IncomePercent of Class of 2015 Graduates Enrolled in College Fall 201570%Female62%Non-NHPI62%Not EconomicallyDisadvantaged63%60%Statewide 56%13% Gap22% Gap19% Gap50%49%Male40%40%Native Hawn/Pac EthnicityEcon Disadv
College Access Rate Disaggregatedby GenderPercent of Class of 2015 Graduates Enrolled in College Fall 201580%70%Female62%13% Gap60%Female64%31% GapFemale and Male70%0% GapStatewide 56%50%40%49%Male30%33%Male20%StatewideKing Kekaulike HSMoanalua HS
College Access Rate Disaggregatedby IncomePercent of Class of 2015 Graduates Enrolled in College Fall 201580%70%Not EconomicallyDisadvantaged63%Not ntaged65%Not EconomicallyDisadvantaged64%Statewide 56%50%40%19% Gap44%EconomicallyDisadvantaged30%35% widePearl City HSMcKinley HS
College AccessStatewide: The 2% Increase in College Access Was Due to More NotEconomically Disadvantaged Students Enrolling100%90%80%70%Not EconomicallyDisadvantaged61%Not EconomicallyDisadvantaged63%Not EconomicallyDisadvantaged63%60%Statewide, 56%50%17% Gap40%30%19% Gap19% dvantaged44%EconomicallyDisadvantagedClass of 2013Class of 2014Class of 2015
Summary Increased participation in accelerated learning options– AP: increase in participation and students scoring 3 on an exam– Dual Credit: increase in participation and students earning 6 credits Decreased remediation in college New:– College Persistence– Disaggregation by demographic characteristics
Thank YouQUESTIONS?Karen LeeJean waii.edujosumi@hawaii.edu
College Persistence* from First Fall to Second Fall 60% 65% 70% 75% 80% 85% 90% 95% 100% Class of 2012 Class of 2013 Class of 2014 All Institutions 2-year 4-year *Percent of HIDOE high school completers who enrolled in college during the first fall after high school and who enrolled in any college during the second fall after high school 77% 66 .