Transcription
DatasheetDANZ Monitoring Fabric Simple, Scalable, EconomicalArista NetworksOur mission is to deliver next-generationdata center networking and monitoringsolutions — enabling enterprises to realizethe benefits of simplified productivity,improved scalability, and pervasive securitywith a dramatically improved TCO.DANZ Monitoring Fabric is a nextgeneration network packet broker(NPB) architected for pervasive, networkobservability delivering real-time andhistorical insights into your physical,virtual, and container environments.DANZ Monitoring Fabric OverviewDANZ Monitoring Fabric (DMF) is the industry’s first network packet broker(NPB) that leverages an SDN-controlled fabric using high-performance,merchant-silicon switches, and industry-standard x86 servers to deploy highlyscalable, agile, and flexible network visibility and security solutions. Traditionalbox-based, hardware-centric NPBs are architecturally constrained to meetemerging security and visibility demands of cloud-native data centers. DMFaddresses the challenges of traditional NPB solutions, by enabling a scale-outfabric for enterprise-wide security and monitoring, a single pane of glass foroperational simplicity, and multi-tenancy for multiple IT (NetOps, DevOps,SecOps) teams.Architecture: SDN Software powered Pervasive Network ObservabilityDMF’s architecture is inspired by Hyperscale Networking designs, which consistof merchant-silicon switch hardware, SDN controller software, and centralizedtool deployment.The DMF architecture consists of the following components: High-availability pair of SDN-enabled DMF controllers — VMs or hardwareappliances — that enable centralized configuration and simplifiedmonitoring and troubleshooting. Merchant-silicon switches - Leverages high performance, production gradeswitches from Arista, Dell and Accton. DMF Service Node (optional). DPDK-powered, x86-based appliance thatconnects to the DMF fabric (either singly or as part of a service-node chain)to provide advanced packet functions like deduplication, packet slicing,header stripping, regex matching, packet masking, GTP correlation, UDPreplication, and IPFIX/NetFlow generation. DMF Recorder Node (optional). x86-based appliance that connects tothe DMF fabric, managed by the controller to provide petabyte packetrecording, querying, and replay functions. DMF Analytics Node (optional). x86-based appliance that integrates withthe DMF fabric to provide multi-terabit, security, and performance analyticswith configurable historical time-series dashboards.arista.com1
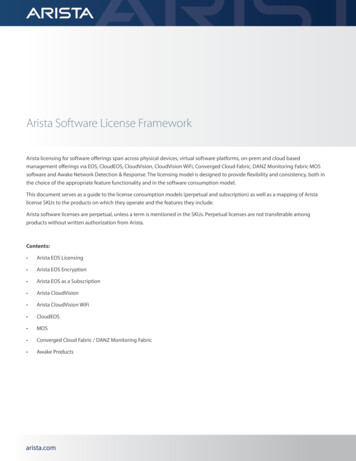
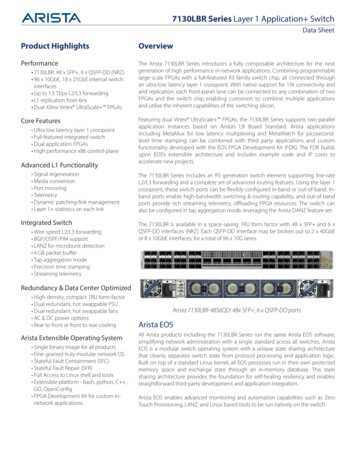
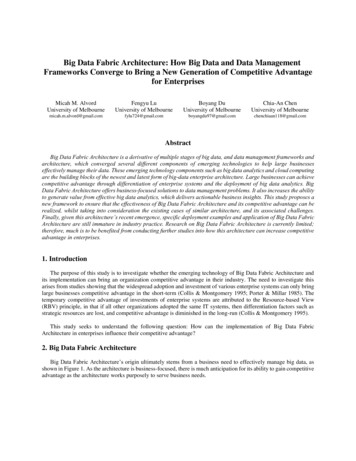
DatasheetSignificant CAPEX/OPEX SavingsDMF utilizes the underlying costefficiencies of the high performance,merchant-silicon switches, as wellas the industry-standard x86 basedappliances.The DMF enables a high-performance, integrated NPB analytics packet capturesolution that supports rapid detection and analysis of network performance andsecurity anomalies. DMF leverages merchant-silicon switches and commodityhardware to provide significant savings, both capital and operational. By contrast,the traditional NPB-based approach has high TCO due to ever-expanding boxby-box deployment, proprietary NPB hardware, and under-utilization of tools orinefficient use of them due to organizational silos.Open, Industry-Standard Hardware EconomicsDMF utilizes the underlying cost efficiencies of the high performance, merchantsilicon switches, as well as the industry-standard x86 based appliances. As a result,DMF is much more cost-effective for pervasive, scale-out monitoring.SDN-Enabled Operational EfficienciesDMF is provisioned and managed through the single pane of glass, thanks tothe DMF controller CLI, GUI or REST APIs. This operating model allows for easierintegration with existing management systems and monitoring tools. This SDNapproach hence significantly reduces the operating costs associated with box-bybox management of traditional NPBs.DMFControllersTap/SPANRemoteDMF AnalyticsNodesTap/SPANRemoteL2-GREAny vendorAny topologyAny virtualmachineAny containerProduction Network1/10/25/40/100GEthernet Switch FabricTap &SPANTrafficApp perf monitoringSecurity toolsVOIP monitoringDC/Campus NetworkDeduplicationPacket slicingPacket maskingHeader strippingRegex matchCentralized ToolsNetwork perf monitoringTraffic recordersNetflow generationTimestamping (SW based)GTP correlationUDP replicationDMF ServiceNodesDMF RecorderNodesDANZ Monitoring FabricFigure 1: DANZ Monitoring Fabric (DMF) Architecturearista.com2
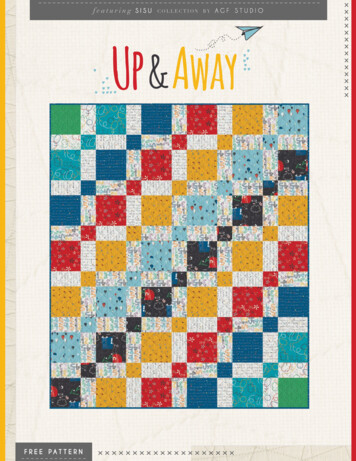
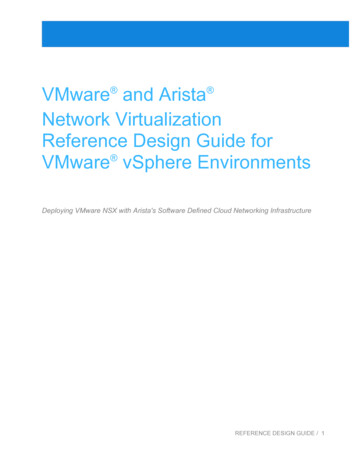
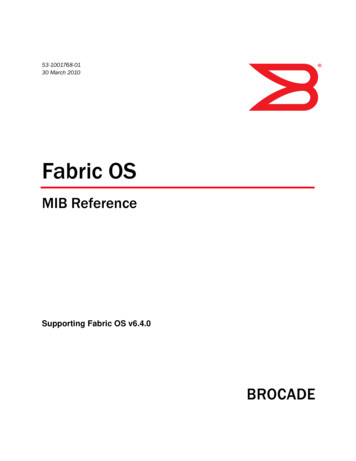
DatasheetDANZ Monitoring Fabric Product DescriptionDMF switches are deployed adjacent to the production networkby connecting to SPAN / TAP ports from the production network.The DMF controller serves as the single, central point ofmanagement for all deployed switches. The controller enablespervasive security and visibility for physical, virtual, andcontainer workloads for single, and multi-site deployments.DMF provides both basic and advanced NPB functions. Inaddition to basics such as filtering, aggregation, replication, andload-balancing, it also provides advanced packet functions likededuplication and packet slicing. DMF’s advanced functionsleverage the DPDK-powered, x86-based service nodes,supported by unique multi-tenant, monitoring-as-a-servicefunctions on a scaled-out switch fabric managed centrally by theDMF controller. DMF Controller also integrates with x86-basedanalytics and recorder nodes to capture cloud-native data centertraffic at scale. The nodes also support deep application-levelanalytics. The DMF Recorder Node allows high-performancepacket recording, querying, and replay functions. The DMFAnalytics Node provides unprecedented network visibility tomonitor, discover, and troubleshoot network and applicationperformance issues, as well as accelerating discovery of rootcauses of security breaches. With DMF Recorder and Analyticsnodes, users can achieve deep network telemetry for traditionaldata center environments. With these tools, the network teamcan replay past conversations across users and applications witha single click.Figure 2: DANZ Monitoring Fabric Graphical User Interface (GUI)arista.com3
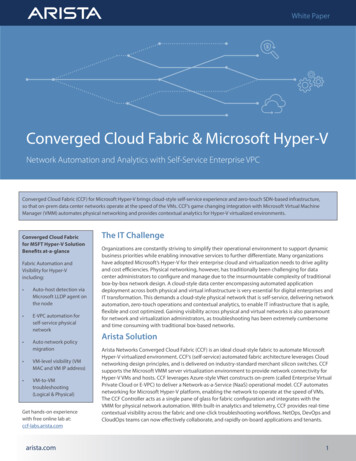
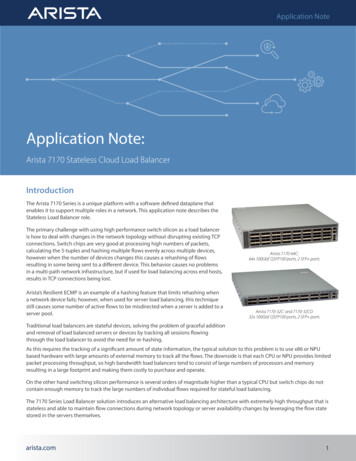
DatasheetDatacenter networks are transitioning to modern 10G/40G,25G/100G, and 40G/100G designs to meet the demands ofcloud computing, data analytics, and 4G/5G LTE mobile services.The corresponding traffic monitoring networks also need totransition to next-generation designs. The exponential growthin data center size, bandwidth, and traffic and the demandfor monitoring a greater portion of network traffic togethertest the limits of traditional monitoring/visibility designs. Thetraditional box-by-box approach based on proprietary networkpacket brokers (NPBs) has proven to be cost-prohibitive and toooperationally complex for organization-wide monitoring.With DMF scale-out architecture, simplified operations, andopen switch economics, DMF is rapidly becoming an attractivealternative to legacy NPBs. Two popular use cases haveemerged: Pervasive security and visibility: monitor or secure everylink.Multi-site Monitoring: monitor or secure remote DCs/POPs/branches/sites/environments.DMF supports topology agnostic, highly scalable fabrics.Depending on the customers’ requirements, a range oftopologies is supported—from a single-switch fabric to a scaleout, multi-switch/ multi-layer fabric. A typical multi-layer DMFfabric design has a layer of switches labeled as filter switchesand a layer of switches labeled as delivery switches. Most switchinterfaces in the filter-switch layer are wired to passive opticaltaps or switch/router/ firewall SPAN ports in the productionnetwork; they are configured as filter interfaces in the DMFcontroller software user interface. Switch interfaces in thedelivery-switch layer are wired to tools and are configured asdelivery interfaces. Filter interfaces (where packets come intothe fabric) and delivery interfaces (where packets go out of thefabric to tools) represent the primary functions of DMF.Monitor every location: Enterprises can extend DMF across L3WAN to enable monitoring of remote DCs/POPs, colo facilities,campus/branch locations, and retail environments. This allowscentralized monitoring tools and staff in a few data centers,dramatically reducing CapEx and Opex while empoweringoperations teams to monitor networks across the entireorganization. By simply deploying a commodity Ethernet switchat each monitored location, the entire DMF (including remotelocation switches) is operated and managed centrally via theDMF controller with high availability.Fabric ControllersDMF AnalyticsNodesL2-GRE TunnelsDeeper Packet Monitoring:Up to 128 bytes, including GTP,SCTP, GRE, VXLAN, MPLS, etc.Filter PortsRemote Location Monitoring:Troubleshoot network problems inremote locations via centralized toolsProductionTAP & SPANCentralizedVisibility ToolsDelivery PortsRemote FPTunnel Ports1/10/25/40/100G OpenNetworking Switch FabricPrimary DataCenterNetwork Pref MonitoringApplication Pref MonitoringSecurity ToolsDMF ServiceNodesDMF RecorderNodesFigure 3: DANZ Monitoring Fabric - Monitor Every Location with Centralized Tools and Managementarista.com4
DatasheetFeatureAdvanced Filtering & DeeperPacket Matching CapabilitiesDescription / Benefit L2/L3/L4 header filtering on ingress and packet replication (as required) in the fabricfor multiple egress tools. Deeper Packet Matching (DPM) with masking (up to 128 bytes in packet). Supportsmatching on inner header fields for encapsulated packets (e.g MPLS, VXLAN, GRE)and/or protocols (e.g. GTP, SCTP). IPv4 and IPv6 based filtering. IPv4, IPv6, MAC Address masking, TCP Flags, DSCP matching. Support filtering on inner VLAN of a Q-in-Q packetSpecialized Packet Functions Packet De-duplication—Enhances tool efficiency, by dropping duplicate packets. Packet Slicing—Improves security and tool throughput by stripping off the payload. Packet Masking—Improves security by hiding user/confidential information such asCredit card, SSN, passwords, medical or financial data to comply with SOX, HIPAA andPCI regulations. Regex Pattern matching—Improves filtering of traffic based on regex patternsanywhere within the packet. Header stripping for VXLAN, Cisco Fabric Path, LISP, GENEVE, PPPoE, ERSPAN, andMPLS packets. A generic user-defined header stripping function is also supported. IPFIX/Netflow/sFlow Generation Function is also supported. L2GRE tunnel packet decapsulation. VLAN tag stripping—Useful for stripping RSPAN tag. VLAN tag push—Useful for filter interface tagging. Match on inner packet post stripping. GTP correlation—Associates user plane GTP-u data with control plane GTP-c sessionsbased on IMSI, IMEI, and TEID. Supports load balancing of GTP correlated data to multipleanalytics tools while preserving subscriber data flow consistency without any filteringor drops. Supports filtering, whitelisting, and blacklisting of subscriber traffic. UDP Replication – Supports replication of UDP packets like NetFlow, IPFIX, sFlow,Syslog, and SNMP and send them to multiple, different collectors Additional specialized packet functions (like SSL decryption) can be realized by servicechaining 3rd party NPBs as service nodesVirtual Workload Monitoring(VM/Container)arista.com Support scalable, agentless monitoring of Virtual Machines. Support centralized, dynamic VM monitoring.5
DatasheetFeatureDMF Recorder NodeDescription / Benefit Enables Traffic Capture for Cloud-Native Network Defense & Rapid Remediation atScale Leverages easy to use, scale-out, high performance industry-standard x86 basedappliances Integrated / centralized configuration and operational workflows via DMF Controller Feature-rich capturing, querying and replay functions Supports PTP / NTP based timestamping Programmable and scriptable via REST APIsDMF Analytics Node Leverages easy to use, scale-out, high-performance industry-standard x86 basedappliances. Enables pervasive observability for real-time and historical data delivering a NetworkTime machine. Machine Learning and Application Dependency maps provide deeper insights andrapid remediation. Supports various health/capacity planning/troubleshooting dashboards. Supports network performance views like Top Talkers, Top Apps, TCP connection/latency tracking. Supports Security views identifying rogue DHCP/DNS servers, identifies IP/MACspoofing. Support various host views such as New Hosts seen and what OS is on the hosts. Supports automatic alerting on exceeding various thresholds such as link utilization. Supports sFlow/NetFlow collection to provide real-time visibility, including tunneledor encapsulated traffic, enable detection of security attacks like DoS/DDoS andsupport sub-second triggering.Pervasive Visibility(Monitor or Tap Every Rack) Packet filtering, aggregation, tool port load-balancing, and packet replicationfunctions. Single switch or scale-out 1/2/3 layer fabric designs: 1G, 10G, 25G, 40G & 100G. Centralized fabric/policy definition and instrumentation of open Ethernet switcheswithin the network. Programmatic event-triggered monitoring (via REST API). Multiple overlapping match rules per filter interface based on a variety of L2, L3, L4header, as well as via deeper packet matching (DPM) attributes. Time/packet-based scheduling of policies. Efficient utilization of open Ethernet switch capabilities via Controller Policy OptimizerEngine.arista.com6
DatasheetFeatureHigh Performance, HighlyScalable Network MonitoringFabricDescription / Benefit High availability for the controller as well as the fabric. Auto Fabric Path Computation that detects and responds to failures in the monitoringnetwork. Policy-based load balancing of core links with failover detection to efficiently utilizefabric bandwidth and ensure resiliency. Detection of service node/link failure and an option to bypass the service. Link aggregation (LAG) in the open Ethernet fabric (including across core links, servicenode links, and delivery links). Tagging policy or tap (filter) interfaces. Supports a variety of security and monitoring tool vendors. Supports a variety of NPBs as stand-alone or chained service nodes.Centralized Management,Configuration,Troubleshooting DMF Controller is the single pane of glass for fabric and policy management. Policies can be configured from a centralized controller to forward flows from multiplefilter interfaces to multiple delivery interfaces, including optional service nodes.Packet replication is made at the last common node to optimize the fabric bandwidth. GUI, REST API, and CLI for configuration and viewing operational state. Centralized interface, flow, and congestion-statistics collection. Simplified install/upgrade of the fabric via the DMF Controller (zero-touch fabric). Supports IPv6 Management IP address. Supports virtual IP addresses for the controller high-availability pair.Multi-DC/Multi-SiteTunneling Centralized monitoring of remote DCs/POPs/branches/sites (across L3 WAN).(Tap Every Location) Replication of packets across tunnels. Support tools located in a single tool farm in a centralized DC. Tunneling at 1G, 10G, 25G, 40G and 100G bandwidths. Rate limiting of monitored traffic before entering L3 WAN. Tunneling enabled on a per-switch basis.Security and ControlledAccess TACACS , RADIUS-based authentication and authorization.(Monitoring as a Service) Multi-tenancy for advanced overlapping policies across multiple user groups tomonitor the traffic from the same tap interface to various tool interfaces. Role-based access control (RBAC) for administratively defined access control per user. Tenant-aware Web-based management GUI, CLI, and REST API. Self-service monitoring across multiple groups/business units using the sameunderlying infrastructure.arista.com7
DatasheetFeatureDescription / BenefitMarker Packet GenerationInjection of a marker packet into the tool or pcap file.Fabric wide CRC checkAllow/Disallow bad CRC packets in the production network to reach the tools for analysis.(Graphical User Interface)Rich Web-Based GUI The dashboard shows the resources used by the fabric as well as a bird’s eye-view ofthe topology. A highly attractive as well as functional GUI topology view that shows: All the switches/ports in the fabric. Paths taken across the fabric on a per-policy basis. An intelligent context-sensitive properties panel triggered by a mouse-over on atopology object. Customizable tabular views that persist according to user preferences. Various table export options like JSON and CSV are available throughout the GUI. Presents a highly intuitive, simplified management and operations workflow.Switch Platform SupportArista Switch Platform SupportGeneral-purpose monitoringSupport for general-purpose monitoring with Arista 10G/25G and 40G/100G platforms: 48x25G 8x100G32x100G64x100GMission-critical monitoringSupport for mission-critical monitoring with Arista deep-buffer, large TCAM 10G, 25Gand 40G/100G platforms: 48 x10G 6x100G (deep-buffer, large TCAM)48x25G 6x100G (deep-buffer, large TCAM)32x100G 4x400G (deep-buffer, large TCAM)3rd-Party Switch Platform SupportGeneral-purpose monitoringSupport for general-purpose monitoring with DellEMC 10G, 25G, 40G and 100Gplatforms: 48x10G 4x40G/6x40G/4x100G48x25G 6x100G32x40G32x100G64x100GFor the complete list of supported switch vendors/configurations and optics cablesincluded in the DANZ Monitoring Fabric Hardware Compatibility List (HCL), pleasecontact the Arista Sales Team (sales@arista.com).arista.com8
DatasheetDMF Controller Appliance SpecificationThe DMF Controller can be deployed either as a virtual machine appliance on an existing server or as a hardware appliance.Controller VM Appliance SpecificationsThe DMF Controller is available as a virtual machine appliance for the following environments.EnvironmentLinux KVMVersion Ubuntu 16.04 Ubuntu 18.04 Ubuntu 20.04Please refer to the Hardware Compatibility List for release specific details.VMware ESXi Version 6.5.0 Version 6.7.0 Version 7.0.2Note: The above table explicitly indicates the Major/Minor/Maintenance versions tested and supported by DMF. Versions other thanthe ones listed above will not be supported.Minimum VM Requirements4 vCPU with a minimum scheduling of 1GHz8 GB of virtual memory400 GB of Hard disk1 virtual network interface reachable from physical switchesNote: A VM’s performance depends on many other factors in the hypervisor setup, and as such, we recommend using hardwareappliance for production deployment.arista.com9
DatasheetDMF Controller Hardware Appliance Specification (DCA-DM-CDL)The DMF controller is available as an enterprise-class, 2-socket, 1U rack-mount hardware appliance designed to deliver the rightcombination of performance, redundancy, and value in a dense chassis.Arista DMF Controller: DCA-DM-CDLFeatureTechnical SpecificationsDCA-DM-CDLProcessorIntel Xeon 2 sockets (10 cores)Form Factor (H x W x D)1U Rack Server (4.28cm x 43.4cm x 69.3cm)Weight38.6 lbsMemory4 x 16GBHard Drive2 x 1TB SATA (with RAID support)Networking2 x 1Gb; 2 x 10Gb; 2 x 10Gb Base-TPowerInput Power: 302 wattsMax Power : 403.1 wattsInput Current: 2.7 Ampsarista.com10
DatasheetDMF Service Node Hardware Appliance Specification (DCA-DM-SC, DCA-DM-SDL, , DCA-DM-SEL)The DMF Service Node appliance is an enterprise-class, 2-socket, rack-mount hardware appliance, designed to deliver the rightcombination of performance and value.It is available in 3 form-factors: 1U w/ 4x10G bidirectional interfaces. 2U w/ 16x10G bidirectional interfaces. 2U w/ 16x25G bidirectional interfacesThe DMF Service Node provides specialized packet functions like deduplication, packet slicing, header stripping, regex matching,packet masking, GTP correlation, UDP replication, and IPFIX/NetFlow generation. Once connected to the fabric, the DMF controllerauto-discovers the service node and becomes the single, central point of management and configuration of the service node. Thishighly scalable architecture allows chaining of multiple service nodes that are connected to the fabric via the service node chainingfunction of the DMF.Arista DMF Service Node: DCA-DM-SCArista DMF Service Node: DCA-DM-SDLArista DMF Service Node: DCA-DM-SELarista.com11
DatasheetTechnical Service Node (4 x10G)Service Node (16 x 10G)Service Node (16 x 25G)ProcessorIntel Xeon 1 socket (12 cores)Intel Xeon 2 socket (12 cores)Intel Xeon 2 socket (20 cores)Form Factor(H x W x D)1U Rack Server2U Rack Server2U Rack Server4.28cm x 43.4cm x 75.7cm8.68cm x 43.40cm x 48.20cm8.68cm x 43.40cm x 48.20cmWeight48.3 lbs73 lbs73 lbsMemory6 x 8GB RDIMM, 2666 MT/s,Single Rank12 x 8GB RDIMM, 2666 MT/s,Single Rank24 x 16GB, 3200 MT/S, Dual RankHard Drive1 x 1TB SAS1 x 1TB SAS1 x 960GB SATANetworking4 x 10Gb; 2 x 10Gb 2 x 1Gb16 x 10Gb; 2 x 10Gb 2 x 1Gb16 x 25Gb;2 x 1Gb; 2 x 10GbPowerarista.comInput Power: 196 wattsInput Power: 318 wattsInput Power: 568 wattsMax Power : 308 wattsMax Power : 569 wattsMax Power : 846 wattsInput Current: 1.8 AmpsInput Current: 2.9 AmpsInput Current: 5.2 Amps12
DatasheetDMF Analytics Node Hardware Appliance Specification (DCA-DM-AA3)The DMF Analytics Node appliance is an enterprise-class, 2-socket, rack-mount hardware appliance designed to deliver the rightcombination of performance and value. It is available in a 1RU form-factor.DMF Analytics Node provides scale-out analytics with configurable, historical time-series based dashboards for health, performance,capacity planning and security. It also acts as a collector for NetFlow and sFlow packets to provide real-time application levelvisibility, including tunneled or encapsulated traffic, enable detection of security attacks like DoS/DDoS, and support sub-secondtriggering. The highly intuitive and customizable GUI dashboards support a Google-like search to quickly drill down and focus onthe possible issues quickly. It not only provides variety of reporting and alerting functions but also allows the user to easily sharecustom dashboard views with other team members for collaborative analysis, troubleshooting, and remediation.Arista DMF Analytics Node: DCA-DM-AA3FeatureTechnical SpecificationProcessorIntel Xeon 2 sockets (10 cores)Form Factor (H x W x D)1U Rack Server (4.28cm x 43.4cm x 69.3cm)Weight38.6 lbsMemory8 x 16GBHard Drive2 x 1TB SATA, 2 x 960GB SSD SASNetworking2 x 1Gb; 2 x 10Gb; 2 x 10Gb Base-TPowerInput Power: 339 wattsMax Power : 448 wattsInput Current: 3.1 Ampsarista.com13
DatasheetDMF Recorder Node Hardware Appliance Specification (DCA-DM-RA3)The DMF Recorder Node appliance is an enterprise-class, NEBS Level 3 & ETSI compliant, 2-socket, rack-mount hardware appliance,designed to deliver the right combination of performance, capacity, and value. It is available in a 2RU form-factor, supporting a1x25G interface and a total available storage of 192TB.The DMF Recorder Node provides high-performance packet recording, querying, and replay functions. Once connected tothe fabric, the DMF controller auto-discovers the recorder node, ensuring a single point of configuration and device lifecyclemanagement. Multiple recorder nodes can be clustered together to present a view of a single, logical recorder node that allowsusers to store more network traffic for longer periods and retrieve packets from the single logical recorder node interface viathe controller. This architecture provides true scale- out characteristics while maintaining the agility and simplicity in the userworkflows. The recorder node provides feature-rich capture, query, and replay functions. The recorder node allows the user to replaythe specifics of an event to derive root cause and predict future trends for various performance issues and security threats.Arista DMF Analytics Node: DCA-DM-AA3FeatureTechnical SpecificationsDCA-DM-RA3ProcessorIntel Xeon 2 sockets(20 cores)Form Factor (H x W x D)2U Rack Server(8.68cm x 43.4cm x 71.6cm)Weight73 lbsMemory16 x 16GBHard Drive16 x 12TB SAS HDD,2 x 7.68TB SAS SSDNetworking2 x 1Gb Base-T; 2 x 25Gb;2 x 10Gb Base-TPowerInput Power: 730 wattsMax Power : 1111.7 wattsInput Current: 6.6 Ampsarista.com14
DatasheetSanta Clara—Corporate Headquarters5453 Great America Parkway,Santa Clara, CA 95054Phone: 1-408-547-5500Fax: 1-408-538-8920Email: info@arista.comIreland—International Headquarters3130 Atlantic AvenueWestpark Business CampusShannon, Co. ClareIrelandIndia—R&D OfficeGlobal Tech Park, Tower A , 11th FloorMarathahalli Outer Ring RoadDevarabeesanahalli Village, Varthur HobliBangalore, India 560103Vancouver—R&D Office9200 Glenlyon Pkwy, Unit 300Burnaby, British ColumbiaCanada V5J 5J8Singapore—APAC Administrative Office9 Temasek Boulevard#29-01, Suntec Tower TwoSingapore 038989San Francisco—R&D and Sales Office 1390Market Street, Suite 800San Francisco, CA 94102Nashua—R&D Office10 Tara BoulevardNashua, NH 03062Copyright 2022 Arista Networks, Inc. All rights reserved. CloudVision, and EOS are registered trademarks and Arista Networksis a trademark of Arista Networks, Inc. All other company names are trademarks of their respective holders. Information in thisdocument is subject to change without notice. Certain features may not yet be available. Arista Networks, Inc. assumes noresponsibility for any errors that may appear in this document. April 12, 2022arista.com15
DANZ Monitoring Fabric is a next-generation network packet broker (NPB) architected for pervasive, network observability delivering real-time and historical insights into your physical, virtual, and container environments. DANZ Monitoring Fabric Overview DANZ Monitoring Fabric (DMF) is the industry's first network packet broker