Transcription
The Business Impact of ESG PerformanceWHITEPAPERJUNE 2022AbstractAuthorsDouglas Dwyer – Managing Director, Research 1 212.553.4323Douglas.Dwyer@moodys.comMateusz Giezek – Associate Director, Research 1 212.553.0378Mateusz.Giezek@moodys.comRichard Loeser Director, Research 44 s around the Environmental, Social, and Governance (ESG) aspects ofcompanies have become a factor widely taken into account by investors and other marketparticipants, consumers, and stakeholders. Using ESG controversies collected by Moody’s ESGSolutions and ESG data from RepRisk, we analyze the effects of ESG performance on firmmarket value. Our findings show that ESG controversies lead to large, statistically significantnegative abnormal equity returns, both in the short-run and over a one-year horizon. We findthat moderate to severe ESG events generate abnormal stock market losses of 1.3% to 7.5% over twelve months, which represents a loss of approximately 400 million for atypical-sized firm in the study.Maitena Pineiro – Assistant Director, Research 44 207.772.1755Maitena.Pineiro@moodys.comEditorChris Crossen – Associate Director, Research 1 dgementsWe thank Moody’s ESG and RepRisk forproviding us with access to their ESG data.Contact UsAmericas 1.212.553.1658clientservices@moodys.comEurope 44.20.7772.5454clientservices.emea@moodys.comAsia (Excluding Japan) 85 2 2916 1121clientservices.asia@moodys.comJapan 81 3 5408 4100clientservices.japan@moodys.comMOODY’S ANALYTICSTHE BUSINESS IMPACT OF ESG PERFORMANCE1
Table of Contents1. Introduction32. Literature Review and Contribution43. ESG Controversies Data3.1 Moody’s ESG Solutions Controversies3.2 Selected Controversies5554.Event Study Methodology and Stock Return Data4.1 Abnormal Returns4.2 Statistical Tests4.3 Stock Return Data4.4 Return Statistics667775. The Value Impact of Individual Controversies5.1 Short-Run Effects5.2 Long-Run Effects8896.Using Events to Measure ESG Performance: A Controversy Frequency Score (CFS)6.1 Construction of the CFS6.1.1 Controversy Characteristics6.1.2 Time Discounting6.1.3 Decreasing Marginal Contribution6.2 Distribution of the CFS6.3 Average CFS Values by Size and Sector111111121212137. Stock Price Effects of a Deterioration in ESG Performance7.1 The distribution of CFS Changes7.2 Changes in CFS and Abnormal Returns7.3 The Role of Previous Events for the Business Impact of CFS Increases7.4 Results by Firm Size7.5 Results by Sector1314141516178.Conclusion199. Appendix: Results using RepRisk Data20References23MOODY’S ANALYTICSTHE BUSINESS IMPACT OF ESG PERFORMANCE2
1. IntroductionThe topic of ESG is omnipresent in the world of business and finance today. There are currently more than 35 trillion assets undermanagement in sustainable investments. 1 Executive pay is being tied to ESG performance. 2 Firms are being held responsible for theESG quality of their supply chains. 3 In the age of social media, ESG-related events can reach a global audience overnight.The moral component of ESG is certainly a strong argument for its relevance. Yet, many business and finance decision makers aretasked with a focus on more tangible outcomes in their day-to-day work, and it is not always clear why they should care aboutESG. How does ESG actually affect the metrics that they are responsible for?In this paper, we show that ESG performance is very relevant for firms’ financial results and value. While this may not be a surprisefor global events (such as the Volkswagen emissions scandal), our study is broad-based, taking into account 13,000 ESG events(“controversies”) worldwide collected by Moody’s ESG Solutions. Measuring ESG performance using a Controversy FrequencyScore (CFS) varying between 0 and 100, based on the events a firm experienced over the past two years, we find that adeterioration in performance driven by an increase in controversies is significantly related to stock market losses, both in the shortrun and over a return horizon of one year.The effects we find range from meaningful for events that happen rather frequently, to dramatic for the most severe, rarer events.Having at least one ESG controversy of any kind during a given month leads to an abnormal stock return (measured using amarket model) of 0.37% over two months. Monthly increases in the CFS by 30 or more points generate statistically significantabnormal returns of 0.91% over two months, and 1.88% over twelve months. CFS jumps of this magnitude occur 1,732 times inour sample of 3,468 firms, so that, statistically, over half of firms are affected once during our analysis period January 2015 toJanuary 2019. Overall, moderate to severe ESG events generate abnormal stock market losses of 1.3% to 7.5% over twelvemonths. With the median market capitalization of firms in our sample at 11.7 billion, the typical dollar value lost over one year isapproximately 400 million.In addition to the analysis based on Moody’s ESG Controversies, we also run tests using data provided by RepRisk, a Swiss ESGanalytics firm. RepRisk calculates a score, the RepRisk Index (RRI), based on ESG incidents that they gather. The results reported inthe Appendix confirm the strong relationship between ESG performance and stock returns over a horizon up to one year.We also investigate whether a firm’s prior ESG performance history has a bearing on our results. Large deteriorations in theControversy Frequency Score occur more frequently for firms with few or no recent events recorded about them, becausesubsequent events do gradually less to raise the CFS. We find that firms with existing ESG concerns (CFS 0) are less vulnerableto losses from ESG events, controlling for the degree of performance deterioration. Stock investors seem to be pricing furtherevents in for firms with a known ESG history, which remains in line with findings by Pineiro et.al (2021), that there is persistence inESG incidents.While there are differences in overall controversy rates across sectors, sizeable CFS jumps occur in all of them. However, we findvariation in the impact on stock returns. In Construction, Consumer Products, Energy & Natural Resources, and Finance, firmssuffer large negative abnormal returns over twelve months, ranging from 3.17% to 5.72%. We also find evidence of a negativevalue impact in Business Products, Utilities, Hi-Tech, and Trade, but, in the remaining sectors, there is little measurable effect ofCFS increases.The Controversy Frequency Score that we create summarizes controversies a firm has experienced during the past two years into aquantitative measure of the current ESG performance of a firm. ESG controversies are outcomes influenced both by the exposureof a firm to ESG risk as well as their ESG policies, and thus represent a direct measure of ESG performance. 4 The construction ofthe score is based on a number of intuitive principles, such as that more recent and more severe controversies receive a eiro et.al. (2022) show that by adopting ESG policies, firms can influence the number of ESG controversies that they suffer.MOODY’S ANALYTICSTHE BUSINESS IMPACT OF ESG PERFORMANCE3
weight, and that the marginal contribution of events is decreasing. Our key use case of the CFS in this paper is measuringdeteriorations in ESG performance.ESG events can affect firm value through a number of channels. A firm’s balance sheet can be directly affected if an event involvesproperty destruction or a fine. Many events entail costs, such as a product recall or a labor dispute involving a strike. Reputationcan play a role, both with customers lowering demand for the firm’s products, as well as with possible business partners reducingthe firm’s opportunities. Finally, market value can also be affected if morally-minded investors sell the stock.Various approaches can be employed to create a quantitative score based on information regarding a firm’s ESG events. For theControversy Frequency Score, we use a weighted moving average (WMA) approach, taking into account events going back a fixedtime interval and weighting recent events more strongly. WMA is a standard technique in quantitative finance, with applicationsincluding technical analysis and volatility modeling. Other quantitative scoring approaches include statistical models to predictfuture ESG events (see Pineiro et.al. (2022)) or event count-based measures.The remainder of this paper is organized as follows. After a review of the literature in Section 2, we discuss the Moody’s ESGcontroversies data in Section 3, and the event study methodology and our equity return data in Section 4. In Section 5, weinvestigate the stock market effects of individual ESG controversies, independent of firms’ ESG history. In Section 6, we introducethe Controversy Frequency Score, before employing changes in the score as a measure of ESG performance deterioration in eventstudies in Section 7. Section 8 concludes. In the Appendix, we present an analysis using RepRisk incidents data.2. Literature Review and ContributionVarious questions around the relationship between ESG and business outcomes have been studied in the literature. These include:Does a portfolio constructed using ESG criteria generate alpha? Glossner (2018) shows this to be true for a portfolio of high-riskfirms. Serafeim (2018) finds significant alpha for a factor that goes long on firms with good ESG performance and negativesentiment momentum. Are firms with good ESG risk management more successful? Khan, Serafeim, and Yoon (2015) show thatfirms with strong performance on ESG criteria material to their business have superior stock returns. Eccles, Ioannou, Serafeim(2014) show that firms who adopted ESG policies early on did well in the long run. Is ESG performance relevant for a firm’s creditrisk? Devalle, Fiandrino, and Cantino (2017) show a positive effect on credit ratings for social and governance issues, but not forenvironmental ones.There are a few papers which, like ours, focus on identifying the effects of ESG events on firm value. Krueger (2015), the work mostsimilar to ours, uses ESG events based on public sources like news or NGO reports. In an event study of abnormal returnscalculated with a market model, he finds an average effect of 1.3% over 21 days. Events are classified into six categories, andKrueger finds the biggest effects (over 3%) for the stakeholder issues Community and Environment, smaller ones for Product andEmployee Relations, and none for Human Rights and Diversity. Finally, he calculates the median cost over the 1,500 events studiedto be 76m. Another closely related paper is Lundgren and Olsson (2010), who study abnormal stock returns aroundenvironmental events, and find significant effects for European firms. Glossner (2018), even though the main focus of his paper isalpha, also provides evidence of the negative direct stock market effect of ESG events, with magnitudes similar to our findingsbelow. La Torre, et.al. (2020) run firm-level monthly time-series regression of stock returns on changes in components of the “ESGOverall” score. They find significant relationships only for a small number of the 47 firms that they study, often in the energy andutilities sectors. Finally, Frooman (1997) in a meta-analysis of 27 studies reports that “illegal and illicit behavior” shifts abnormalreturns by a full standard deviation.Our present paper extends the literature in a couple of dimensions. In contrast to previous papers, we study the return impact ofESG events over a horizon of up to one year. We consider effects across different event qualities, ranging from “smaller” to themost serious, rare events. Last, our study is conducted on a global sample covering the majority of existing listed firms. Whilethere is general agreement that ESG events can have a negative effect on shareholder value, open questions remain regarding howmuch damage which type of event does, over what time horizon, whether the effect is persistent, and which firms are moststrongly affected. By quantifying the effects that ESG events can have on shareholder value along various dimensions, we aim toprovide answers to these questions.MOODY’S ANALYTICSTHE BUSINESS IMPACT OF ESG PERFORMANCE4
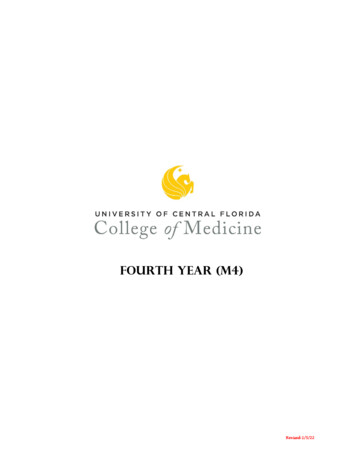
3. ESG Controversies Data3.1 Moody’s ESG Solutions ControversiesMoody’s ESG Solutions is a business unit of Moody’s Corporation that serves the growing global demand for ESG and climateinsights. Moody’s identifies companies’ involvements in ESG controversies, defined as public information or contradictory opinionsfrom reliable sources that incriminate or make allegations against an issuer regarding how it handles ESG issues. Each controversymay relate to several facts or events, to their conflicting interpretations, legal procedures or non-proven claims. Moody’s screens apre-defined population of companies on a daily basis, currently covering 10,000 companies regarding their involvement in ESGcontroversies across 38 ESG issues. The dataset currently contains over 22,000 entries with coverage going back to 2007.Moody’s identifies controversies from a daily newsfeed that includes company sources, news, and stakeholder sources. Potentialcontroversies are evaluated for their impacts on both companies and stakeholders. Once identified, each controversy is classifiedregarding severity and responsiveness. Severity is defined based on the scale, the scope, and the remedial/irremediable nature ofthe controversy for both stakeholders and companies, and possible values are “Minor,” “Significant,” “High,” and “Critical.”Responsiveness refers to a firm’s reaction to a specific event, including measures to remedy the specific case and preventreoccurrence in the future, with possible values “Proactive,” “Remediative,” “Reactive,” “Non-communicative.” The research teammonitors each controversy’s evolution and provides updates about significant developments.In addition to firm name and identifier, date, severity, and responsiveness, the dataset contains the following information abouteach controversy:»»»»»»Title (usually one sentence)Description (usually multiple paragraphs)Sources (publication name, date, title)Location (list of countries)Related topics (combination of E, S, and G)Related detailed topics (combination from list of 171 topics)Whenever Moody’s provides updates to a controversy, there are multiple entries in the database for the same controversyidentifier. For our analysis, we use the first entry for each controversy by date, with a tie-breaking logic for the rare event of twoentries on the earliest date. Our final dataset contains 22,253 controversies for 3,486 firms between January 2008 and October2021. Figure 1 shows the distribution by year.Figure 1Distribution of ESG controversies over timeNote: Controversies are dated by the first related entry in Moody’s ESG Solutions’ database.3.2 Selected ControversiesControversies encompass a broad range of different events connected by the common theme of ESG, which we view as inclusiveof any issues impacting a firm’s stakeholders. By their nature, some controversies have a more direct relationship to a firm’s equityholders than others. For example, a plant explosion constitutes a destruction of value, and a levied regulatory fine constitutes acash outflow. Whereas an alleged water well contamination or a union’s petition to address unhealthy working conditions mayultimately result in costs to the firm, but these are less direct. Our aim is to test the hypothesis that controversies of the formerMOODY’S ANALYTICSTHE BUSINESS IMPACT OF ESG PERFORMANCE5
kind have a greater impact on firm value than the latter. We are not aware of an accepted classification of ESG events with respectto their “financial relevance” and expected negative impact on shareholders.Moody’s assigns related topics to each controversy out of a list of 171 possible topics. To test our hypothesis, we classify thesetopics in an ad-hoc way based on our intuition into two groups, “direct financial impact” and “indirect financial impact.” Ourapproach is based on the assumption that for a large number of these topics such a categorization will be rather obvious. Webelieve that most people would understand that “Fraud” or “Product Recall” are directly financially relevant, while “Impact onBiodiversity” or “Damages for Local Employment” may have a more indirect financial impact. If our assumption is true, then anintuition-based distinction will generate a meaningful classification and allow us to test our hypothesis, even if for a number oftopics the classification is debatable.4. Event Study Methodology and Stock Return DataIn order to measure the effects of ESG-related events on firm value, we conduct event studies using firms’ abnormal stock marketreturns. This approach is well-established in financial econometrics (see e.g. Campbell, Lo, MacKinlay (1997)). Stock market value isa forward-looking measure that gauges firm value in real time, making it suitable for event studies, since it allows good associationbetween timed events and firm value, limiting the effects of confounding factors. Furthermore, event studies rely on asophisticated and well-established theoretical machinery that produces expected equity returns, against which observed valuechanges can be compared.4.1 Abnormal ReturnsIn a factor model, the expected return of a firm is a function of its exposures, or betas, to systematic risk factors. In this paper, wework with the so-called market model (see MacKinlay (1997)), which has as only risk factor, the overall market return (termed𝑀𝑀𝑀𝑀𝑀𝑀 in the following). We match the market factor to the location of the headquarters of the firm by region. 5We conduct our analysis monthly, and we estimate the parameters in rolling 60-month regressions. A firm’s exposure to themarket factor will thus vary from one month to the next. Specifically, firm 𝑖𝑖’s exposure at time 𝑡𝑡, 𝛽𝛽𝑖𝑖𝑖𝑖 , is estimated using individualstock returns 𝑅𝑅 and factor observations 𝑀𝑀𝑀𝑀𝑀𝑀 in periods 𝜏𝜏 𝑡𝑡 60, , 𝑡𝑡 1 in the time-series regression𝑅𝑅𝑖𝑖𝑖𝑖 𝛼𝛼𝑖𝑖𝑖𝑖 𝛽𝛽𝑖𝑖𝑖𝑖 𝑀𝑀𝑀𝑀𝑇𝑇𝜏𝜏 𝜀𝜀𝑖𝑖𝑖𝑖 .All returns are log returns, and the regressions are estimated using OLS, requiring a minimum of 30 observations.Abnormal returns are then calculated “out-of-sample” as the difference between a firm’s stock return and its expected value,calculated using the ex-post realized market return and estimated coefficients. Following each rolling estimation window, returnsare calculated for multiple subsequent months using the same estimated exposures. Specifically, we calculate the abnormal return𝐴𝐴𝐴𝐴 in each period 𝑡𝑡, 𝑡𝑡 1, 𝑡𝑡 2, as follows:𝐴𝐴𝑅𝑅𝑖𝑖,𝑡𝑡 𝑥𝑥 𝑅𝑅𝑖𝑖,𝑡𝑡 𝑥𝑥 𝛼𝛼 𝑖𝑖𝑖𝑖 𝛽𝛽̂𝑖𝑖𝑖𝑖 𝑀𝑀𝑀𝑀𝑇𝑇𝑡𝑡 𝑥𝑥 ,for 𝑥𝑥 0, 1, 2, where 𝛼𝛼 and 𝛽𝛽̂ are the estimated coefficients. The subscript 𝑡𝑡 𝑥𝑥 refers to the return from the start to the end of month 𝑡𝑡 𝑥𝑥,e.g., 𝐴𝐴𝑅𝑅𝑖𝑖𝑖𝑖 2 is the abnormal return of firm 𝑖𝑖 in the third month after the end of the estimation period.Cumulative abnormal returns (CAR) are obtained by adding up over multiple months, e.g. the three-month return from 𝑡𝑡 to 𝑡𝑡 2is𝐶𝐶𝐶𝐶𝐶𝐶𝑖𝑖,𝑡𝑡 2 𝐴𝐴𝑅𝑅𝑖𝑖𝑖𝑖 𝐴𝐴𝑅𝑅𝑖𝑖,𝑡𝑡 1 𝐴𝐴𝑅𝑅𝑖𝑖,𝑡𝑡 25The market return time series were obtained from Kenneth French’s website, which distinguishes between five regions: North America, Europe, Japan, APACex Japan, Emerging markets.MOODY’S ANALYTICSTHE BUSINESS IMPACT OF ESG PERFORMANCE6
Where, for a given CAR, only one set of estimated exposure parameters is used, namely the ones estimated using observationsuntil the month prior to the return period.We incorporate an adjustment to abnormal returns to ensure that they have an overall mean of zero in our sample. To achievethis, we subtract, at each return horizon, the overall mean CAR across the entire sample (or for size and sector groups), so that wehave 𝐶𝐶𝐶𝐶𝐶𝐶𝑖𝑖,𝑡𝑡 𝑥𝑥 𝐶𝐶𝐶𝐶𝑅𝑅𝑖𝑖,𝑡𝑡 𝑥𝑥 𝐶𝐶𝐶𝐶𝐶𝐶𝑡𝑡 𝑥𝑥In the following, we will always be working with 𝐶𝐶𝐶𝐶𝑅𝑅 , which, for convenience, we simply refer to as “abnormal returns.”4.2 Statistical TestsOur tests of statistical significance use standard errors around the average cumulative abnormal returns, where the average isalways taken over returns that follow a certain type of event (to be defined below). Specifically, we look at returns from thebeginning of the month in which an event occurs over a holding period of up to 12 months, and then calculate averages ofcumulative abnormal returns (ACAR). The standard error for a given ACAR is calculated as𝑆𝑆𝑆𝑆𝐴𝐴𝐴𝐴𝐴𝐴𝐴𝐴 𝑥𝑥 𝜎𝜎 𝑖𝑖2 ,𝑁𝑁 2𝑖𝑖where 𝑥𝑥 is the return horizon, 𝑁𝑁 is the number of firm-months 𝑖𝑖 in which events are observed, and 𝜎𝜎 𝑖𝑖2 is the estimated variance inthe rolling regression used for the cumulative return starting in firm-month 𝑖𝑖. Standard errors thus account for the estimatedvolatility of each firm contributing to the average. The t-statistic for the test of an ACAR is𝑡𝑡𝐴𝐴𝐴𝐴𝐴𝐴𝐴𝐴 where 𝐶𝐶𝐶𝐶𝑅𝑅 is the average adjusted CAR, as discussed above. ���𝐴𝐴𝐴𝐴𝐴4.3 Stock Return DataWe include in our empirical analysis all publicly listed firms that had a controversy since January 1, 2008. 6 We obtain monthlyinformation on firms’ equity returns, total assets, sector, and country of headquarters from Moody’s Analytics public firmdatabase, as well as region-matched stock index returns from Kenneth French’s website.All returns used in this study are log returns, and firm-level monthly raw equity returns are winsorized at log(2). The rollingtime-series regressions for the market model are estimated every month, generating a new set of intercepts and exposureswhenever sufficient data for a firm is available. With each set of estimated parameters, we calculate cumulative abnormal returnsover 1 to 12 months following the estimation period. We exclude observations in the 12 months after a default event. Our finaldataset contains all firm-month observations with available 12-month abnormal return starting in the period, which are 147,731observations for 3,486 firms spanning the period January 2015 to December 2019.4.4 Return StatisticsIn our event studies, we investigate both the short-run effect of ESG events (two-month return), as well as the long-run effect (12month return). Table 1 documents the overall return distributions for the two horizons. Both returns are constructed to have amean of zero across the entire sample (compare Section 4.1).6We are not taking into account firms that were in principle covered by Moody’s ESG Solutions but never had an incident. This is not an issue, because theabnormal returns methodology compares realized returns against a firm-specific expected return.MOODY’S ANALYTICSTHE BUSINESS IMPACT OF ESG PERFORMANCE7
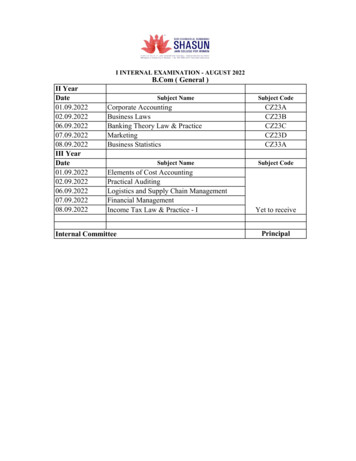
Table 1Statistics on full-sample average cumulative abnormal %0.38%3.95%0.00%Moments of 2-month abnormal returns0.00%0.02%0.05%Moments of 12-month abnormal returns0.01%0.07%0.14%Note: Based on the final sample of 147,731 observations January 2015 to December 2019.5. The Value Impact of Individual ControversiesIn this section, we study the business impact of ESG controversies directly by using monthly controversy counts by severity andresponsiveness as input to our event study methodology. In particular, our tests are independent of the previous ESG controversiesthat a firm may have experienced. We also define event counts for E, S, and G controversies separately, where a controversy isincluded if its topics include the respective one (so that a given controversy may be included for multiple topics).We focus on abnormal returns over a horizon of 2 months to measure the short-run impact of controversies, and of 12 months tomeasure the long-run, persistent impact. In both cases, the return period starts in the event month. We use two months for theshort-term impact to allow some time for details to emerge and for any stock market overreaction to fade.5.1 Short-Run EffectsWe find that ESG events lead to significantly negative returns in the short-run (Table 2 and Figure 2). If an ESG event of any kindoccurs, firms, on average, experience a statistically significant abnormal return of 0.37% over two months. During our sampleperiod, this happens in 7,670 firm-months. The effect is generally greater the more events occur, at 0.73% for two or more, and 1.40% for four or more controversies.Table 2Panel ctedEEE (selected)GGGG (selected)G (selected)G (selected)SSSSS (selected)S (selected)S (selected)S (selected)Average 2-month abnormal nel llAllSelectedSelectedSelectedSelectedEEEE (selected)E (selected)E (selected)GGGGG (selected)G (selected)G (selected)G (selected)SSSSS (selected)S (selected)S (selected)S 99-2.78-1.03-0.46Note: Panel A refers to events with any severity and responsiveness. Panel B requires at least one event (with any responsiveness) in a month.Looking at E, S, and G events separately we observe differences. Even though always negative, average abnormal returns for E andG are quite small and not statistically significant. In contrast, the effect of S controversies is large and statistically significant. Firmsthat experience three or more S events in a month have an average abnormal return of 2.11%.MOODY’S ANALYTICSTHE BUSINESS IMPACT OF ESG PERFORMANCE8
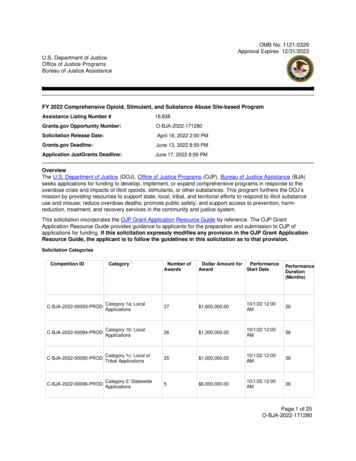
Figure 2 also shows results using selected controversies (see Section 3.2). In most cases, the negative average abnormal returns arearound 40% larger when only considering selected controversies. E.g., the effect of having at least one selected controversy in amonth is 0.62%.We also investigate the role of controversy characteristics. While effects are largely independent of responsiveness (unreported), ahigher severity is associated with lower returns. E.g., having an event of the highest severity on average leads to an abnormalreturn of 1.39%. The effect is most pronounced for S controversies, where having an event of the highest severity (4 critical)leads to an average 2-month loss of 6.36%.Figure 2Average 2-month abnormal returns.Panel A.Panel B.Note: We require a minimum of 20 firm-month observations in each group (thus missing bars).5.2 Long-Run EffectsStock markets often quickly react to news. As more time passes, more information is revealed, and assessment of the impact of acontroversy is updated. Even if in the short-run a given stock suffers a negative impact, there may be no difference in the long-run,because effects fade or are small relative to other value-relevant factors. In order to test whether ESG controversies have anegative effect on stocks beyond the short-run reaction, we investigate abnormal returns over a period of one year (Table 3 andFigure 3).We find persistent negative valuation effects, when multiple ESG controversies occur. If three or more controversies occur in amonth, firms on average have an abnormal return of 1.18% over one year. For five or more controversies, losses are 6.47%.Large losses are observed for G and S events. Controversies selected for their expected strong financial impact (see Section 3.2)indeed lead to more negative abnormal returns.MOODY’S ANALYTICSTHE BUSINESS IMPACT OF ESG PERFORMANCE9
In contrast to the short-run, results over a one-year horizon do not show worse abnormal returns for higher severity (Panel B inFigure 3). A possible explanation for this finding is that firms that experience a controversy of the highest severity often have ahistory of previous ESG controversies, which may be muting the stock return impact. In our sample, when a firm experiences acritical (highest severity) controversy, the median number of previous controversies it has had is more than double compared tothe case when a controversy with lower severity occurs. Furthermore, firms in our sample that ever experience a controversy withseverity “high” or “critical” have more than five times as many controversies per period overall (0.11), compared with all otherfirms (0.02). In order to account for these factors, we study the valuation effects of ESG controversies considering firms’ ESGhistory in Section 7.Table 3Average 12-month abnormal returns.Panel A.Panel ctedSelected4SelectedE1EE2EE3E (selected)E (selected)1GE (selected)2GE (selected)3GG1G (selected)G2G (selected)G3G (selected)G4SG (selected)1SG (selected)2SG (selected)3SG (selected)4S (selected)S1S (selected)S2S (selected)S3S (selected)S4S (sel
MOODY'S ANALYTICS THE BUSINESS IMPACT OF ESG PERFORMANCE 1 The Business Impact of ESG Performance . Abstract . Considerations around the Environmental, Social, and Governance (ESG) aspects of companies have become a factor widely taken into account by investors and other market participants, consumers, and stakeholders.