Transcription
An Automated Trading Strategy using Corporate Reputation Indices Developedby Seldonix and Social Market AnalyticsBy: The Deltix Quantitative Research TeamCorporate Reputation DataThe Corporate Reputation Index (CRI), developed by Seldonix and distributed in partnership with SocialMarket Analytics, allows traders to identify and compare over- and under-priced stocks that are affectedby a company’s actions. Corporate Reputation is the controllable portion of a company’s stock price,considered to be an intrinsic driver of company performance, and a major contributor to daily stockprice fluctuation.The Corporate Reputation Index is the first daily business metric for monitoring corporate reputation.Centered on “0”, companies with negative values are deemed undervalued relative to market whilethose with positive values are overvalued.The CRI is created after the close of markets and is currently available before markets open the next dayat any time after 9:00 PM Eastern US Time the night before.Each data record features a set of fields:-The timestamp associated with each field is the market close date of the data used;Symbol;CRI.An example of the data is shown below:Page:1
Basis of Research using Seldonix dataThe purpose of the research described in this paper is to determine if there are opportunities togenerate alpha in US equities traded on the NYSE and NASDAQ using Seldonix data as a basis for dailymarket movement prediction (the holding period is about 6.5 hours).We show how with the use of simple technical indicators and the popular conception of basket trading,we can exploit the CRI to generate excess returns. An evaluation of the CRI was conducted in theforecasting of stock price. The results of the testing showed a 1 – 8 day lag in the prediction of stockprice, depending on the stock. Therefore our purpose is to determine the most appropriate time whenthe CRI generates the most suitable values for opening a position. As the CRI values change every dayand are different for each ticker, we need to construct an approach which will successfully encompassboth equally important collations. To identify these situations, we need to:-Compare short-term values to long-term;Compare values within the considered universe of tickers.Keltner indicatorFor the first comparison we chose Keltner channels. The Keltner indicator attempts to locate the mostimportant trends. The indicator is based on principles similar to those used in Envelope and Bollingerindicators. The upper band is calculated as the moving average plus the average true range, for Nperiods. The lower band is the moving average minus the average true range. (,);Page:2
((,,););As a rule, the upper band detects that movement will most probably be directed downward. The lowerband means that movement will most probably be directed upward.The Keltner indicator, similar to Bollinger, is designed to gauge volatility. Nevertheless it was chosenover Bollinger since Keltner channels use an average true range rather than standard deviation andgenerally will be more sensitive to changes of the CRI values. Thus we construct the following measure,f, which is similar to Bollinger %b: % which tells you where you are in relation to the bands: where CR is the latest value of the CRI.Since we need the comparison between long and short term periods, we suggest using two Keltnerindicators with periods 64 days and 2 days respectively. Therefore we consider two values: f64 and f2. Page:3
Over/under pricedOur purpose is to design a criterion which will provide sufficient predictive power for instrument pricechange and will identify which instruments in the particular universe are most likely to generate excessreturns.Since the expected return of the asset at time is, according to the CapitalAsset Pricing Model (CAPM), if an asset is currently overpriced, at timethe asset returns to theCAPM suggested price, we can expect a positive return for underpriced and negative return foroverpriced.Therefore we propose the following hypothesis:1) If an instrument is overpriced in the long term and underpriced in the short term it is most likelyto be subject to positive day return.2) If an instrument is underpriced in the long term and overpriced in the short term it is most likelyto be subject to negative day return.We can call this concept a reversal from overpriced to underpriced and vice versa. The values f and fare designed to measure long and short term CRI dynamics and therefore will be used as indicators.BasketsTo implement the estimate of CRI within a particular universe of tickers, we apply sorting into basketsaccording to the above criterion:1) Basket 1: If an instrument's f is in the q percent of most overpriced instruments andinstrument's f is in the q percent of most underpriced, then it is most likely to be subject topositive day return.2) Basket 2: If an instrument's f is in the q percent of most underpriced instruments andinstrument's f is in the q percent of most overpriced, then it is most likely to be subject tonegative day return.Page:4
Trading SignalsTo implement this hypothesis as an automated trading strategy we need to:1) Receive the CRI before the day open;2) Recalculate Keltner channels;3) Calculate f and f for each instrument: 4) Sort instruments into baskets using the described criterion with q 20%;5) Open long position for Basket 1 and short position for Basket 2;6) Close position on day close.Page:5
ResultsThis approach gives the following results for S&P 100 tested on the period from 1/5/2010 to 8/18/2014:ParameterNet Profit/LossTotal ProfitTotal LossCumulated Profit %All Trades21,182.82113,708.71-92,525.8921.18 %Long Trades13,984.9759,129.80-45,144.8313.98 %Short Trades7,197.8554,578.91-47,381.067.20 %Max DrawdownMax Drawdown %Max Drawdown DateReturn/Drawdown RatioDrawdown Days %Max Drawdown Duration-2,590.71-2.41 %9/2/20118.1880.96 %119-2,774.62-2.66 %9/30/20115.0480.36 %198-2,265.55-2.18 %9/15/20113.1888.29 %188CAGRSharpe RatioAnnualized VolatilitySortino RatioUPIInformation Ratio4.40 %1.732.542.860.391.712.97 %1.372.162.150.271.371.57 %0.732.151.130.130.72Page:6
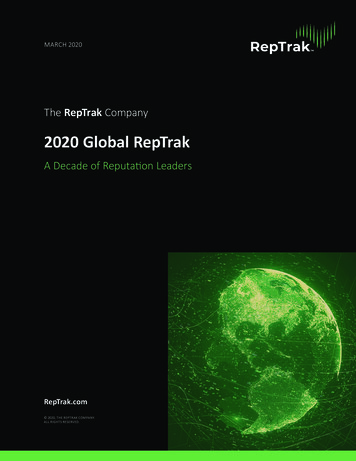
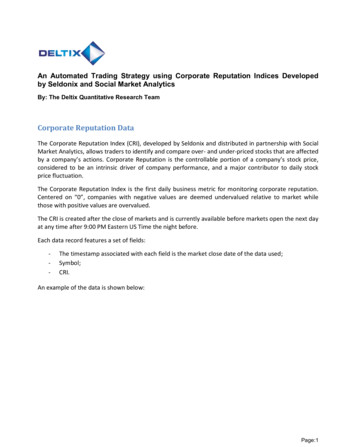
Optimal f68.3263.5133.96All Trades #Profitable Trades RatioWinning Trades #Losing Trades ge TradeAverage Winning TradeAverage Losing TradeAvg. Win/ Avg. Loss RatioAverage Profit per 056.3091.73-86.621.060.03111099Max Consequent Winners 9Max Consequent Losers10Rules for closingThe other idea is to exploit the CR trend not only for opening but for closing position. On the figurebelow you can see the example of position on AAPL chart, blue line on second pad indicates CRI values:Page:7
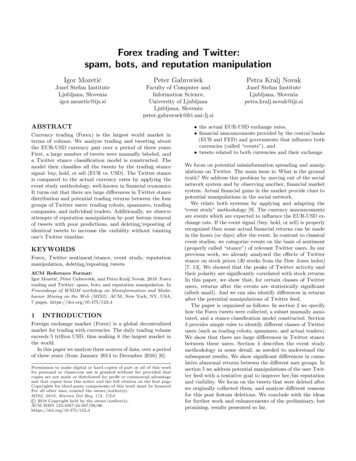
We use the Simple Moving Average (SMA) of the last CRI values (red line on the second pad) todetermine whether the instrument gets over or underpriced. Using the model from the paragraphOver/Under Priced, we will close the position for the instrument according to following rule:1) If CR SMA (5, CR) (instrument is overpriced at time t, price is likely to return to suggested priceat t 1) close Short position on day close;2) If CR SMA (5, CR) (instrument is underpriced at time t, price is likely to return to suggestedprice at t 1) close Long position on day close.The same chart with this rule shows better results:This approach gives the following results for S&P100 tested on the period from 1/5/2010 to 8/18/2014:Page:8
ParameterNet Profit/LossTotal ProfitTotal LossCumulated Profit %All Trades32,118.49143,984.75-111,866.2632.12 %Long Trades18,265.4171,784.79-53,519.3818.27 %Short Trades13,853.0872,199.96-58,346.8813.85 %Max DrawdownMax Drawdown %Max Drawdown DateReturn/Drawdown RatioDrawdown Days %Max Drawdown Duration-3,526.80-3.08 %9/2/20119.1180.45 %95-4,508.75-4.22 %9/30/20114.0581.83 %194-3,368.95-3.07 %9/15/20114.1188.63 %279CAGRSharpe RatioAnnualized VolatilitySortino RatioUPIInformation RatioOptimal f6.44 %1.973.273.400.581.9060.053.83 %1.312.932.060.261.3144.632.95 %0.943.141.550.190.9129.93All Trades #219011031087Page:9
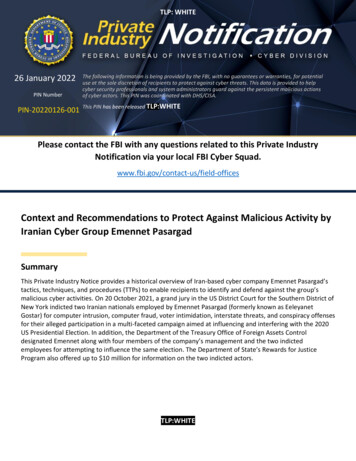
Profitable Trades RatioWinning Trades #Losing Trades #0.53115810320.556035000.51555532Average TradeAverage Winning TradeAverage Losing TradeAvg. Win/ Avg. Loss RatioAverage Profit per .110.0712.74130.09-109.671.190.051691615Max Consequent Winners 13Max Consequent Losers11Filter for stronger signalOne more idea is to filter a stronger signal when CR retains its sign from the previous day, which is astronger signal indicating overpriced/ underpriced asset. On the chart below you can see two trades onMSFT asset, the second one is unprofitable, when the CR line changes its value from -1 to 1:Filtering out such unstable situations gets the following results for the S&P 100 tested in the period from1/5/2010 to 8/18/2014:Page:10
ParameterNet Profit/LossTotal ProfitTotal LossCumulated Profit %All Trades32,810.12126,322.99-93,512.8732.81 %Long Trades19,145.4564,003.72-44,858.2619.15 %Short Trades13,664.6762,319.27-48,654.6113.66 %Max DrawdownMax Drawdown %Max Drawdown DateReturn/Drawdown RatioDrawdown Days %Max Drawdown Duration-2,617.49-2.37 %9/2/201112.5378.38 %89-4,409.37-4.18 %9/30/20114.3480.02 %194-2,465.16-2.29 %9/15/20115.5486.74 %176CAGRSharpe RatioAnnualized VolatilitySortino RatioUPIInformation RatioOptimal f6.56 %2.163.043.820.672.1170.804.00 %1.492.682.450.261.5055.512.91 %1.032.841.700.241.0136.20All Trades #Profitable Trades RatioWinning Trades #18390.539729370.555129020.51460Page:11
Losing Trades #867425442Average TradeAverage Winning TradeAverage Losing TradeAvg. Win/ Avg. Loss RatioAverage Profit per .180.0815.15135.48-110.081.230.0612101116Max Consequent Winners 12Max Consequent Losers11ConclusionWe presented an approach that uses CR indices as a strong predictive factor of price directionality. Wedeveloped a trading strategy that implements an algorithm based on this approach. We also constructedtwo other versions, both based on CRI predictive power, that raise the performance of the mainapproach.The main contribution of the paper is back-testing and comparison of the different versions of thestrategy. On stocks in the S&P 100, back-testing shows that the first strategy has an average InformationRatio of 1.71 over the period 2010-2014, the second and third versions achieved Information Ratios of1.90 and 2.11 respectively, which indicates that the CRI is predictive in the forecasting of stock returns.Page:12
The Corporate Reputation Index (CRI), developed by Seldonix and distributed in partnership with Social Market Analytics, allows traders to identify and compare over- and under-priced stocks that are affected by a company ˇs actions.Corporate Reputation is the controllable portion of a company ˇs stock price,