Transcription
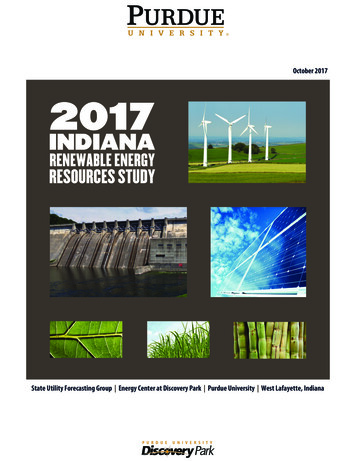
October 2017State Utility Forecasting Group Energy Center at Discovery Park Purdue University West Lafayette, Indiana
2017 INDIANA RENEWABLE ENERGYRESOURCES STUDYState Utility Forecasting GroupEnergy CenterPurdue UniversityWest Lafayette, IndianaDavid NderituDouglas GothamLiwei LuDarla MizeTim PhillipsPaul PreckelMarco VelasteguiFang WuOctober 2017
Table of ContentsList of Figures . iiiList of Tables . vAcronyms and Abbreviations . viiForeword . . .xi1.Overview . 11.11.21.31.42.Energy from Wind . 132.12.22.32.42.52.63.Introduction . 13Economics of wind energy . 15State of wind energy nationally . 20Wind energy in Indiana. 26Incentives for wind energy . 32References . 34Dedicated Energy Crops . 373.13.23.33.43.53.64.Trends in renewable energy consumption in the United States . 1Trends in renewable energy consumption in Indiana . 4Cost of renewable resources . 10References . 12Introduction . 37Economics of energy crops . 42State of energy crops nationally. 46Energy crops in Indiana . 48Incentives for energy crops . 51References . 52Organic Waste Biomass . 554.14.24.34.4Introduction . 55Economics of organic waste biomass . 57State of organic waste biomass nationally . 61Organic waste biomass in Indiana . 67i2017 Indiana Renewable Energy Resources Study - State Utility Forecasting Group
4.54.65.Incentives for organic waste biomass . 74References . 76Solar Energy . 795.15.25.35.45.55.66.Introduction . 79Economics of solar technologies . 82State of solar energy nationally . 86Solar Energy in Indiana . 88Incentives for solar energy . 90References . 92Photovoltaic Cells . 936.16.26.36.46.56.67.Introduction . 93Economics of PV systems. 96State of PV systems nationally . 100PV systems in Indiana. 104Incentives for PV systems. 108References . 110Hydropower . 1137.17.27.37.47.57.6Introduction . 113Economics of hydropower . 114State of hydropower nationally . 117Hydropower in Indiana . 122Incentives for hydropower . 124References . 125ii2017 Indiana Renewable Energy Resources Study - State Utility Forecasting Group
List of Figures1-11-21-31-41-51-61-71-81-9Renewable energy consumption in the U.S. (1949-2016) . 2U.S. energy consumption by source (1949-2016) . 2U.S. total energy consumption by energy source in 2016 . 3Net U.S. electricity generation by energy source in 2016 . 4Renewables share of Indiana total energy consumption (1960-2014) . 5Renewables share of Indiana electricity generation (1990-2015) . 6Wind energy capacity in Indiana . 7Estimated generating technologies capital cost . 10Estimated generating technologies fixed and variable O&M cost . orizontal wind turbine configuration . 13Estimated capital costs of various electric generation options . 16Installed wind power project costs over time . 17Generating technologies O&M cost . 18Average O&M costs for available data years . 19Average wind and wholesale electricity prices . 20U.S. wind capacity growth . 21Renewable portfolio standards across the U.S . 22Wind power capacity by state at the end of June 2017 (MW) . 23U.S. wind share of electricity generation in 2016 . 2480-meter U.S. wind resource map. 25Wind energy capacity in Indiana . 26Indiana wind speed at 100 meters height . 30Indiana wind speed at 50 meters height . 313-13-23-3Energy crops included in the 2016 Billion-Ton Report . 39Production of energy crops at various farm-gate prices for select years . 42Supply curves of potential herbaceous energy crop production for selectyears under base-case assumptions . 43Supply curves of potential woody energy crop production for select yearsunder base-case assumptions . 44Bioenergy crop trial stations . 47Estimated shares of energy crops and agricultural residues suppliedat 60 per dry ton in 2030 . 48Projected production of energy crops in Indiana in 2030 . 493-43-53-63-7iii2017 Indiana Renewable Energy Resources Study - State Utility Forecasting Group
4-14-24-34-44-54-6Supply curves of potential production from primary crop residuesfor select years under 2016 Billion-ton study base-case assumptions . 59U.S. corn stover supply curve . 61U.S. renewable energy consumption (1949-2016) . 62Landfill gas projects . 64Renewables share of Indiana total energy consumption (1960-2014) . 67Estimated biomass production potential in Indiana . 725-15-25-35-45-55-65-75-85-95-10Cross-section layout of a flat-plate collector . 79A parabolic trough CSP system . 80A linear Fresnel CSP system . 81A power tower CSP system . 81A dish/engine CSP system . 82Estimated capital cost of generating technologies . 84Operating and maintenance cost of generating technologies . 85Concentrating solar power resource in the U.S. . 86Solar thermal power capacity installed in the U.S. . 87Direct normal solar radiation (flat-plate collector) in Indiana . aic cell operation . 93Illustration of a cell, module and array of a PV system . 94Illustration of concentrating photovoltaic cell . 95Performance and price of different PV technologies . 96Installed price ( /W DC ) trends for residential and commercial PV systems. 97Installed price of utility-scale PV systems over time . 98Average cost of PV systems of at least 1 MW installed in the U.S. in 2013 . 98Estimated capital cost of generating technologies . 99Estimated fixed and variable O&M cost of generating technologies . 100Grid-connected U.S. PV installed 2000 to 2016 . 101Renewable portfolio standards with solar carve-outs . 102Indiana annual installed PV capacity . 1057-17-27-37-47-57-6Schematic of impoundment hydropower facility. 114U.S. hydropower construction cost by project type and size . 115Variable and fixed O&M costs of generating technologies . 117Net renewable electricity generation in the U.S. (1949-2016) . 118Non-powered dams with potential capacity over 1 MW . 120Renewables share of Indiana net electricity generation (1990-2014). 122iv2017 Indiana Renewable Energy Resources Study - State Utility Forecasting Group
List of Tables1-11-21-3Total installed Indiana PV capacity . 8Renewable generation capacity contracted under net metering. 9Renewable generation capacity contracted under feed-in tariffs . 92-12-22-32-4Wind resource classification . 14Utility scale wind farms in Indiana . 27Community wind projects in Indiana. 28Wind energy purchase agreements by Indiana utilities . 293-13-23-33-4DOE funded integrated biorefinery projects . 41Ethanol plants in Indiana . 45Average cost ( /ton) for producing switchgrass in Indiana . 49Cost by category for producing corn stover,switchgrass, and miscanthus in Wildcat Creek Watershed. 504-14-9Summary of secondary agricultural wastes potential at selectedprices and years under 2016 Billion-ton study base-case assumptions . 60Location of the 77 solid waste to energy plants in the U.S. 63Top ten states for potential electricity generation from swine and dairy farms . 65Wastewater treatment combined heat and power systems in the U.S. . 66Electricity generating plants in Indiana landfills . 68Potential electricity generating capacity in Indiana landfills . 69Operational anaerobic digesters in Indiana . 70Potential electricity generating capacity in Indianaconcentrated animal feeding operations. 71Potential electricity generating capacity in Indiana wastewater treatment plants . 725-15-2Estimated capital cost of CSP plants in the U.S. . 83Operating concentrating solar power plants in the U.S. . 886-16-26-36-4PV systems with capacity of 50 MW and above installed in the U.S. 103Total installed Indiana PV capacity . 104PV systems in Indiana with capacity 1.5 MW and above . 106Purchase rates under NIPSCO renewable feed-in tariff . 1077-1Initial capital costs of hydropower projects . 1164-24-34-44-54-64-74-8v2017 Indiana Renewable Energy Resources Study - State Utility Forecasting Group
7-27-37-47-57-6Ten largest hydropower plants in the U.S. 118Top ten U.S. hydropower generating states in 2015 (MWh) . 119Top ten U.S. hydropower capacity states at end of 2015 (MW). 119Hydropower potential from non-powered dams by state. 121Indiana non-powered dams with potential capacity over 1 MW . 123vi2017 Indiana Renewable Energy Resources Study - State Utility Forecasting Group
Acronyms and AbbreviationsACAlternating currentARRAAmerican recovery and reinvestment actAMPAmerican Municipal PowerAWEAAmerican Wind Energy AssociationBtuBritish thermal unitCAFOconcentrated animal feeding operationsCECCalifornia Energy CommissionCHPcombined heat and power plantCO 2Carbon dioxideCPVConcentrating photovoltaicCREBClean renewable energy bondsCSPConcentrating solar powerDCDirect currentDOEU.S. Department of EnergyDSIREDatabase of state incentives for renewables and efficiencyEEREOffice of Energy Efficiency and Renewable Energy, U.S.Department of EnergyEIAEnergy Information Administration, U.S. Department of EnergyEPAU.S. Environmental Protection AgencyftFeetft3Cubic feetGISGeographical information systemGWGigawattGWhGigawatthourIEAInternational Energy AgencyIMPAIndiana Municipal Power AgencyINLIdaho National Laboratory, U.S. Department of Energyvii2017 Indiana Renewable Energy Resources Study - State Utility Forecasting Group
IPLIndianapolis Power and Light CompanyIRECInterstate Renewable Energy CouncilITCBusiness energy investment tax creditIURCIndiana Utility Regulatory CommissionI&MIndiana Michigan PowerKDFBioenergy Knowledge Discovery Framework, U.S. Department ofEnergykWKilowattkWhKilowatthourLLCLimited liability companyLBNLLawrence Berkeley National Laboratory, U.S. Department ofEnergyLMOPLandfill Methane Outreach Program, Energy InformationAdministration, U.S. Department of Energym/sMeters per secondMACRSModified accelerated cost-recovery systemMGDMillion gallons per dayMGYMillion gallons per yearmmBtuMillion British thermal unitmmscfdMillion standard cubic feet per dayMMTCO2e/yrmillion metric ton of carbon dioxide-equivalent permphMiles per hourMSWMunicipal solid wasteMTBEMethyl tertiary butyl ether – a gasoline oxygenating additiveMWMegawattMWhMegawatthourNAABBNational Alliance for Advanced Biofuels and BioproductsNIPSCONorthern Indiana Public Service CompanyNO xNitrogen oxideNRELNational Renewable Energy Laboratory, U.S. Department of Energyviii2017 Indiana Renewable Energy Resources Study - State Utility Forecasting Group
O&MOperation and maintenanceOEDIndiana Office of Energy DevelopmentORNLOak Ridge National Laboratory, U.S. Department of EnergyPOLYSYSPolicy analysis systemPPAPower purchase agreementsPTCProduction tax creditPVPhotovoltaicQECBQualified energy conservation bondsREAPRural Energy for America Program, U.S. Department of AgricultureRPSRenewable portfolio standardSEDSState Energy Data System, Energy Information Administration,U.S. Department of EnergySEGSSolar Electric Generation SystemSEIASolar Energy Industries AssociationSOxSulfur oxidesSUFGState Utility Forecasting GroupUSDAU.S. Department of AgricultureVEETCVolumetric ethanol tax creditWWattsW DCDirect Current WattsW/m2Watts per square meterWPCPWater pollution control plantWVPAWabash Valley Power AssociationWWTPwastewater treatment plantyryearix2017 Indiana Renewable Energy Resources Study - State Utility Forecasting Group
x2017 Indiana Renewable Energy Resources Study - State Utility Forecasting Group
ForewordThis report represents the fifteenth annual study of renewable resources in Indiana performedby the State Utility Forecasting Group. It was prepared to fulfill SUFG’s obligation underIndiana Code 8-1-8.8 (added in 2002) to “conduct an annual study on the use, availability, andeconomics of using renewable energy resources in Indiana.” The code was further amendedin 2011, clarifying the topics to be covered in the report.The report consists of seven sections. Section one provides an overview of the renewableenergy industry in the United States and in Indiana. It includes a discussion of trends inpenetration of renewable energy into the energy supply, both nationally and in Indiana. Theother six sections are each devoted to a specific renewable resource: energy from wind,dedicated crops grown for energy production, organic biomass waste, solar energy,photovoltaic cells, and hydropower. They are arranged to maintain the format in the previousreports as follows: Introduction: This section gives an overview of the technology and briefly explainshow the technology works.Economics of the renewable resource technology: This section covers the capital andoperating costs of the technology.State of the renewable resource technology nationally: This section reviews thegeneral level of usage of the technology throughout the country and the potential forincreased usage.Renewable resource technology in Indiana: This section examines the existing andpotential future usage for the technology in Indiana in terms of economics andavailability of the resource.Incentives for the renewable resource technology: This section contains incentivescurrently in place to promote the development of the renewable resource.References: This section contains references that can be used for a more detailedexamination of the particular renewable resource.This report was prepared by the State Utility Forecasting Group. The informationcontained in it should not be construed as advocating or reflecting any other organization’sviews or policy position. For further information, contact SUFG at:State Utility Forecasting Group203 South Martin Jischke DriveMann Hall, Suite 160West Lafayette, IN 47907-1971Phone: 765-494-4223e-mail: park/SUFG/xi2017 Indiana Renewable Energy Resources Study - State Utility Forecasting Group
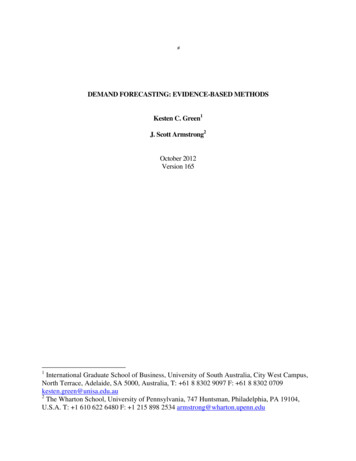
1. OverviewThis first section of the 2017 Indiana Renewable Energy Resources Report presents an overview ofthe trends in renewable energy penetration in the U.S. and in Indiana.1.1Trends in renewable energy consumption in the United StatesFigure 1-1 shows the amount of renewable energy in quadrillion British thermal units (Btu)consumed in the U.S. from 1949 to 2016. Until the early 2000s hydroelectricity and woodybiomass were the dominant sources of renewable energy consumed in the U.S. The last sixteenyears have seen a rapid increase in biofuels (mainly corn-based ethanol), wind and solar as sourcesof renewable energy. In 2016 biofuels, wind and solar combined contributed 49 percent of the 10quadrillion Btu of renewable energy consumed in the U.S. The rapid increase in corn-ethanol hasbeen driven by two factors: it serves as a replacement of the oxygenating additive MTBE ingasoline, which started being phased out in 2000, and the Federal Renewable Fuel Standard, firstauthorized in the 2005 Energy Policy Act and then expanded in 2007, which created mandates forthe production of biofuels. This rapid increase in corn-ethanol has since slowed and even turnedinto a decline in 2012 in line with declining U.S. gasoline demand. The rapid increase in windenergy started with the introduction of the Federal Production Tax Credit (PTC) in 1992, andcontinued with the proliferation of renewable portfolio standards (RPS) in a number of states. Therapid expansion in solar capacity installations is attributed to a combination of state RPS, financialincentives offered by the federal government as part of the 2008/2009 economic recoverypackages and the declining cost of installing photovoltaic systems. These federal incentivesinclude the modification of the 30 percent Investment Tax Credit (ITC) to remove the 2,000 capand to allow utilities access to the ITC, the provision for investors to take a 30 percent cash grantin lieu of the ITC and PTC, and the provision of extra funds for the U.S. Department of Energy(DOE) loan guarantee program. This cash grant provision and the special DOE loan guaranteeprogram provided under Section 1705 of the Energy Policy Act were retired in 2011. However,the production tax credit and the investment tax credit are still in place having been extended mostrecently to 2019 by the Consolidated Appropriations Act of 2016.12017 Indiana Renewable Energy Resources Study - State Utility Forecasting Group
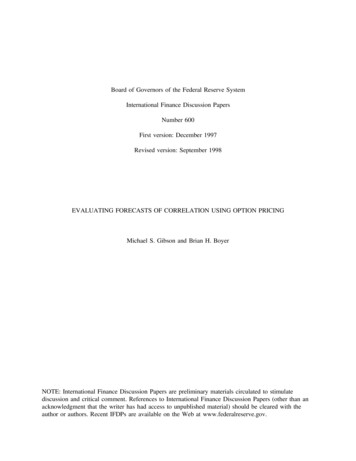
Figure 1-1: Renewable energy consumption in the U.S. (1949-2016) (Data source: EIA [1])Despite the growth shown in Figure 1-1, renewable energy’s share of the total energy consumed inthe U.S. remains modest at approximately 10 percent. In 2016 fossil fuels supplied 81 percent ofthe energy consumed in the U.S.; renewable resources supplied 10 percent while nuclear energysupplied 9 percent. Figure 1-2 shows the sources of total energy consumed in the U.S. from 1949to 2016.Figure 1-2: U.S. energy consumption by source (1949-2016) (Data source: EIA [2])22017 Indiana Renewable Energy Resources Study - State Utility Forecasting Group
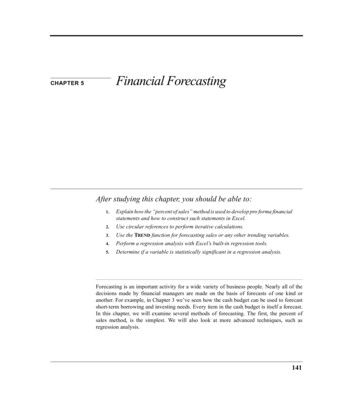
Figure 1-3 shows the contribution of the various energy sources to total energy consumed in theU.S. in 2016. Petroleum continued to be the dominant energy source supplying 37 percent,followed by natural gas at 29 percent and coal at 15 percent. Among the renewable resources,biomass (including wood, biofuels, municipal solid waste, landfill gas and others) comprised 47percent of the total renewable energy, followed by hydroelectricity at 24 percent. Wind power’scontribution rose to 21 percent from 19 percent in 2015, solar and geothermal remained at 6percent and 2 percent respectively.When one considers renewable resources in electricity generation (Figure 1-4), hydroelectricityand wind played dominant roles in 2016 together contributing 82 percent of the total renewableelectricity generated (44 percent from hydro and 38 percent from wind). Woody biomasscontributed 7 percent, solar 6 percent, waste biomass 4 percent, and geothermal 3 percent. Asexpected, pumped hydroelectricity’s net energy contribution was negative. 1Figure 1-3: U.S. total energy consumption by energy source in 2016 (Data source: EIA [1, 3])1Pumped hydroelectric facilities use electricity from the grid during periods of low demand and price to pump waterfrom a lower reservoir to a higher one. That water is then available to generate electricity during high demand andprice periods. Due to evaporation and inefficiencies in the pumping and generating processes, less energy is generatedthan is used. However, the value of the lost energy is more than compensated because low cost, off-peak electricity isconverted to high cost, on-peak electricity.32017 Indiana Renewable Energy Resources Study - State Utility Forecasting Group
Figure 1-4: Net U.S. electricity generation by energy source in 2016 (Data source: EIA [4])1.2Trends in renewable energy consumption in IndianaFigure 1-5 shows renewable energy consumption in Indiana from 1960 to 2014. In the 1980s,renewable resources contributed over 3 percent of total energy consumed in Indiana. In the 1990sthe share fell to below 2 percent, until the recent expansions in ethanol and wind increasedrenewable resources to over 5 percent. Before the entry of ethanol and wind in the 2000s, woodybiomass had been the main source of renewable energy in Indiana, comprising over 80 percent ofthe total renewable energy. This has since changed with biofuels becoming the dominant source ofrenewable energy, supplying over half of the renewable energy consumed in Indiana in 2014.Wind and woody biomass each supplied approximately 21 percent.42017 Indiana Renewable Energy Resources Study - State Utility Forecasting Group
Figure 1-5: Renewables share of Indiana total energy consumption (1960-2014) (Data source: EIA[5])Figure 1-6 shows the contribution of renewable energy to Indiana’s electricity generation from1990 to 2015. The arrival of utility-scale wind energy projects in 2008 caused a rapid increase inrenewable energy’s share of Indiana’s electricity generation. The renewables share of annualelectricity generation rose from 0.5 percent in 2007 to 5.3 percent in 2015 most of which (82percent) was from wind. The share of hydroelectricity, which until 2007 was the primary sourceof renewable electricity, dropped to 0.4 percent of Indiana’s 2015 generation. Solar photovoltaicgeneration has grown from virtually none in 2011 to 156 GWh in 2015 which was approximately0.2 percent of Indiana’s total generation.52017 Indiana Renewable Energy Resources Study - State Utility Forecasting Group
Figure 1-6: Renewables share of Indiana electricity generation (1990-2015) (Data source: EIA[6])As can be seen in Figure 1-7 there was a rapid growth in installed wind capacity in Indi
State Utility Forecasting Group Energy Center at Discovery Park Purdue University West Lafayette, Indiana October 2017. 2017 INDIANA RENEWABLE ENERGY RESOURCES STUDY . SEDS State Energy Data System, Energy Information Administration, U.S. Department of Energy