Transcription
Int. J. Med. Sci. 2017, Vol. 14961IvyspringInternational Journal of Medical SciencesInternational Publisher2017; 14(10): 961-969. doi: 10.7150/ijms.20121Research PaperGenotoxicity of a Low-Dose Nitrosamine Mixture asDrinking Water Disinfection Byproducts in NIH3T3CellsHai-yan Wang1, Ming Qin2, Lei Dong1, Jia-ying Lv3, Xia Wang1 1.2.3.Key Laboratory of Public Health Safety, Ministry of Education, Department of Environmental Health, School of Public Health, Fudan University, 130Dongan Road Shanghai, 200032, China;Department of Pharmacology, School of Pharmacy, Fudan University, 826 Zhangheng Road, Shanghai, 201203, China;Department of Biostatistics, School of Public Health, Fudan University, Shanghai, 200032, China. Corresponding author: Xia Wang, Key Laboratory of Public Health Safety, Ministry of Education, Department of Environmental Health, School of PublicHealth, Fudan University. Shanghai, 200032, China. Tel: 86-13916251491 E-mail: xwang6@fudan.edu.cn Ivyspring International Publisher. This is an open access article distributed under the terms of the Creative Commons Attribution (CC BY-NC) /4.0/). See http://ivyspring.com/terms for full terms and conditions.Received: 2017.03.17; Accepted: 2017.06.17; Published: 2017.08.18AbstractN-nitrosamines (NAms), which can arise as byproducts of disinfection agents, are reportedly foundin drinking water, and their potential carcinogenicity is a concern; however, little research existsregarding the genotoxicity or carcinogenicity of NAms exposure as a low-dose mixture. The threemost common NAms components in China’s drinking water are N-nitrosodimethylamine(NDMA), N-nitrosodiethylamine (NDEA) and N-nitrosomethylethylamine (NMEA). Thus, wemeasured the genotoxic and carcinogenic potential of these compounds and measured the cellcycle and gene expression. The data show that exposure to the NAms-mixture doubled therevertants in the TA98 and TA100 S. typhimurium strains and increased the DNA double-strandbreaks and the micronuclear frequency in the NIH3T3 cells compared to a single exposure. Afterlong-term NAms mixture exposure, a malignant transformation of NIH3T3 and a significantlyincreased G2/M distribution were observed. Furthermore, P53, CDK1, P38, CDC25A and CyclinBexpressions were down-regulated in the NAms-mixture exposure group; however, P21 andGADD45A genes were up-regulated. Interestingly, the CHK1/CHK2 and CDC25A genes had tworesponses, depending on the NAms concentrations. Thus, we observed mutagenic, genotoxic andcarcinogenic effects after a low-dose NAms-mixture exposure in drinking water, and DNA repairand apoptosis pathways may contribute to these adverse effects.Key words: Nitrosamines;transformation; DNA s)aredisinfectionbyproducts (DBPs) [1, 2] found in drinking water, andtheir potential carcinogenicity is a concern [3]. NineNAms compounds have been identified, as well cations and risks, and these data appear inSupplemental Table S1 and Figure S1 [4, 5]. TheInternational Agency for Research on Cancer (IARC)has classified eight NAms compounds as potential(Group 2A) or possible carcinogens (Group 2B) tohumans [6]. The US Environmental Protection Agency(EPA), the Agency for Toxic Substances and DiseaseRegistry and the Department of Human HealthServices also suggest that this group of NAms may beconsidered a human carcinogen that is hazardous inlow concentrations. In addition, some developedcountries have exposure limits for NAms. OntarioCanada has set a drinking water standard forN-nitrosodimethylamine (NDMA) of 9 ppt [7]. TheCalifornia Department of Health Services has setnotification levels for NDMA, N-nitrosodiethylamine(NDEA) and N-nitrosodipropylamine (NDPA) at 10http://www.medsci.org
Int. J. Med. Sci. 2017, Vol. 14ppt and seeks to decrease this to 3 ppt [8]. TheNational Institute for Public Health and theEnvironment (RIVM, Netherlands) proposed aprovisional guideline value for NDMA in drinkingwater of 12 ppt. These actions are precursors to formalregulations; however, most countries have notdeveloped guidelines for NAms exposure due to alack of sufficient risk-assessment data.Exposure to NAms has been shown to beassociated with tumors in epidemiological studies ofhuman and laboratory animals [9]. NDMA, NDEAand N-nitrosomethylethylamine (NMEA) are highlymutagenic compounds that are suspected humancarcinogens, and it is estimated that NDEA as low as0.2 ppt in drinking water is associated with a 10 6increased lifetime cancer risk [10]. NDMA iscarcinogenic in experimental animals through severalexposure routes, including the ingestion of drinkingwater. Most studies have focused on a singlesubstance at a high concentration; however, manyNAms coexist in drinking water, and individualtoxicity may differ from a mixture exposure, whichcould be toxic at low doses [11, 12]. Presently, humansand environmental species are exposed to an almostinfinite number of possible chemical combinations;thus, evidence of low-dose exposures to mixtures ofenvironmental chemicals is of interest. Therefore, weinvestigated NAms mixtures at low doses tounderstand the health risk of pollutants in drinkingwater.For this study, we selected a dose-additionapproach and the most sensitive transformation cellline (NIH3T3) and common NAms compounds(NDMA, NDEA and NMEA) to assess the genotoxicand mutagenic potential and the possible molecularmechanism underlying low-dose exposure to a NAmsmixture in drinking water.Materials and MethodsBacterial strain and cellsThe T97, TA98, TA100 and TA102 S. typhimuriumstrains were obtained from Ames Laboratory in USA.The NIH3T3 cells (ATCC, CRL-1658) were cultured inDMEM (Gibco, Grand Island, NY, USA) containing10% FBS (Gibco, USA), 100 U/ml penicillin and 100μg/ml streptomycin at 37 C in a humidified 5% CO2atmosphere.Database of exposureMeta-analysis was performed to summarizeaverage NAms in drinking water. PubMed, Web ofScience and Google Scholar were used to review theexisting literature (from 1980 to 2015) [13-20]regarding NAms exposure in China’s drinking fection Byproducts or DBPs", "Drinking Water"and "China or Chinese" in various combinations. Wechose eligible full texts and contacted the authors toconfirm information when necessary.Cell viability assayCytotoxicity was measured using a CCK-8 assaykit (Kumamoto, Japan) [21]. We used 1-30,000-foldconcentrations of NAms to measure toxicity inNIH3T3 cells. Ten thousand cells with five replicateswere plated in 96-well microplates and cultured for 24h at 37 C. Then, the cells were incubated for anadditional 72 h in media containing different NAmsconcentrations. Subsequently, optical density (OD)was measured at 450 nm with a Bio-Rad microplatereader. Each experiment was repeated three times.The 50% lethal concentration (LC50) was calculatedusing a dose-response curve.Ames testTA98, TA100, T97 and TA102 Salmonellatyphimurium strains were cultured (1 109 cells/ml)overnight, and 0.5 ml S9 mix or PBS, 0.1 ml NAms and0.1 ml bacterial suspension were mixed in tubes andcultured for 1 h at 37 with shaking (100 times/min).Then, 2 ml of top agarose was added to each tube andpoured onto the underlying medium. The mixturewas incubated for 48 h at 37 C before counting therevertant colonies. Each test was performed intriplicate with positive and negative controls, asshown in Table S2. A chemical was regarded aspositive when the number of revertant colonies was atleast twice the negative control [22].Comet assayA comet assay was performed similar toprevious studies [23]. NIH3T3 cells were treated withdifferent concentrations of NAms for 24 h, and cellviability 75% H2O2 (500 μg/ml) and DMSO (0.5%)were used as positive and negative controls,respectively. Cells were embedded in an agarosemicro-gel and lysed. DNA was denatured andelectrophoresed under alkaline conditions (pH 13)and stained with EB solution (20 μg/ml) for 10 min.At least 100 randomly selected cells were analyzed foreach group, with triplicates, using fluorescentmicroscopy (Nikon, Japan). For quantifying DNAdamage, the percentage of tail DNA was calculatedusing a CASP image analysis system (CaspLab,Poland) [24].8-OHdG assayAfter exposure to NAms, the NIH3T3 cells’supernatant was centrifuged at 3,000 rpm for 10 min.We added 50 μl of standard solution to standardwells, 10 μl sample and 40 μl dilution buffer to samplehttp://www.medsci.org
Int. J. Med. Sci. 2017, Vol. 14wells and then 100 μl of HRP-conjugate reagent to thestandard well and sample well, respectively. The platewas then incubated 1 h at 37 C and was washed fivetimes. Next, 50 μl of TMB and HRP chromogenicsubstrates were added to each well and incubated for15 min in the dark at 37 C and then stopped with 50 μlstop solution. OD was measured and the 8-OHdGwas calculated. Each treatment was carried out intriplicate [25].Cytoplasm block micronucleus (CBMN) assayA CBMN assay was performed following theOrganization for Economic Co-operation andDevelopment’s method (OECD-T487) [26]. TheNIH3T3 cells were exposed to different NAms levelsfor 40 h (1.5-2 normal cell cycles). Mitomycin C (1μM)and 0.5% DMSO were used as positive and negativecontrols. At least 2,000 binucleated cells were scoredper group under fluorescence microscope (Nikon,Japan). Micronucleus (MNi), Nuclear Budding(NBUDs) and Nucleoplasmic Bridge (NPB) werecalculated [26, 27]. The experiments were repeatedthree times.Cell colony formation assayNIH3T3 cells were used due to their wideapplicability in cell malignant transformation studies.We seeded the NIH3T3 cells into a 6-well plate (100cells/well). After culturing for 24 h at 37 C, the cellswere treated with different NAms concentrations,positive control (3-methylcholanthrene, 3-MCA),solvent control (0.5 % DMSO) and negative control(distilled water) for 72 h, respectively. After washingtwice with PBS, the cells were continually cultured forseven days at 37 C, and the medium was refreshedevery three days. Then, the cells were fixed withmethyl alcohol and stained with 10% Giemsa, and thecolonies with more than 50 cells were counted [21, 28].This was used to quantify colony-forming efficiency(CFE) and relative colony-forming efficiency (RCFE).CFE and RCFE were calculated as follows:CFE (%) (number of colonies induced)/(number ofcells seeded) 100%RCFE (%) [(CEF of treatment group)/(CEF ofnegative control group)] 100%Cell transformation assayThe NIH3T3 cells were seeded at a density of2,000 cells/dish (10 cm), and the cells were culturedfor 24 h. Cells were treated the same as the cell colonyformation assay for 72 h. After rinsing with PBS, thecells were continually cultured for 14 days at 37 C,and the medium was replaced every three days. Thecells were stained with 10% Giemsa, and thetransformation frequency (TF) was calculated as963follows [28]:TF [total number of transformed colonies pertreatment/(total cells plated per treatment CFE)] 100%Concanavalin A (Con A) agglutinationThe transformed malignant cells induced byNAms were seeded (1,000 cells/dish) for the Con Aagglutination assay, and the untransformed cells werelabeled as negative controls. On day 14, the cells wereharvested by adjusting them to 104 cells /ml with PBS.Then, 100 μl of single-cell suspensions and differentconcentrations of Con A were added to 24-wellmicroplates for 10 min. Cell agglutination with Con Awas observed by microscope (Nikon, Japan) [21].Soft agar assayA 3-ml aliquot of 1.2% agar in a culture mediumwas plated in 60-mm dishes. Then 1,000 cells oftransformed malignant or untransformed cells weremixed with 3 ml of 0.35% agar in a medium andplated on the solidified bottom agar. When the topagar solidified, the dishes were transferred to anincubator and cultured for 30 days. Two or threedrops of the medium were added to each dish threetimes a week. After culturing for 30 days, the visiblecell colonies were photographed and counted [29].Cell cycle determinationNIH3T3 cells were seeded at a density of 3.2 104 and cultured for 24 h. The cells were treated withdifferent concentrations of NAms for 72 h. Afterrinsing with cold PBS, the cells were fixed with cold70% ethanol for 12-24 h. Then, the cells were rinsedtwice with cold PBS and stained using 0.5 ml of a stainagent (0.25% Triton X-100, 10 μg/ml PI, 100 μg/mlRNase) for 30 min in the dark. Measurements wereperformed with flow cytometry (BD, USA).RNA extraction and real-time RT-PCRRNA samples were extracted with TRIzolreagent (Invitrogen, Carlsbad, CA, USA) andquantified by Nanodrop (Thermo, Wilmington, DE).Total RNA was converted to cDNA by using SYBRGreen PCR Kit (Qiagen, Germany). The primers weredesigned using Primer Express Software v2.0(Applied Biosystems, Carlsbad, CA, USA) andsynthesized by the Beijing Genomics Institute (BGI,China). All the primers’ sequences are shown in theSupplemental (Table S3). The RT-PCR reactions wereperformed with ABI ViiA7 Sequence DetectionReal-Time PCR System (Applied Bio-systems, USA).The cycle threshold (Ct) values were used to show therelative gene expression. Eighteen ribosomal RNAgenes (rRNA, Hs99999901 s1, 18S) were used as anhttp://www.medsci.org
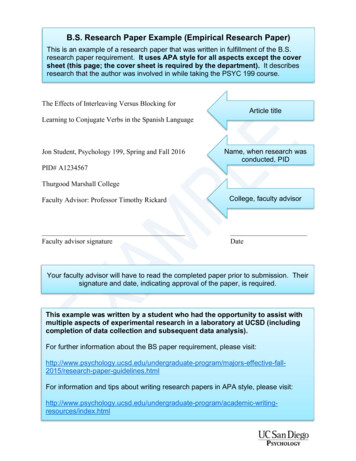
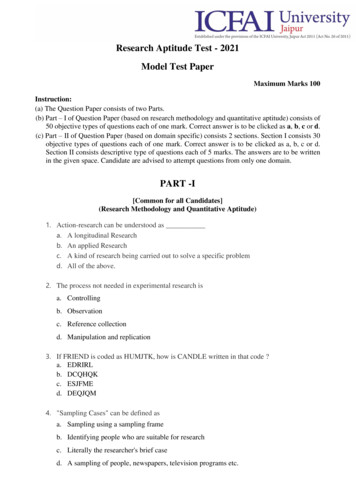
Int. J. Med. Sci. 2017, Vol. 14internal control. The difference in each group’s geneexpression was calculated with the 2 ΔΔCt method [12,30]. All experiments were run in triplicate.Western blotWestern blot analysis was performed as theprevious description [12]. The cells were harvestedafter being washed three times with cold PBS andplaced in a lysis buffer (Beyotime Institute ofBiotechnology, China) on ice for 15 min. The celllysates were centrifuged at 12,000 g at 4 C for 10min, and the supernatants were collected. Theconcentration of protein was detected via the BCAmethod. Proteins were separated in 8% SDSpolyacrylamide gel by electrophoresis and illipore, Bedford, MA, USA) after 4h of blocking inTBST solution containing 5% skim milk, and then theywere incubated with primary antibodies (Abcam,Cambridge, UK) overnight at 4 C. The antibodieswere diluted as follows: P21 (1: 1000), P53 (1: 1000),P38 (1: 1000), CDK1 (1: 1000), cyclinB1 (1: 2000), ChK1(1: 1000), GADD45A (1: 1000), CDC25B (1: 1000),CHK2 (1: 1000), CDC25A (1: 1000) and GAPDH (1:2000). The membranes were washed and thenincubated with horseradish peroxidase-conjugated(HRP) secondary antibodies for 1 h at roomtemperature. Proteins were detected by enhancedchemiluminescence using ECL reagent (BeyotimeInstitute of Biotechnology, China) and visualized onan image system (Image Quant LAS 4000 mini, USA).Signal densities were quantified using software ImageJ 1.44 (National Institutes of Health, Bethesda, MD,http://rsbweb.nih.gov/ij/).964Statistical analysisData were analyzed by SPSS version 18.0(Armonk, IBM Corp, NY, US) and presented as means standard deviations (SD), with p 0.05 consideredstatistically significant. Results were analyzed usingthe GraphPad Prism software (version 5.0, GraphPadPrism Inc., San Diego, CA). A Dunnett-t multiplecomparison analysis of treatments versus controlswas applied.ResultsOccurrence and concentration of NAms inChina’s drinking waterAccording to the literature [13-20], nine NAmscompounds are found in China’s drinking water.NDMA, NDEA and NEMA are the most common andare found at the greatest concentration; thus, in ourstudy, we used 10, 5 and 5 ng/L, respectively. Uponexamination of the chemicals’ toxic effects,cytotoxicity and proliferation rates were determinedto be confounding factors. To avoid this, we measuredthe viability of NIH3T3 cells exposed to thesecompounds, as well as a mixture of all. Table S2shows these data and the actual concentrations for thebiological experiment.Cytotoxicity of NAms in NIH3T3 cellsCell survival data appears in Figure 1. Survivaldecreased with an increased concentration of NAmsin both single and mixture exposure groups.Treatment with mixed NAms reduced viability themost. The data show that a 1,000-fold concentration ofmixture exposure was chosen as an optimalconcentration, according to the OECD’sproposed genotoxicity dose requirements.NAms mixture exposure increasedAmes assay coloniesFigure 1. Cytotoxicity of individual NAms and a mixture in drinking water. Both exposuresinhibited cell survival, and this was dose-dependent. The mixture contained NDMA, NDEA and NMEA.The exposure dose was set as a fold of actual environmental exposure level: 1 represents 10 ng/L forNDMA; 1 represents 5 ng/L for NDEA and NMEA; 1 represents (10NDMA 5NDEA 5NMEA) ng/L for themixture.An Ames test was performed inTA97, TA98, TA100 and TA102 S.typhimuriumstrains, and the datademonstrate that 100-fold (20 102 ng/L)and 1,000-fold (20 103 ng/L) NAmsmixtures increase colonies, as shown inFigure 2A. The mutagenic index (MI) dataappear in Supplemental Table S2. Nodifferences were observed for S.typhimurium revertant colonies among thethree NAms alone or in the mixture ofTA97 and TA102 strains (SupplementalFigure S2).NAms mixture exposure causedchromosomal damage according tohttp://www.medsci.org
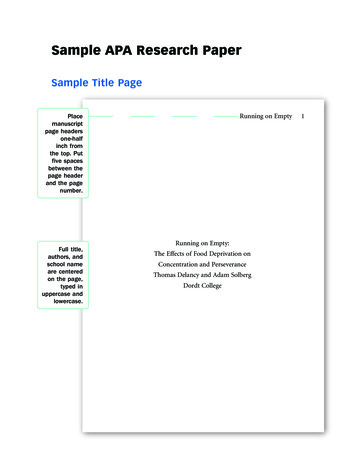
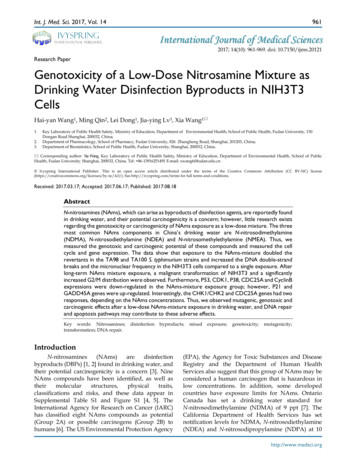
Int. J. Med. Sci. 2017, Vol. 14a CBMN testA CBMN test was used to measure chromosomaldamage after exposure of an NIH3T3 cell line toNAms alone or a mixture, and the data show that themixture increased MNi in NIH3T3 cells but that asingle exposure has no influence (Figure 2B). NBUDsand NPB were similar (Supplemental Figure S4).NAms mixture exposure can induce DNAdouble-strand breaks, as measured with acomet assayA comet assay confirmed that a mixture of1,000-fold (20 103ng/L) NAms exposuresignificantly increased the percentage of tail DNA (p 0.05) in NIH3T3 cells compared to the controls;however, no such changes were observed in NAmsalone (1 to 1,000-fold) or with low-dose mixedexposure (1 to 100-fold; Figure 2C). The 8-OHdG dataagree with the comet assay (Supplemental Figure S3)Colony formation assay965appear in Figure 3A.Compared with the controls,RCFE (%) was not significantly different amongNDMA, NDEA, NMEA and mixture exposures (p 0.05). RCFE for each treatment was expressed as apercentage of CFE from the negative controls.NAms mixture exposure transformed NIH3T3cellsIndividual NAms do not induce NIH3T3 celltransformation; however, the mixture increased TF inthe NIH3T3 cell (Figure 3B). Con A and the soft agarassay confirmed phenotypic changes in thetransformed cells (Figure 3C and Figure 3D).Furthermore, the untransformed NIH3T3 cells wereagglutinated with only a high (100µg/ml)concentration of Con A, whereas NAms-transformedcells were agglutinated with 25µg/ml Con A(Supplemental Table S4). Negative controls failed togrow when suspended in soft agar; however,NAms-transformed cells grew in soft agar(Supplemental Table S5).Cell colonies were counted as depicted in theMethods section, and CFE (%) and RCFE (%) dataFigure 2. Genotoxic potential of low-dose exposure to single or NAms mixture in NIH3T3 cells. A. Mutagenicity concentration-response curves for single andmixed NAms with TA98 and TA100 S. typhimurium. B. Determination of micronucleus formation induced by NAms in NIH3T3 cells. Binucleated cells with micronuclei afterexposure to NAms for 40 h. The upper image shows the MNi, NPBs and NBUDs, respectively. MNi were fewer in the lower panel. Compared to the control, a mixture of1,000-fold (20 103 ng/L) NAms can cause an increased MNi in NIH3T3 cells (p 0.05). C. The percentage of tail DNA induced by NAms was measured using a comet assay. Theupper panel (a) represented the cytotoxicity at the same concentration of NAms, and the lower panel (b) represented DNA damage. Compared to the control, a mixture of1,000-fold (20 103 ng/L) NAms significantly increased the percentage of tail DNA (p 0.05) in NIH3T3 cells.http://www.medsci.org
Int. J. Med. Sci. 2017, Vol. 14966Figure 3. NAms-induced transformation of NIH/3T3 cells. A. Colony-forming assay results showed that relative colony-forming efficiency (RCFE) was not significantlydifferent among NDMA, NDEA, NMEA and mixture exposures. B. Transformation assay results for the combined exposure of three NAms at 1,000-fold (20 103 ng/L)concentrations can increase transformation frequency (TF) in NIH3T3 cells. C. The results of Con A agglutination (a, b) and the results of soft agar assay (c, d); a: dispersive cells;b: agglutinated cells; c: non-survival cells; d: NAms-transformed cells. D. Transformed cell images: normal cells (a, b) and NAms-transformed cells (c, d).NAms mixture exposure leads to G2/M arrestby multiple gene regulationCell-cycle analysis showed significant G2/Marrest after 1,000-fold (20 103 ng/L) NAms mixtureexposure (Figure 4A and 4B). Because thisconcentration can induce cell transformation andG2/M arrest, we speculated that some genes mayregulate the effects of the mixture exposure. Geneexpression data show that genes were altered, andcompared to the single exposure, the mRNA andprotein for P53/CDK1/CDC25A/P38/CyclinB1 weredown-regulated with the 1,000-fold (20 103 ng/L)NAms mixture exposure group, and the P21 andGADD45A genes were up-regulated (Figure 4C andSupplemental Figure S5). After 1,000-fold NAmsmixture exposure, the CHK1/CHK2 genes wereup-regulated, and the CDC25A genes weredown-regulated (Figure S5).DiscussionNAms are nitrogen non-halogen DBPs mainlygenerated during chloramine disinfection [31, 32], andthey may be carcinogenic. Thus, some countries haveguidelines for specific NAms components; however,these guidelines are based on single NAms exposures.Better data about NAms mixtures may help establishsafety limits for these types of exposures in drinkingwater, yet no reports for mixtures are available [33,34].Furthermore, the genotoxic assessments ofNAms are usually assessed as mg/L, which is 40-50million times the concentrations present in drinkingwater. For example, NDMA has been studied using anAmes assay at 20 mM [35] and with a comet assay at2.39 mM [36]. Previous genotoxicity studies withNAms-DBPs did not assess the genotoxicitythoroughly with different end points [35, 36].Research may also ignore potent adverse effects wheninvestigating the predicted effects (or risk assessment)http://www.medsci.org
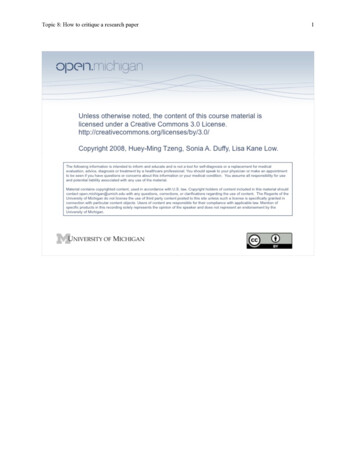
Int. J. Med. Sci. 2017, Vol. 14for mixed chemicals at a low dose. Thus, we mustbetter characterize the genotoxicity and mutagenicityof NAms [37]. Therefore, we used a genotoxicity testproposed by the International Council forHarmonization (ICH) [38], including an Ames, comet,8-OHdG and CBMN assays, to evaluate thegenotoxicity of NAms individually and as mixtures invitro. We found increased mutagenicity in doublerevertants, chromosome abbreviation and DNAdouble-strand breaks after exposure to athree-compound mixture at 1,000-fold (20 103 ng/L)of actual NAms in drinking water, and at thisconcentration, genotoxic and carcinogenic effectswere noted. The mutagenic potential of NAms wasmeasured using a cell transformation assay in vitro[39], and NAms in a 1,000-fold (20 103 ng/L) mixtureinduced a malignant transformation in NIH3T3 cells.Thus, the mixture had greater genotoxicity andmutagenicity than the individual constituents.To evaluate genotoxicity and mutagenicity of aNAms mixture exposure, we conducted cell-cycle andgene-expression evaluations in the transformed cells.The data show that 100-fold and 1,000-fold967concentrations of NAms exposure could lead toG2/M arrest; however, only the 1,000-foldconcentrations induced cell transformation. RT-PCRand western blot showed that p53, p21, CDC25A/B1,CHK1/2 and CDK1/2 expressions were up-regulatedin the 100-fold (20 102 ng/L) exposure butdown-regulated after a 1,000-fold exposure. DNAdamage from NAms included DNA adducts and anactivated DNA damage checkpoint. The NIH3T3 cells’exposure to NAms caused DNA damage and initiatedDNA repair pathways, triggering cell-cycle arrest torepair the damage. However, the activated repairresponse was not effective when the exposureexceeded a threshold that produced a transformedmalignant cell. Our study had some limitations in thatwe did not elucidate how each NAms componentcontributed to toxicity independently as a carcinogen.Thus, more study is needed. Furthermore, thegene-expression data were uncertain, as activityvaried with increasing concentrations. We requireRNA and/or protein data to better understand thesepreliminary observations.Figure 4. Effect of low-dose NAms mixture exposure and cell cycle and gene expression. (A) Representative flow cytometry image of cell-cycle results. (B) NIH3T3cells were in G2/M arrest after 1,000-fold (20 103 ng/L) mixed NAms exposure compared to control cells (p 0.05). C. Expression of protein for cell-cycle regulation genes;(a) expression of P53, P38, p21, GADD45A and CDK1 (CDK2); (b) expression of CDC25A, CDC25B, CHK2, CHK1 and CyclinB1; * indicates p 0.05 vs control.http://www.medsci.org
Int. J. Med. Sci. 2017, Vol. 14This is the first genotoxicity and carcinogenicitystudy of low-dose NAms mixture exposure, and thedata suggest NAms are hazardous to public health;however, their toxicity and mechanism must beclarified. Human epidemiological studies must beperformed to understand NAms’ adverse effects onpublic health and our environment.AbbreviationsCBMN: Cytokinesis-block Micronuclei Test;CFE: colony-forming efficiency;Con A: Concanavalin;DBPs: Disinfection Byproducts;3-MCA: 3-Methylcholanthrene;MNi: Micronucleus;NAms: Nitrosamines;NBUDs: Nuclear Buddings;NDEA: N-nitrosodiethylamine;NDMA: N-nitrosodimethylamine;NDPA: N-nitrosodipropylamine;NMEA: N-nitrosomethylethylamine;NPB: nucleoplasmic bridge;TF: Transformation frequency;RCFE: relative colony forming efficiency.Supplementary MaterialSupplementary figures and edgmentsWe thank all researcher coordinators whocontributed to this study.Author .19.20.21.HY, XW with the assistance of MQ, JY and TL,performed the study design, lab work and dataanalysis. All authors discussed the results andcommented on the manuscript at every stage. HY andLD contributed to the manuscript’s writing andrevision.24.Competing Interests26.The authors have declared that no competinginterest exists.27.References1.2.3.4.5.Richardson SD, Plewa MJ, Wagner ED, Schoeny R, Demarini DM. Occurrence,genotoxicity, and carcinogenicity of regulated and emerging disinfectionby-products in drinking water: a review and roadmap for research. Mutat Res.2007; 636: 178-242.Richardson SD, Ternes TA. Water analysis: emerging contaminants andcurrent issues. Anal Chem. 2014; 86: 2813-48.Moudgal CJ, Lipscomb JC, Bruce RM. Potential health effects of drinkingwater disinfection by-products using quantitative structure toxicityrelationship. Toxicology. 2000; 147: 109-31.Mitch WA, Sedlak DL. Formation of N-nitrosodimethylamine (NDMA) fromdimethylamine during chlorination. Environ Sci Technol. 2002; 36: 588-95.Schreiber IM, Mitch WA. Occurrence and fate of nitrosamines and nitrosamineprecursors in wastewater-impacted surface waters using boron as aconservative tracer. Environ Sci Technol. 2006; 40: 3203-10.22.23.25.28.29.30.31.32.[Internet] IARC monographs on the evaluation of the carcinogenic risk /ENG/Monographs/vol1-42/mono27.pdf[Internet] Ontario Goverment. Technical support document for loads/2011/03/std01 079707.pdf[Internet] California Environmental Protection Agency. NDMA and othernitrosamines-drinking water issues. 2013. http://www.waterboards.ca.gov/drinking water/certlic/drinkingwater/NDMA.shtml.Eichholzer M, Gutzwiller F. Dietary nitrates, nitrites, and N-nitrosocompounds and cancer risk: a review of the epidemiologic evidence. Nutr Rev.1998; 56: 95-105.[Internet] EPA US. United States Environmental Protection Agency. IntegratedRisk Information System Summaries(IRIS). 2015. http://cfpub.epa.gov/ncea/irisWang S, Tian D, Zheng W, Jiang S, Wang X, Andersen ME, et al. Combinedexposure to 3-chloro-4-dichloromethyl-5-hydroxy-2(5H)-furanone andmicrosytin-LR increases genotoxicity in Chinese hamster ovary cells throughoxidative stress. Environ Sci Technol. 2013; 47: 1678-87.Wang S, Zhang H, Zheng W, Wang X, Andersen ME, Pi J, et al. Organic extractcontaminants from drinking water activate Nrf2-mediated antioxidantresponse in a human cell line. Environ Sci Technol. 2013; 47: 4768-77.Hung HW, Lin TF, Chiu CH, Chang YC. Trace Analysis of N-Nitrosamines asChromatograph-Tandem Mass Spectrometry. Water Air & Soil Pollut. 2010;213: 459-69.Luo Q, Wang D, Wang Z. Occurrences of nitrosamines in chlorinated andchloraminated drinking water in three representative cities, China. Sci TotalEnviron. 2012; 437: 219-25.Sgro LA, Simonelli A, Pascarella L, Minutolo P, Guarnieri D, Sannolo N, et al.Toxicological properties of nanoparticles of organic compounds (NOC) fromflames and vehicle exhausts. Environ Sci Technol. 2009; 43: 2608-13.Wang C, Zhang X, Wang J, Liu S, Chen C, Xie Y. Effects of organic fractions onthe formation and control of N-nitrosamine precursors during conventionaldrinking water treatment processes. Sci Total Environ. 2013; 449: 295-301.Wang CK, Zhang XJ, Wang J, Chen C. Detecting N-nitrosamines in watertreatment plants and distribution systems in China using ultra-performanceliquid chromatography-tandem mass spectrometry. Front EnvironSci & Eng.2012; 6: 770-7.Wang W, Hu J, Yu J, Yang M. Determination of N-nitrosodimethylamine indrinking water by UPLC-MS/MS. J Environ Sci (China). 2010; 22: 1508-12.Wang W, Ren S, Zhang H, Yu J, An W, Hu J, et al. Occurrence of ninenitrosamines and secondary amines in source water and drinking water:Potential of seconda
1. Key Laboratory of Public Health Safety, Ministry of Education, Department of Environmental Health, School of Public Health, Fudan University, 130 . International Agency for Research on Cancer (IARC) has classified eight NAms compounds as potential . strains were obtained from Ames Laboratory in USA. The NIH3T3 cells (ATCC, CRL-1658) were .