Transcription
Earth Syst. Sci. Data, 13, 2515–2528, 2021https://doi.org/10.5194/essd-13-2515-2021 Author(s) 2021. This work is distributed underthe Creative Commons Attribution 4.0 License.University of Colorado and Black Swift TechnologiesRPAS-based measurements of the lower atmosphereduring LAPSE-RATEGijs de Boer1,2 , Cory Dixon3,a , Steven Borenstein3 , Dale A. Lawrence3 , Jack Elston4 , Daniel Hesselius5 ,Maciej Stachura4 , Roger Laurence III3,b , Sara Swenson3 , Christopher M. Choate3 , Abhiram Doddi3 ,Aiden Sesnic3 , Katherine Glasheen3 , Zakariya Laouar3 , Flora Quinby3 , Eric Frew3 , andBrian M. Argrow31 CooperativeInstitute for Research in Environmental Sciences,University of Colorado Boulder, Boulder, Colorado, USA2 Physical Sciences Division, National Oceanic and Atmospheric Administration, Boulder, Colorado, USA3 Department of Aerospace Engineering, University of Colorado Boulder, Boulder, Colorado, USA4 Black Swift Technologies, Boulder, Colorado, USA5 Office of Integrity, Safety, and Compliance, University of Colorado Boulder, Boulder, Colorado, USAa current address: Geotech Environmental Equipment, Denver, Colorado, USAb current address: Ball Aerospace & Technologies Corporation, Boulder, Colorado, USACorrespondence: Gijs de Boer (gijs.deboer@colorado.edu)Received: 8 November 2020 – Discussion started: 7 December 2020Revised: 5 March 2021 – Accepted: 31 March 2021 – Published: 4 June 2021Abstract. Between 14 and 20 July 2018, small remotely piloted aircraft systems (RPASs) were deployedto the San Luis Valley of Colorado (USA) together with a variety of surface-based remote and in situsensors as well as radiosonde systems as part of the Lower Atmospheric Profiling Studies at Elevation– a Remotely-piloted Aircraft Team Experiment (LAPSE-RATE). The observations from LAPSE-RATEwere aimed at improving our understanding of boundary layer structure, cloud and aerosol properties, andsurface–atmosphere exchange and provide detailed information to support model evaluation and improvement work. The current paper describes the observations obtained using four different types of RPASs deployed by the University of Colorado Boulder and Black Swift Technologies. These included the DataHawk2, the Talon and the TTwistor (University of Colorado), and the S1 (Black Swift Technologies).Together, these aircraft collected over 30 h of data throughout the northern half of the San Luis Valley, sampling altitudes between the surface and 914 m a.g.l. Data from these platforms are publicly available through the Zenodo archive and are co-located with other LAPSE-RATE data as part of the ZenodoLAPSE-RATE community (https://zenodo.org/communities/lapse-rate/, last access: 27 May 2021). The primary DOIs for these datasets are https://doi.org/10.5281/zenodo.3891620 (DataHawk2, de Boer et al., 2020a, e),https://doi.org/10.5281/zenodo.4096451 (Talon, de Boer et al., 2020d), https://doi.org/10.5281/zenodo.4110626(TTwistor, de Boer et al., 2020b), and https://doi.org/10.5281/zenodo.3861831 (S1, Elston and Stachura, 2020).Published by Copernicus Publications.
25161G. de Boer et al.: RPAS-based measurements of the lower atmosphere during LAPSE-RATEIntroductionDuring the summer of 2018, the University of Coloradoalong with the Earth System Research Laboratory (ESRL)of the National Oceanic and Atmospheric Administration(NOAA) and National Center for Atmospheric Research(NCAR) hosted the annual meeting for the International Society for Atmospheric Research using Remotely piloted Aircraft (ISARRA; de Boer et al., 2019a). Along with this conference the organizers set up a “flight week”, where participating groups could conduct remotely piloted aircraft system(RPAS) flights in a coordinated manner to make scientifically relevant measurements of the lower atmosphere. Thiscampaign, titled “Lower Atmospheric Profiling Studies atElevation – a Remotely-piloted Aircraft Team Experiment”(LAPSE-RATE, de Boer et al., 2020a, c), brought together avariety of teams to Colorado’s San Luis Valley for a week ofatmospheric science-centric RPAS operation. A summary ofthe LAPSE-RATE campaign, including an overview of meteorological conditions and the San Luis Valley sampling environment, is provided in an overview paper at the beginningof this special issue (de Boer et al., 2020c).As a part of the LAPSE-RATE effort, a team of participants from the University of Colorado Boulder (CU)and Black Swift Technologies (BST) contributed a week oftime and RPAS and ground-based equipment. These teams,originating in CU’s Integrated Remote and In Situ Sensing(IRISS) grand challenge project, the Cooperative Institutefor Research in Environmental Science (CIRES), and theDepartment of Aerospace Engineering’s Research and Engineering Center for Unmanned Vehicles (RECUV), consistedof a combination of scientists, engineers, and students andleveraged the technology and expertise developed over a variety of previous successful RPAS-based atmospheric sciencedeployments conducted by the University of Colorado. Theseinclude development of equipment and execution of fieldcampaigns to better understand the thermodynamic and dynamic environments around supercell thunderstorms (Kochet al., 2018; Frew et al., 2012; Houston et al., 2012), extensive operation of RPASs at high latitudes (de Boer et al.,2016, 2018, 2019b, c; Cassano et al., 2016; Cassano, 2014;Intrieri et al., 2014; Knuth et al., 2013), and the use of theseplatforms to understand turbulence around the world, including in tropical cyclones (Cione et al., 2020). Similarly, BSThas an extensive background of conducting RPAS operationsfor environmental science as evidenced by a variety of studies and synthesis papers (Elston et al., 2015, 2011a, b). Thisexperience has resulted in a variety of innovative operationalmodes, including a roaming flight pattern called “follow me”,in which the aircraft is trained to follow a flight pattern centered on a moving vehicle. This pattern provided insight intospatial gradients across the valley, as discussed later.Earth Syst. Sci. Data, 13, 2515–2528, 2021For the LAPSE-RATE campaign, the CU and BST teamswere interested in contributing to all of the science goals connected to the campaign, including– convective initiation,– the morning boundary layer transition,– density currents and drainage flows,– aerosol properties, and– sensor and platform intercomparison work.CU and BST participation included a significant number ofparticipants ( 15); several operations vehicles; over 10 unmanned aircraft; and a mobile atmospheric observatory, command/control center, and computing facility (see de Boeret al., 2021). The next section provides an overview of theRPASs deployed, including information on the platforms andthe sensors they carried, as well as the unique capabilities offered by each. Section 3 provides insight into the samplingthat was completed, including information on measurementlocations, the types of weather conditions sampled, generaldetails on flight strategies, statistics summarizing the flightsand data collected, and information on interesting eventssampled. Section 4 provides an overview of data processing and quality control, while Sect. 5 offers insight into dataavailability (and DOIs). Finally, we summarize the paper anddataset and provide information on contributions of authors,funding sources, and collaborators.2Overview of platforms and sensorsDuring LAPSE-RATE, CU and BST operated a combinationof six different RPAS types. An overview of these systems isprovided in Table 1. These range from commercially available airframes with open-source autopilot systems to customsystems entirely designed, developed, and constructed at CUand BST. In this section, we provide an overview of the different aircraft and the sensors carried by each.One of the CU aircraft with the most amount of flighttime during LAPSE-RATE was the DataHawk2 platform(Fig. 1a). This system, developed and designed entirelywithin RECUV, consists of a lightweight ( 1 kg takeoffweight), 1.2 m fixed-wing foam pusher-prop aircraft, with acustom autopilot system and sensor suite. Capable of approximately 45 min of flight with a standard battery configurationand featuring a cruise speed of 14–16 m s 1 , the DataHawk2has a theoretical range of approximately 40 km. It has operated in a variety of environments, including the high Arctic (de Boer et al., 2018, 2019b), Asia (Kantha et al., 2017),and South America (Scipión et al., 2016). The DataHawk2’srelatively slow flight speed (14 m s 1 , burst up to 22 m s 1 )allows the platform to obtain measurements at high spatialresolution when compared to other aerial vehicles, makingit ideal for studies of atmospheric turbulence at fine scaleshttps://doi.org/10.5194/essd-13-2515-2021
G. de Boer et al.: RPAS-based measurements of the lower atmosphere during LAPSE-RATE2517Table 1. An overview of the platforms and meteorologically relevant measurements from each. The total number of campaign flight hourscovered by each platform are included in brackets in the first (leftmost) column.PlatformMeasurementSensorStated accuracyCU DataHawk2 [8.84 h]Temperature ( C)Relative humidity (%)Pressure (hPa)Wind speed (m s 1 )Wind direction (m s 1 )Upwardanddownwardlooking brightness temperature( C)Sensiron SHT-31Sensiron SHT-31 / 0.2 C (0–90 C) / 2 % (0 %–100 %)MultipleMultipleSemitec ature (C)Relative humidity (%)Pressure (hPa)Wind speed (m s 1 )Wind direction (m s 1 )E E Elektronik EE-03E E Elektronik EE-03BST MHPMultiple, including BST MHPMultiple, including BST MHP / 0.3 C (at 20 C) / 3 % (at 21 C)UndeterminedUndeterminedCU Talon [4.2 h]Temperature ( C)Relative humidity (%)Pressure (hPa)Wind speed (m s 1 )Wind direction (m s 1 )Vaisala RSS904Vaisala RSS904Vaisala RSS904Multiple (from PixHawk autopilot)Multiple (from PixHawk autopilot)0.2 C2%0.4 hPaUndeterminedUndeterminedCU TTwistor [7.49 h]Temperature (C)Relative humidity (%)Pressure (hPa)Wind speed (m s 1 )Wind direction (m s 1 )Vaisala RSS904Vaisala RSS904Vaisala RSS904Multiple, including Aerosonde MHPMultiple, including Aerosonde MHP0.2 C2%0.4 hPaUndeterminedUndeterminedBST S1 [10.13 h](e.g., Kantha et al., 2017; Balsley et al., 2018). Despite thisrelatively slow speed, the DataHawk2 has been operated inwinds up to 12 m s 1 , making it a robust research platformfor the harsh Arctic environment. The aircraft is capable ofautonomous operation, although most flights (including allof the LAPSE-RATE flights) are completed under a remotepilot scenario, where the aircraft is guided and monitoredusing a computer ground station. The DataHawk2 collected8.84 h of data during LAPSE-RATE.The DataHawk2 system carries a variety of sensors formeasuring atmospheric and surface properties. Custom-builtinstrumentation includes a fine wire sensor array employing two cold wires and one hot wire. These fine wiresoffer high-frequency (800 Hz) information on temperatureand fine-scale turbulence. High bandwidth is enabled bysmall surface-area-to-volume ratios of very thin (5 µm diameter) wires. In addition to the fine wire array, the DataHawk2 carries custom electronics that include integratedcircuit slow response sensors (Sensiron SHT-31) for measurement of temperature through a calibrated semiconductorand relative humidity using a capacitive sensor. To measuresurface and sky brightness temperatures, DataHawk2s areequipped with upward- and downward-looking thermopilesensors (Semitec 10TP583T with custom electronics). Toprovide additional information on thermodynamic 1DataHawk2s have also carried the commercially availableiMet1 radiosonde package, providing comparative information on position (GPS), temperature (bead thermistor), pressure (piezoresistive), and relative humidity (capacitive), aswell as the Vaisala RSS421 sensor that is similar to thesensor suite used for the popular RS-41 radiosonde. However, neither the iMet1 nor RSS421 were installed duringLAPSE-RATE. Finally, to estimate winds using the DataHawk2, information from the onboard GPS, pitot tube, andinertial measurement unit (IMU) is integrated to calculateall three wind vectors. This calculation is completed usingequations presented in van den Kroonenberg (2008), underthe assumption that the aircraft instantly reacts to perturbations in the local wind vector, meaning that the sideslip angle(β) is assumed to be zero and that the angle of attack (α)is set to be equal to the mean pitch of the aircraft in levelflight. These sensors are logged at a variety of different acquisition rates. Specifically, the fine wire measurements werelogged on board the aircraft at 800 Hz, while other variableswere logged at 100 Hz. All data are interpolated to a common10 Hz clock in the archived LAPSE-RATE datasets.In addition to the DataHawk2, CU collaborated withBST to operate a Black Swift S1 RPAS (Fig. 1b) duringLAPSE-RATE. This platform was originally designed asan advanced, fully autonomous survey and mapping platEarth Syst. Sci. Data, 13, 2515–2528, 2021
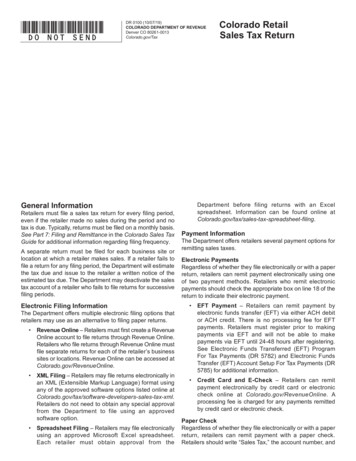
2518G. de Boer et al.: RPAS-based measurements of the lower atmosphere during LAPSE-RATEFigure 1. The aircraft used to collect the datasets described in this paper. Clockwise from the top left: the CU DataHawk2, the BST S1, theCU Talon, and the CU TTwistor mounted on top of a tracker vehicle for launch prior to follow-me operations.form. Equipped with the Black Swift Technologies SwiftCore flight management and autopilot system, remote operation and flight planning is done from a tablet. Takeoff isperformed through non-assisted hand launches, and the advanced landing algorithm provides for robust and precise autonomous belly landings. The aircraft has a 1.7 m wingspanand a gross takeoff weight of 2.5 kg. When operated witha 13 600 mA h lithium polymer battery, it allows for an endurance of up to 1.5 h at a cruise speed of 17 m s 1 , depending on the mission profile and environmental conditions.The aircraft has a high operational ceiling and has been usedto perform mapping missions at altitudes up to 14 000 feet(4267.2 m) in Colorado. It has been employed for surveying work, land management, crop damage assessments, andlarge area ecological studies. During LAPSE-RATE, the S1was equipped with the Black Swift Technologies multi-holeprobe (BST MHP). This probe includes five pressure ports tomeasure the system’s airspeed, angle of attack, and sideslipangle that can be combined with information from an INSEarth Syst. Sci. Data, 13, 2515–2528, 2021and GPS to provide estimates of the horizontal and verticalwind speed and direction. The BST MHP includes an integrated E E Elektronik EE-03 sensor for environmental humidity and temperature. This sensor has a stated accuracyof 3 % relative humidity for environmental conditions between 10 %–100 %, and a temperature accuracy of 0.3 Cat an ambient temperature of 20 C. All data collected usingthe S1, with the exception of the temperature and humidity,were logged at 100 Hz. The temperature and humidity valueswere logged at 4 Hz. The S1 collected 10.13 h of data duringLAPSE-RATE.Beyond the DataHawk2 and S1, CU operated two otheraircraft on a more limited basis. The first of these was the XUAV Talon RPAS (Fig. 1c). These systems are small (1.7 m,3 kg) airframes made of expanded polyolefin (EPO) foamand were outfitted with the PixHawk2 autopilot system running the open-source ArduPilot Plane software. For LAPSERATE, the Talons were set up to fly for approximately 45 minon a single battery at a cruise speed of 18 m s 1 . As withhttps://doi.org/10.5194/essd-13-2515-2021
G. de Boer et al.: RPAS-based measurements of the lower atmosphere during LAPSE-RATEthe DataHawk2, this relatively slow flight speed provideshigh-resolution measurements from the custom payload thatwas flown on this platform. The Talons operated for LAPSERATE carried a Vaisala RSS904 sensor (similar sensor module to that used in the Vaisala RS-92 radiosonde) to makemeasurements of temperature, pressure, and humidity. TheRSS904 features a capacitive wire temperature sensor witha 0.1 C resolution, a thin-film capacitor humidity sensorwith a resolution of 1 %, a silicon pressure sensor with ameasurement resolution of 0.1 hPa, and expected accuracies of 0.2 C, 2 % and 0.4 hPa, respectively, in temperature,RH, and pressure. The Talon collected 4.2 h of data duringLAPSE-RATE.The RSS904 sensor suite was integrated into a custom3D-printed nose cone. In addition to measurements from theRSS904, wind speed and direction were estimated by the autopilot system, using a combination of the GPS velocities,aircraft attitude measurements from the inertial navigationsystem, and aircraft airspeed. Aircraft navigation data werelogged at 10 Hz, while the pressure, temperature, and humidity values from the RSS904 were logged at 2 Hz. For alimited number of Talon flights, the aircraft carried a “microsonde” custom temperature, pressure, and humidity sensor suite developed at CU. The microsonde was developedto be integrated into a Lagrangian drifter called the Driftersonde (Swenson et al., 2019) that could be launched fromsmall RPASs for atmospheric research. The microsonde includes a MS8607 pressure, temperature, and humidity (PTH)sensor from TE Connectivity, which consists of a piezoresistive pressure sensing element, which measures both barometric pressure and temperature. The piezoresistive microelectromechanical systems (MEMS) measure atmospheric pressure relative to a vacuum inside the MEMS, sealed by athin membrane. A Wheatstone bridge logs temperature bymeasuring the temperature-dependent resistance. Additionally, the MS8607 includes a capacitive sensing element thatfeatures a dielectric polymer film, sensitive to humidity, between two electrodes to measure relative humidity. In addition to the MS8607, the microsonde includes a CAM-M8QGPS module (u-blox) that provides reception of up to threeglobal navigation satellite systems (GNSS) (GPS, Galileo,GLONASS, BeiDou) at a given time. The integration of themicrosonde on the Talon during LAPSE-RATE was, in part,to provide a dataset to allow for direct comparison betweenthe measurements it produced to those from the RSS904,which is considered to be an industry standard sensor suite.Microsonde data were logged at 1 Hz.Finally, the other aircraft operated by CU that saw limited action during LAPSE-RATE was the TTwistor RPAS(Fig. 1d). The TTwistor is based on an earlier, proven design,the Tempest (Elston et al., 2011b; Roadman et al., 2012),which was deployed extensively to study severe weather inthe midwestern United States. The TTwistor is a dual-motorRPAS capable of completing up to 3 h of continuous flightoperations with an 18 000 mA h high-voltage lithium er (Li-HV) battery pack. This results in a range of 120–240 km, depending on operational mode and flight pattern, ata typical cruise speed of 28 m s 1 . Additionally, the aircraftwas designed to be capable of a fast (40 m s 1 ) dash speedto allow it to get out of situations with strong winds aroundconvective storms. The aircraft carries a PixHawk autopilot system for autonomous navigation between GPS coordinates and remote operation by a ground pilot. For LAPSERATE the TTwistor carried a payload consisting of a multihole pressure probe (MHP) from Aeroprobe Corporation; aVectorNav VN-200 inertial navigation system (INS); and aVaisala RSS904 pressure, temperature, and humidity sensorsystem. The VN-200 has a stated dynamic accuracy of 0.1 (rms) in pitch and roll measurements and 0.3 (rms) in magnetic heading. Additionally, it features a stated 2.5 m (5.0 m)accuracy in horizontal (vertical) position and 0.05 m s 1 accuracy in velocity. In combination the airspeed, angle of attack, and sideslip angles from the MHP and attitude andground-relative velocity information from the VN-200 allowfor fully informed calculation of the vertical and horizontalwinds. VN-200 data were logged at 50 Hz, MHP data werelogged at 100 Hz, and the RSS904 variables were logged at2 Hz.The extended endurance of the TTwistor, along with advanced implementation of autopilot capabilities and a surface tracking vehicle (Fig. 1d), allows this platform to bedeployed in a follow-me mode. In this mode of operation,the flight team is inside of a moving vehicle, and the aircraft is programmed to stay within a given distance of thevehicle while in flight. This allows for the execution of extended horizontal transects for collection of data on spatialvariability and gradients. The follow-me mode has been usedto make measurements of outflow boundaries associated withsevere storms, and during LAPSE-RATE it was implementedto attempt to better understand the influence of surface heterogeneity on the overlying atmospheric state. The TTwistorcollected 7.49 h of data during LAPSE-RATE.3Description of measurement locations, flightstrategies, and completed flights/samplingOver the course of the 1-week LAPSE-RATE campaign, theplatforms described above conducted flights over a variety ofdifferent areas to collect atmospheric data (Fig. 2). All of theaircraft involved conducted flights alongside the CU MobileUAS Research Collaboratory (MURC; de Boer et al., 2021)at Leach Airport (37.79 N, 106.05 W) to allow for intercomparison of platforms and sensors. Unfortunately, the datafrom the Talon and TTwistor were not processed in time tobe included in the formal intercomparison conducted throughthis effort (Barbieri et al., 2019).Besides the limited flights conducted at Leach Airport,the remainder of the CU DataHawk2 LAPSE-RATE operations were conducted at a farm site in the western part ofEarth Syst. Sci. Data, 13, 2515–2528, 2021
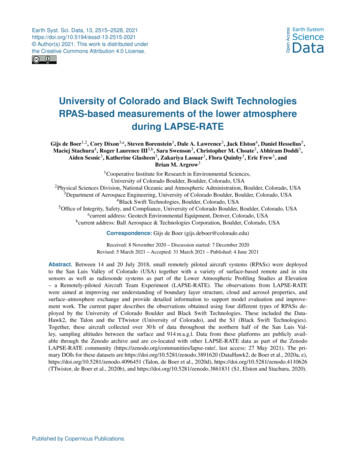
2520G. de Boer et al.: RPAS-based measurements of the lower atmosphere during LAPSE-RATEFigure 2. The flight locations for each aircraft (left) and altitudes covered by the different aircraft broken down by day (right). Map back-grounds are Google Maps 2021 and downloaded through their API.the San Luis Valley (approximately 37.86 N, 106.18 W;2326 m above mean sea level, a.m.s.l.) near the intersectionof County Road J and State Route 45 (see Fig. 3). This sitefeatured large crop circles, each having different states of irrigation and plant activity. At this site, two primary flightmodes were employed. The first of these was a basic profiling mode, where the aircraft conducted repeated verticalascents and descents while following an orbital flight track.These flights were designed to evaluate the development ofthe boundary layer and temporal evolution of its structureduring the morning hours. Profiles typically ranged betweenthe surface and 500 m above ground level (a.g.l.). In additionto these profiling flights, additional emphasis was placed onattempting to measure differences in boundary layer development over different surface types, mainly between crop circles with different amounts of plant coverage and irrigationlevels. For those flights, the aircraft were operated in a loi-Earth Syst. Sci. Data, 13, 2515–2528, 2021ter pattern over two different crop circles for extended timeperiods.With the exception of 19 July, the BST S1 was operated at the mouth of the Penitente Canyon, just to the northof the intersection between routes 38A and 40G (37.84 N,106.27 W; 2400 m a.m.s.l.) (Fig. 4). At this location, the aircraft conducted nearly continuous profiling flights betweenthe surface and approximately 800 m a.g.l. Flights were almost exclusively conducted in the morning and early afternoon (local time) hours. Flights on 19 July were conductedjust to the north of the town of Villa Grove, Colorado, off ofprivate property located off of County Road 57 at the end ofan old airstrip (38.27 N, 105.94 W; 2415 m a.m.s.l.). Theseflights included a series of stepped racetracks between twopoints situated across a valley from one another and were designed to measure density-driven cold-air drainage flow intothe main San Luis Valley. Flight altitudes for these drainage-https://doi.org/10.5194/essd-13-2515-2021
G. de Boer et al.: RPAS-based measurements of the lower atmosphere during LAPSE-RATE2521Figure 3. A histogram of altitudes covered during LAPSE-RATE by the DataHawk2 (top left), along with the flight patterns covered bythis aircraft during individual days of the campaign. See the map in Fig. 2 for additional details on flight location. Map backgrounds are Google Maps 2021 and downloaded through their API.flow flights spanned between the surface and approximately350 m a.g.l.The Talon conducted scientific flight operations on 18–19 July in two different locations, as shown in Fig. 5.Flight operations on 18 July were conducted at Leach Airport and included three profiling patterns to approximately700 m a.g.l. These flights were meant to capture temporalvariability of boundary layer structure and extend the vertical extent of the MURC measurements obtained at that location. Additionally, these flights offered an opportunity tocompare the Talon observations with those from the MURCinstrumentation tower, and some time was spent at the endof each flight operating at lower altitudes in proximity to theMURC. On 19 July, the Talon conducted six research flightsin the Saguache Canyon starting around 06:15 local time,with operators perched above the valley floor off of CountyRoad Cc36 (approximate location 38.105 N, 106.242 W).From here, the Talon was flown in a stepped racetrack pattern across the valley to the north-northeast, covering approximately 2 km of horizontal distance and transitioningbetween different altitudes at the conclusion of each racetrack to attempt to map out the spatial extent of the valleydrainage flow. This included sampling at eight different altitudes, ranging between 350 and 30 m a.g.l., with the first sixaltitudes separated by 50 m and the last one by 20 m.Finally, the TTwistor was operated in two different modesduring the LAPSE-RATE campaign, with flight illustrated in Fig. 6. On 18 July, the aircraft conductedflights in follow-me mode, where the aircraft operators arepositioned in a vehicle-based mobile ground station. Under this mode of operation, the aircraft conducted extensive horizontal transects from Leach Airport through theeastern half of the San Luis Valley. These flights includedsampling at various altitudes and were designed to document spatial variability between the more agricultural portions of the valley and the dry eastern shrubland. In total,three follow-me flights were conducted, with the earliest ofthese taking the aircraft directly south of Leach Airport, before completing an easterly transect and returning back tothe north. The second follow-me flight took the aircraft further to the east and included a north–south leg approximatelyone-fourth and three-fourths of the way through the flight.The third flight followed a similar route to the second. Ingeneral, the first half of these follow-me flights were conducted at approximately 300 m a.g.l., with the second halfconducted at approximately 120 m a.g.l. In addition, the firstflight also included a short sampling period at approximately25 m a.g.l. to foster comparison with the MURC tower. On19 July, the TTwistor operated from the western end of theSaguache airport to conduct coordinated sampling of coldair drainage in the Saguache Canyon. From there, the aircraftconducted three flights in which it stepped through altitudesbetween 45 and 270 m a.g.l. in 45 m increments, while operating in a large orbit. The large orbit was meant to captureEarth Syst. Sci. Data, 13, 2515–2528, 2021
2522G. de Boer et al.: RPAS-based measurements of the lower atmosphere during LAPSE-RATEFigure 4. A histogram of altitudes covered during LAPSE-RATE by the S1 (left), along with the flight patterns covered by this aircraftduring individual days of the campaign. See the map in Fig. 2 for additional details on flight locations. Map backgrounds are GoogleMaps 2021 and downloaded through their API.Figure 5. A histogram of altitudes covered during LAPSE-RATE by the Talon (left), along with the flight patterns covered by this aircraftduring individual days of the campaign. See the map in Fig. 2 for additional details on flight locations. Map backgrounds are GoogleMaps 2021 and downloaded through their API.Earth Syst. Sci. Data, 13, 2515–2528, 2021https://doi.org/10.5194/essd-13-2515-2021
G. de Boer et al.: RPAS-based measurements of the lower atmosphere during LAPSE-RATE2523Figure 6. A histogram of altitudes covered during LAPSE-RATE by the TTwistor (left), along with the flight patterns covered by this aircraftduring individual days of the campaign. See the map in Fig. 2 for additional details on flight locations. Map backgrounds are GoogleMaps 2021 and downloaded through their API.spatial variability of the drainage flow within the width of thecanyon, with the aircraft covering approximately one-third ofthat width in the northern portion of the valley. Flights on the19 July were initiated at around 06:00 local time (MDT) inorder to capture the most intense portions of the drainageflow, which begins to taper off with solar heating of the surface.Some of the primary measurements from these platformsand the flights conducted during LAPSE-RATE are includedin Fig. 7. These figures show similar observations from thedifferent platforms, with some notable exceptions. First, theS1 shows an influence of heating of the temperature sensorswhile the aircraft is on the ground. Because of this heating,the S1 temperature sensor provides excessive temperaturereadings for the first portion of the flight, resulting in superadiabatic lapse rates extending from the surface to around100 m altitude. This is resolved after the aircraft has beenin the air for several seconds. The DataHawk2 slow temperature sensor shows similar stru
surface-atmosphere exchange and provide detailed information to support model evaluation and improve- . hosted the annual meeting for the International So- . Knuth et al., 2013), and the use of these platforms to understand turbulence around the world, includ-ing in tropical cyclones (Cione et al., 2020). Similarly, BST