Transcription
2CHAPTER 2Principles of Flow CytometryIntroductionOver the years, flow cytometry technology, with itsmultiple applications, has had a significant impact onour understanding of cell biology, immunology andhaemopoietic ontogeny, allowing its application to thediagnostic challenges of clinical medicine.The basic principle of flow cytometry is inherent in theability to analyse multiple characteristics of a single cellwithin a heterogenous population, in a short period oftime [1, 2]. The term heterogenous is very important. Inmany clinical scenarios it might be far from clear whethera cellular proliferation is reactive or, indeed, neoplastic.Furthermore, these populations do not exist in isolationbut within a milieu of other cell types. The diversity ofdiseases afflicting the cells of the body compartmentsis vast. Clinico-pathological correlation is at the very coreof accurate diagnosis. Ignore the characteristics of either,at your peril.Modern flow cytometers have the capability to analyseseveral thousands of cells per second. Cells in suspensionpass through a beam of light (usually a laser beam) insingle file; signals generated are related to the size of thecell and the internal complexity or granularity of the cell,enabling the cytometer to identify different cell populations depending on these characteristics. There are a widerange of applications for flow cytometry in a numberof different disciplines. However, in haematology ithas become an important tool in the identification ofhaematological disorders from a wide range of diagnosticsamples, such as peripheral blood, bone marrow, CSF,pleural effusion, ascitic fluid and lymph node aspirates [1].For the analysis of solid tissue a cell suspension must firstbe made.There are many books and articles available outliningthe principles of flow cytometry in great detail [1–7].This chapter is written with the view of giving a simplified overview of flow cytometry, the gating strategies anddata analysis applied in diagnostic flow cytometry appliedto haematological disorders. It is aimed at laboratory staffand junior medical staff, and even more senior staff whohave not had the privilege to experience clinical flowcytometry in all its diagnostic applications.Sample preparationAt the outset we begin with a sample, usually of bloodor bone marrow. We need to interrogate the cells in thesample as to their nature by determining their surface,cytoplasmic or nuclear immunophenotypic characteristics. As an example (clearly sample management will varyfrom one institution to another) the following is a simplified version of a sample preparation for flow analysis inour institution.Direct staining method for surfaceimmunophenotyping of peripheralblood or bone marrow (lyse – nowash method)1 If sample white cell count is normal, sample may be usedundiluted. If white cell count is raised, dilute sample inphosphate-buffered saline (PBS) to within normal value.(For example, if WBC twice normal then dilute 1:2.)2 Label FACS tubes with sample ID and antibodycombinations according to panel being run.3 Add sample (100 μl) to required number of tubes.Practical Flow Cytometry in Haematology Diagnosis, First Edition. Mike Leach, Mark Drummond and Allyson Doig. 2013 John Wiley & Sons, Ltd. Published 2013 by John Wiley & Sons, Ltd.3
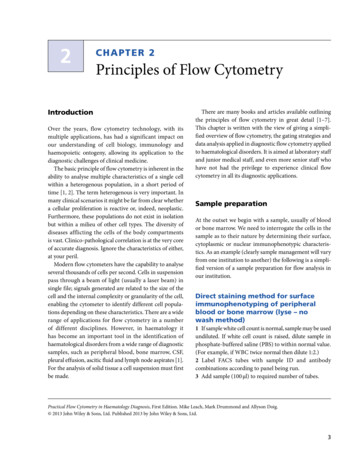
4C H APTER 24 Add antibody conjugates to sample in volumes asrecommended by manufacturer and mix.5 Incubate at room temperature for 20–30 min in the dark.6 Add appropriate volume of ammonium chlorideRBC lysing solution and vortex.7 Allow to lyse for 10 min.8 Analyse on flow cytometer.Surface immunoglobulin staining1 Adjust sample white cell count to within normal limitsif it is raised.2 Add 100 μl sample to FACS tube.3 Wash 3 in warm (37 C) PBS to remove excess proteins from the sample.4 Continue with surface staining as previously described.Intracellular Staining1 Carry out surface staining as described in steps 1–5above, if required.2 Wash 1 in warm (37 C) PBS.3 Using Fix and Perm Cell permeabilization reagentsadd 100 μl Reagent A (fixing reagent) and incubate for15 min.4 Wash 1 in warm (37 C) PBS, centrifuge for 5 min at300–500 g.5 Add 100 μl Reagent B (permeabilizing reagent) andappropriate volume of antibody conjugate.6 Incubate 20–30 min in the darkFlow celleath fluidSh7 Add appropriate volume of ammonium chlorideRBC lysing solution and vortex.8 Allow to lyse for 10 min.9 Analyse on flow cytometer.PBS; phosphate buffered saline, RBC; red blood cell solution.The flow cytometerThere are three main components to the flow cytometer [8]:1 The Fluidics SystemPresentation of the sample to the laser.2 The Optical SystemGathering information from the scattered light of theanalysis.3 The Computer/Electronic SystemConversion of optical to digital signals for display.The fluidic systemThe aim of the fluidics system is to present cells (or particles) in suspension to the laser interrogation point (thepoint at which cells pass through the laser light beam)one cell at a time. This is achieved by a process knownas ‘hydrodynamic focusing’ (Figure 2.1). In the flow cell(flow chamber) the sample stream is injected into a fastermoving stream of sheath fluid (usually phosphate bufferedsaline). Differences in the pressure, velocity and density ofHydrodynamically focusedsample core streamInterrogationpointLasersSamplecoreFlow cellSample injection tubeSheath fluidSampleFigure 2.1 Hydrodynamic focusing and interrogation point. The sample core is a narrow coaxial stream (stream within a stream) surroundedby a wider stream of sheath fluid. The shape of the flow cell helps minimize turbulence while ensuring the sample core is focused in thecentre of the stream for presentation to the laser. Courtesy of Becton Dickinson.
5Principles of Flow CytometryLow sample pressurelow flow rateHigh sample pressurehigh flow rateCollection opticsArray ofdetectorsand filters530/30488/10Filters505/42661/16670 LPCollection lens488/10LaserLaserExcitation opticsSheathSheathSampleSheathSheathSampleFigure 2.2 Flow rate and sample pressure. Low flow rate low samplepressure narrow sample stream cells pass beam in single file. Highflow rate high sample pressure wider sample stream more than onecell passes through the beam at a time. Courtesy of Becton Dickinson.the two fluids prevent them from mixing. The flow cell isdesigned so that at the laser interrogation point the twostreams are under pressure, focusing the sample stream inthe centre of the sheath fluid, forcing the cells into singlefile before passing through the laser beam [3, 5, 6, 8].Sample pressure is always greater than the sheathpressure. Altering the rate at which the cell suspensionis injected into the centre of the sheath fluid will have adirect effect on the width of the sample stream and thenumber of cells passing through the interrogation point.The higher the sample pressure the wider the coaxial stream,resulting in more cells passing the interrogation point in aless than optimal position. By lowering the sample pressurethis narrows the coaxial stream, resulting in cells passing theinterrogation point in single file (Figure 2.2).It is important that the correct flow rate is applied for theapplication being used. For immunophenotyping, measurements can be acquired quickly and therefore a high flowrate can be applied. DNA analysis, for example, requires amuch higher resolution so a narrow sample core is necessary to ensure single cells pass through the laser beam atany given time; here a low flow rate should be applied.The optical systemThe optical system of the flow cytometer comprises excitation optics and collection optics. The excitation optics areLensFSC diodeFlow cellSample coreFigure 2.3 Example of the optical bench in the FACSCalibur flowcytometer. Courtesy of Becton Dickinson.made up of the laser with focusing lenses and prisms, whilstthe collection optics lenses, mirrors and filters all gatherand direct the scattered light to specific optical detectors(Figure 2.3). The intercept point of laser light and cells mustbe constant so the laser is held in a fixed position.Light scatterAs a cell passes through the interrogation point, light fromthe laser beam is scattered in forward and 90º angles. Theamount of light scattered is dependent on the physicalproperties of the cell, such as, cell size, nuclear complexityand cytoplasmic granularity. These light scattering signalsare gathered by specific detectors, converted to digitalsignals and finally displayed as dot plots for analysis.Light diffracted at narrow angles to the laser beam iscalled forward scattered light (FSC) or forward angle lightscatter (FALS). The amount of FSC is proportional to thesurface area or size of the cell. The forward scattered light iscollected by a detector placed in line with the laser beam onthe opposite side of the sample stream. Some light will passthrough the cell membrane and is refracted and reflectedby cytoplasmic organelles or nucleus of the cell. This lightis collected by a photodiode positioned at approximately90º to the laser beam and is known as side scattered light(SSC). Side scattered light is proportional to the granularityor internal complexity of the cell (Figure 2.4).Together, FSC and SSC signals provide information onthe physical properties of the cells allowing differentiationof cells within a heterogeneous population, for examplethe differentiation of white blood cells (Figure 2.5).
6C H APTER 2Side scatter detectorLight sourceForward scatterdetectorFigure 2.4 Simple illustration of forward and side light scatter properties of a cell. Courtesy of Becton Dickinson.Forward scatter (FSC)Blast gateateSmall lymphocytesLarge lymphocytesMonocytesNeutrophilsEosinophilsMyeloid precursorsLarge cells? blastsSide scatter (SSC)Figure 2.5 Schematic diagram of differentiation of peripheral blood leucocytes according to forward and side scatter characteristics.FluorescenceThe forward and side scatter light signals are emitted ata 488 nm wavelength and are of the same colour as thelaser light [3]. These signals can therefore be determinedwithout the need for a dedicated fluorescent probe.To determine the specific biochemical properties ofa cell, dyes that can bind directly to the cell or fluorochromes that are bound to ligands, for example monoclonal antibodies, are used. The dyes or fluorochromes areexcited by light of a wavelength that is characteristic forthat molecule. It will absorb the light, gaining energy,resulting in the excitation of electrons within the molecule;on returning to its unexcited state this excess energy isreleased as photons of light resulting in fluorescence.The wavelength range at which a fluorochrome absorbslight and becomes excited is known as its excitation(or absorption) wavelength. The wavelength range ofthe emitted light is termed its emission wavelength. Theemitted wavelength range will be longer than that of theabsorption wavelength range; this difference is referred
7Principles of Flow Cytometryto as Stoke’s Shift [5] (Figure 2.6). As laser light is of afixed wavelength, it is essential that the fluorochromes ordyes to be used have excitation wavelengths compatiblewith the flow cytometer (Table 2.1).If a fluorochrome or dye can be excited sufficientlyby light of a specific wavelength and their emissionwavelengths are sufficiently different from one another,more than one fluorescent compound may be used at onetime. However, if the flow cytometer uses only a singleStoke’s shiftlaser then the absorption spectrum of each fluorochromewould have to be similar.In the flow cytometer the fluorescent signals arecollected by photomultiplier tubes. To optimize thesesignals, optical filters specific to a wavelength range areplaced in front of the photomultiplier, allowing only anarrow range of wavelength to reach the detector. Theseare as follows: bandpass (BP) filters which transmitlight within a specified wavelength range (Figure 2.7)(a)Reflect light wavelengthsshorter than 475 nmAbsorption spectrumEmission spectrumTransmit light centred aroundthe first value, within the rangespecified by the second value500/50Transmit wavelengths oflight within 500 25 nmWavelengthFigure 2.6 Stoke’s shift. Courtesy of Becton Dickinson.(b)Table 2.1 Maximum excitation and emission wavelengths for someof the common fluorochromes used in flow cytometry.FluorochromeAbbreviationCascade blue380, 401419Cascade yellow399549Pacific blue410455Alexa oerythrin*PE496, 546578Texas red*ECD595615PE-cyanine 5*PC5/PE-Cy5496, 546667PE-cyanine 5.5*PC5.5/PE-Cy5.5 495, 564696PE-cyanine 7*PC7/PE-Cy7495, 564767Peridinin-chlorophyll* PerCP482678PerCP-cyanine yanine 7APC-Cy7650785(*most commonly used).Reflect light wavelengthsshorter than 475 nmExcitation Emissonmax (nm) max (nm)Transmit light that is equal toor shorter than the specifiedwavelength500 SP(c)Reflect light wavelengthsthat are not transmittedTransmit light that is equal toor longer than the specifiedwavelength500 LPFigure 2.7 Bandpass filters allowing only specific wavelengths offluorescence to pass through. Courtesy of Becton Dickinson.
8The brightness or fluorescence intensity of any capturedevent for a particular fluorochrome is recorded by thecytometer for that channel. When many events have beencaptured it is possible to derive a mean fluorescence value;this is known as the mean fluorescence intensity (MFI)and is a very important characteristic that should beassessed in routine diagnostic practice (Figure 2.8a). Itrelates to not only the presence of the relevant antigen,but also the strength of expression or integrity of thatantigen in a given cell population. It can carry great significance when used in the differentiation of neoplasticfrom reactive and normal cell populations. Fluorescenceintensity can also be used to identify dual populations andallow subsequent directed gating strategies (Figure 2.8b).Some cell populations can show a spectrum of expressionof a given antigen, for example CD13 expression in acutemyeloid leukaemia, so care has to be used when usingMFI data without paying attention to the plot(Figure 2.8c). These patterns of expression can be important in diagnosis.It is clearly important to maintain consistency influorescence intensity data, both on a single cytometerover time and between different cytometers in the samelaboratory. The means of achieving this are explained inthe calibration section below.105Mean fluorescenceintensity (MFI)104CD 20Fluorescence intensity(a)103CD 2(b)105MFI population A104MFI population BCD 20(a); shortpass (SP) filters (b) which transmit light withwavelengths equal to or shorter than specified; longpass(LP) filters (c) which transmit light with wavelengthsequal to or longer than specified.C H APTER 2103CD 2(c)105Spectral overlap104MFICD13Although a detector is designed to collect fluorescencefrom a specific wavelength, the emission spectra for agiven fluorochrome can cover a range of wavelengths,allowing fluorescence spill over to a detector designedfor a different fluorochrome. This is referred to as spectral overlap (Figure 2.9). For accurate analysis of data,the spectral overlap between fluorochromes must becorrected. This correction is done by compensation(Figure 2.10). In simple terms, compensation is carriedout by correcting for inappropriate signals generated bythe fluorochrome responsible for the overlap. With theuse of compensation controls, this can be correctedmanually and visually set, so minimizing interferencefrom this phenomenon. However, when using ionFigure 2.8 (a) Deriving a CD20 MFI value for a B-cell populationin blood. (b) Differences in CD20 MFI values for two differentB-cell populations in blood can assist in diagnosis. (c) In additionto MFI, the spectrum of fluorescence intensity for a given antigenis important. Here, although the MFI is the same for the twomyeloid populations, the variation in intensity (heterogenousversus homogenous expression) is different and is valuable indiagnosis.
9Principles of Flow CytometryFluorescence intensity488 nmFITCPESpectral overlapWavelengthPhycoerythrin (PE)Figure 2.9 Spectral overlap – the emission wavelengths of FITCand PE overlap. In order to ensure accuracy, compensation hasto be applied to subtract the overlapping signals. The highwavelength emissions from FITC will be captured by the PE detectorand vice versa. If compensation is not applied then inappropriate dualpositive events (Q2) will be captured. Courtesy of Becton Dickinson.Q1Q2Q3Q4Fluorescein isothiocyanate (FITC)Figure 2.10 Compensation for spectral overlap of fluorochromes.Schematic diagram: this illustrates that the mean fluorescenceintensity (MFI) for each fluorochrome should be equivalent for bothpositive and negative events so compensating for spectral overlap.fluorochromes in modern flow cytometers this process ismuch more difficult to carry out manually. Therefore,current four and six colour flow cytometers usually havea software programme to aid with this potentially complex compensation set up process (Figure 2.11).The electronic systemThe electronic system of the flow cytometer allows thelight signals to be converted into numerical data foranalysis. As light hits the photodetectors, the incomingphotons are converted to electrons, resulting in a current[3, 7, 8]. This current passes through an amplifier anda voltage pulse is generated that is proportional to thenumber of photons detected. The voltage pulse is createdas soon as a cell or particle passes through the laser beam,with its highest point achieved when the cell or particle isin the centre of the beam (Figure 2.12).Two types of photodetectors are used, termed photodiodes and photomultiplier tubes (PMTs). Photodiodes areless efficient with lower sensitivity than PMTs and generally used to collect the forward light scatter which produces a strong signal. Photomultiplier tubes are veryefficient and used to collect the weaker side scatter andfluorescent signals. By applying a voltage to the photodetectors the electrical signals can be amplified. For theamplified signals to be displayed by the computer foranalysis they require to be digitized. A numerical value isgenerated for the pulse height, width and area, andassigned a channel number by the analogue-to-digitalconvertor (ADC). The channel number is then transferred to the computer and displayed as a point on ananalysis plot. The signals can be applied linearly or logarithmically for analysis (Figure 2.13).ThresholdWhenever a particle or cell passes through the laserbeam a voltage pulse is generated. To prevent interferencefrom background noise or debris, a threshold can be set.By setting a threshold signal value, processing only occurswhen a voltage pulse signal is above this limit. Signalsbelow threshold are not processed (Figure 2.14). It isimportant to set the threshold limit so that the highestnumbers of cells of interest are detected: if the thresholdlimit is set too low or too high there is the risk that cells ofinterest are missed [9].Data displayOnce signals have been assigned channel numbers thecomputer processes and stores these values. Once storedthe data is saved in a standard format developed by theSociety for Analytical Cytology [10]. These files of rawdata are generally referred to as ‘listmode files’. The storeddata files can then be displayed in a number of waysdepending on the analysis software application and reanalysed over and over again. The most common data displaysfor analysis in immunophenotyping are described below.
(b)Q2105Q1Q2Q3Q4PE-A104Q11031030Q4Q3–1650 E-A104105(a)522–445 –10 0 7010PE-A3104105(c)Q4Q3–1620 631,6104105PE-AMean12,3992,598238483Figure 2.11 Compensation for spectral overlap of fluorochromes:illustrating a worked example.events downward and the MFI values are different. If this is notcorrected dual positive population may be missed.(a) Correct compensationAccurate compensation allows for spectral overlap and generatesdiscrete cell populations with equivalent MFI for both FITC (greenvalues) and PE (red values) channels.(c) Under compensationThis encourages populations to be pulled up the axis for theopposing fluorochrome – too little subtraction collapses/skewsthe events upward and the MFI values are different. This maylead to false dual positivity being reported.(b) Over compensationThis encourages populations to be pulled down the axis for therelevant fluorochrome – too much subtraction collapses/skews the
11Principles of Flow CytometryHistogramLaserThe histogram represents a single dimension and is usedfor displaying a single parameter. The Y axis shows thenumber of events counted and the X axis shows the fluorescence intensity in Figure 2.15(a).Voltage(a)TimeDot plotVoltage(b)LaserTimeVoltage(c)LaserTimeFigure 2.12 (a) The cell enters the laser beam and the voltage pulseis created. (b) The pulse reaches its peak as the cell is in the centreof the beam. (c) The pulse returns to baseline as the cell has leftthe 50100FSC-AGranulocytes200Granulocytes250( 1,000)250(b)200( 1,000)(a)The dot plot is used to display two parameters where eachdot represents a cell/particle. The stronger the signal thefurther along each scale the data is displayed. The forwardversus side scatter plot is a frequently used dot plot forperipheral blood analysis and subsequent gating as inFigure 2.15(b). Forward scatter correlates with cell size andnuclear/cytoplasmic complexity, whereas side scatter correlates with cytoplasmic granularity as noted in Figure 2.5.Other plots for displaying data are density and contourplots but these are less commonly used. Both display twoparameters but provide a third dimension and are able toquantify and give a visual representation of multipleevents occurring in the same zone of the plot. The contour plot joins x and y coordinates with similar eventcounts and looks similar to a topographical map. Densityand contour plots are not generally used for routineanalysis but mainly used for displaying data in publications(Figure 200250( 1,000)Figure 2.13 Leucocyte differentiation from FSC and SSC signals. (a) Dot plot using logarithmic scale. (b) Display using linear scale.Courtesy of Becton Dickinson.
12VoltageC H APTER 2ThresholdFigure 2.14 The principle of setting a threshold voltage. Courtesyof Becton Dickinson.050100P1150FSC-A200Count10 20 30 40 50 60 70 80 90250(b)( 1,000)(a)GatingGating refers to the ability to isolate single populations ofinterest within a heterogeneous sample. As flow cytometers are capable of analysing thousands of cells per second,gating allows analysis to be restricted to a subpopulationof cells without having to isolate them from a mixed sample prior to analysis [5]. As previously shown in Figure 2.5,subpopulations of leucocytes can be identified according–1650 102103104CD2 0( 1,000)25015050100FSC-A200( 1,000)(c)102103SSC-A104105102103SSC-AFigure 2.15 (a) Histogram plot showing CD2 expression of peripheral blood lymphocytes. (b) Dot plot using a forward scatter (FSC) versusside scatter (SSC) analysis. (c) Contour plot (left) and density plot (right) of the same forward scatter (FSC) versus side scatter (SSC) analysis.
13105Q2CD19CD19 19Q2Q3CD2–770050FSC-A100 150( 1,000)200 250Principles of Flow CytometryCD2Q3–1560 102103104CD2 FITC-A105% Parent9.00.319.771.1Figure 2.16 A FSC/SCC plot showing gate around lymphocytes and a dot plot showing only parameters related to the gated region.to their light scatter properties. If left ungated, then nonspecific fluorescence from monocytes and neutrophilswill be seen on the analysis plot. However, by drawing agate (or region) around the lymphocyte population thefluorescent properties of only lymphocytes can be displayed, making analysis much more specific (Figure 2.16).The orientation of populations of cells in a FSC versusSSC light scatter plot is the simplest method for gating.It has the advantage that dead cells or debris can beexcluded from the analysis but the disadvantage of beingunable to discriminate between cells with similar lightscatter properties.Lack of discrimination according to light scatterbehaviour can be overcome by ‘back gating’. This is astrategy that can be used to identify a population ofcells for analysis while excluding contamination byother cell populations, for example monocytes beingincluded in the lymphocyte gate. This was firstdescribed in 1990 [11]: by staining cells with CD45 (allnormal leucocytes are CD45 ) and CD14, (monocytesare CD14 , lymphocytes CD14–) a dual parameter dotplot of CD45 versus CD14 is created. By drawing a gatearound the brightest CD45 CD14– populations it isthen possible to identify the lymphocytes with minimalmonocyte contamination (Figure 2.17).With the introduction of more monoclonal antibodiesin multiparameter flow cytometry it has become com-mon to use specific cell surface antigen expression as agating parameter as a means of identifying the cells ofinterest within a heterogeneous population. By usingfluorescence along with side scatter as a gating parameter this can provide the interpreter with a specific phenotype of these cells. For example, if CD19 was used toisolate B lymphocytes from the T lymphocytes theresulting information would only be relevant to theB-lymphocyte population within the sample. This sameprinciple can be applied to identifying blasts within aleukaemic sample (Figure 2.18).Another common gating strategy utilizes CD45 asthe fluorescent parameter. CD45 is a common surfaceantigen expressed on leucocytes with differing levels offluorescence intensity, but is not expressed by erythroidor non-haematological cells. Lymphocytes can be easilyidentified by their higher CD45 staining intensity thanthat of monocytes and granulocytes. Due to this difference in fluorescence intensity between cell types, alongwith side scatter properties, CD45 can be a useful gatingparameter for identifying leucocytes of different lineagesand degrees of maturation [12] (Figure 2.19).It is possible to apply multiple gates; several sequentialgates can be set on different parameters and analysedsimultaneously. In the clinical setting examples of thisinclude the enumeration of CD34 cells in peripheralblood or peripheral blood stem cell collections, and
105CD14 FITC-A103104104103SSC-AP1105102103104105CD45 PerCP-Cy5-5-A( 1,000)200 250102DFSC-A100 150CP25050FSC-A100 150( 1,000)200 250B10250FSC-A100 150( 1,000)200250A103104SSC-A105102105102105ECD14 104CD14 CD45 103–183 0 102CD14 FITC-A103104SSC-APopulation% Parent0.0CD14 CD14 CD45 0.30.7Q3–399.0CD45 CD45 Q3–3–122102103104105CD45 PerCP-Cy5-5-AFigure 2.17 Back gating strategy (according to [11]). Plot Ashows useful but incomplete separation of peripheral bloodleucocytes on the FSC versus SSC plot. Plot B shows the clearidentification of lymphocytes in population P1 (CD45bright CD14–).Plot C shows back gating of the P1 lymphocytes indicating wherethey reside in the original FSC versus SSC plot. Plot D showssubsequent gating on these lymphocytes in population P2.Plot E shows subsequent CD45 and CD14 analysis showing avirtually pure lymphocyte population with minimal monocyte(0.3%) contamination.
15105CD34 positive cellsCD34 APC-A103104CD19 APC-A103104105Principles of Flow Cytometry102102CD19 positive cells102103104105SSC-A102103104105SSC-AFigure 2.18 Illustration of gating strategy using fluorescence versus SSC to isolate the cells of interest. B lymphocytes are identified usingCD19 (left) whilst CD34 (right) is used to identify blasts.103DimCD oblastsNucleated Erythroid CellsNegFigure 2.19 CD45 plot leucocyte lineageand maturation.CD4 helper T-cell numbers from the total T-lymphocytepopulation [13, 14] (Figure 2.20).Instrument set-up and quality controlTo ensure the accuracy and precision of the data generated,particularly in the clinical laboratory, the performance ofthe flow cytometer must be rigorously monitored andcontrolled. Although most instrument calibration is carried out during installation, it is good laboratory practicefor the flow lab to establish a robust internal qualitySide scattercontrol (IQC) programme. This will ensure that the flowcytometer performs to its expected standard. This can bedone through the use of commercial standards and control materials. The term ‘standard’ usually refers to a suspension of microbeads/particles which do not requirefurther preparation and are generally used to set up orcalibrate the instrument. Control material is different inthat they are usually analytes, for example fixed wholeblood cells that have pre-determined values and requirepreparation in a similar way to patient samples [15].
16( 1,000)200250( 1,000)200250C H APTER 2SSC-A100150SSC-A1001505050P1P2103104CD45 FITC-A105102( 1,000)200250102103104CD34 PE-A105Tube: 1SSC-A100150PopulationAll eventsP1P2P350P3102103104CD45 FITC-A105Figure 2.20 Simplified example of sequential gating used inthe ISHAGE protocol for absolute CD34 enumeration. A plotdisplaying SSC versus CD45 FITC fluorescence has a gate P1 drawnaround all positive cells excluding noise/debris. Everything within P1 isdisplayed on a second plot, SSC versus anti-CD34 PE. A gate is drawnaround the positive cells in gate P2 which in turn are displayed onanother SSC versus CD45 FITC and a gate drawn around the dis
flow rate high sample pressure wider sample stream more than one cell passes through the beam at a time. Courtesy of Becton Dickinson. Figure 2.3 Example of the optical bench in the FACSCalibur flow cytometer. Courtesy of Becton Dickinson. Array of detectors and filters Collection optics Collection lens Filters 530/30 488/10 488/10 505/42 .