Transcription
Higher Education inColorado: Our challengeUniversity of Colorado Excellence inLeadership Program – September 12, 2014
Framework for our discussion Agendao Leadership Concepts Context and Curiosity The Choice to Exercise Leadershipo Colorado’s Higher Ed Challengeo Discussion
Colorado’s higher ed challenge Experts project that by 2020, 74 percent of jobs in Colorado will requirepostsecondary education or training. Yet out of 100 ninth-graders in Colorado today, only 50 go to college andonly 22 earn a degree. The gap for minorities is far worse. By 2015, Hispanic students areexpected to make up more than a quarter of our public high schoolgraduates. Yet, among all ethnic groups, Hispanics are least likely to havea college credential (18 percent of Hispanic adults vs. 53 percent of whiteadults). Colorado Paradox – how do we solve it?
Degree attainment gapAccess without support is not opportunity-Dr. Vincent Tinto
Future growth in collegeenrollment
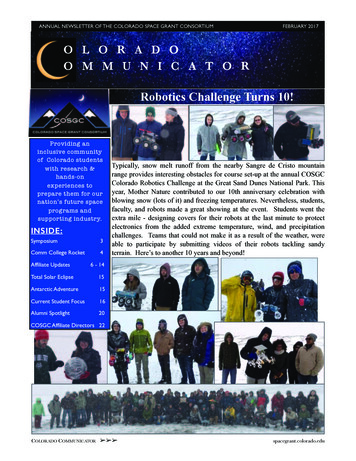
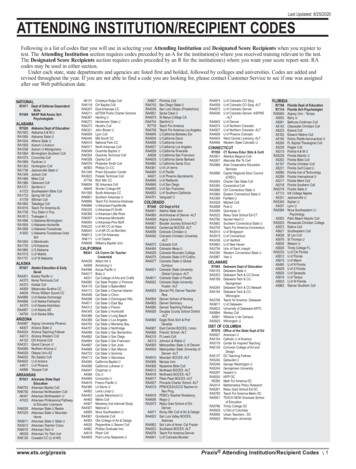
CCHE Master Plan: By 2025, 66% of theState’s citizens will hold a degree orcredential (annual increase of 1,000 degrees and certificates)Goal 1: Increasing Attainment: Increase the attainment of high-qualitypostsecondary credentials across the academic disciplines andthroughout Colorado by at least 1,000 new degrees and certificateseach year to meet anticipated workforce demands by 2025.Annual Degrees Awarded51,35252000Goal 2: Improving Student Success: Improve student success throughbetter outcomes in basic skills education, enhanced student supportservices and reduced average time to credential for all students.510005000048,3744900048000Goal 3: Reducing Gaps: Enhance access to, and through, postsecondaryeducation to ensure that the system reflects the changingdemographics of the state while reducing attainment gaps amongstudents from underserved communities.4700045,76346000450004400043000Goal 4: Restoring Fiscal Balance: Develop resources, through increasesin state funding, that will allow public institutions of higher educationto meet projected enrollment demands while promoting affordability,accessibility and efficiency.420002010-112011-122012-13
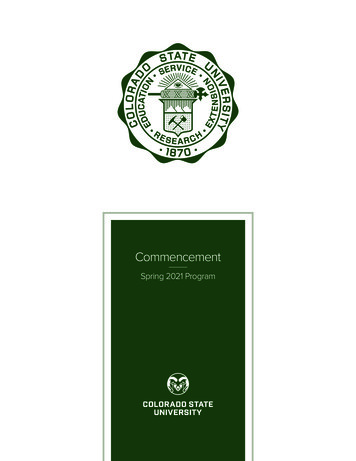
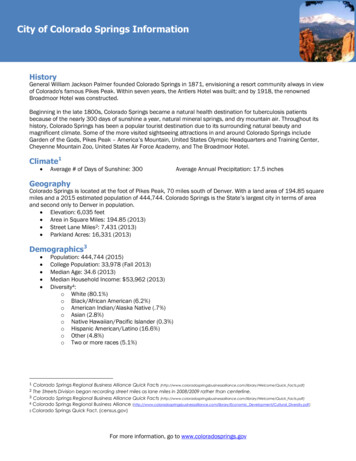
Colorado’s budget challengeMajor Components of General Fund Spending, FY 2014-15Other18.3%Corrections7.3%Higher Ed7.7%Medicaid22.9%Source: Colorado Office of State Planning and BudgetK-12 Budget43.7%
Colorado’s budget 30%20%10%0%FY 82K-12FY 92MedicaidSource: Colorado Office of State Planning and BudgetFY 02Higher EdCorrectionsFY 15Other
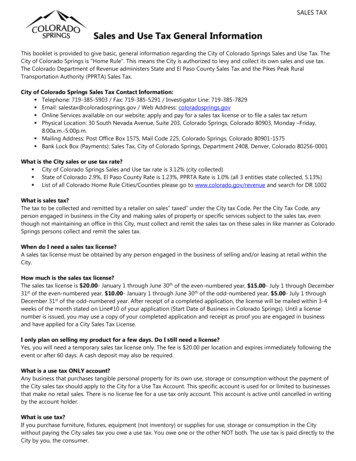
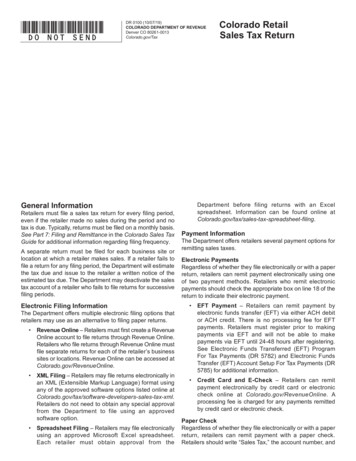
AlaskaWyomingHawaiiIllinoisNew YorkConnecticutNew MexicoNorth CarolinaNebraskaCaliforniaNorth DakotaMassachusettsMarylandGeorgiaNevadaNew ssippiArizonaIndianaLouisianaWashingtonWest VirginiaAlabamaRhode IslandMinnesotaMichiganSouth DakotaOhioVirginiaMontanaFloridaPennsylvaniaSouth CarolinaOregonColoradoVermontNew Hampshireth47Colorado ranksin theNation in state investmentEducational Appropriations per FTE, FY 2013 18,000 16,000 14,000 12,000 10,000 8,000 6,000 4,000 2,000Source: SHEEO, State Higher Education Finance Report, FY 2013
The State’s budget impact onInstitutions of Higher Education 6,000 706 700 600 500 653 602 555 0 4,302 0 4,622 151 4,858 706 382 644 29 4,431 3,928 519 602 653 200 3,221 615 555 5,000 544 4,000 3,914 3,118 555 521 3,852 400 300 605 519 521 3,459 544 3,000 605 324 2,000 1,000 100 0 -General FundSource: Colorado Dept. of Higher EducationARRATotalState Funding per Resident Student FTEState Funding per Resident Student FTETotal State and ARRA Funding (in Millions) 800
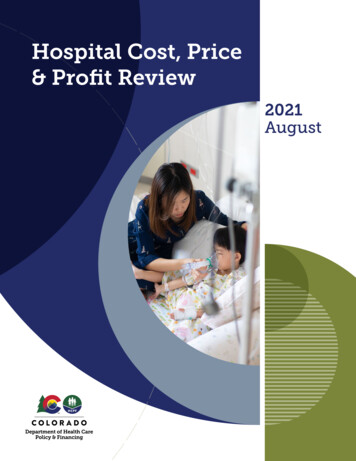
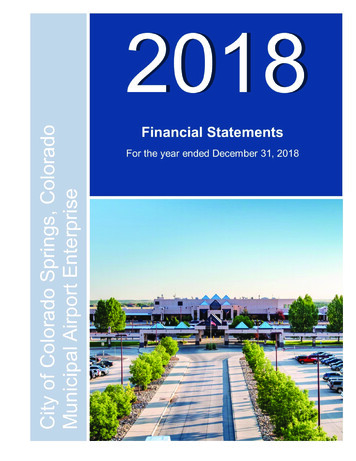
The State’s budget impact onstudents and familiesAverage Resident Student's Share of College 9,83280%70%(Tuition vs. State Funding)All Governing Boards(adjusted for inflation in 2014 dollars) 11,563 6,655 7,60868%66%60%50%40%30%20%34%32% 3,954 3,177Fiscal YearStudent Share (Resident Tuition)Source: Colorado Dept. of Higher EducationState Share (General Fund)
DelawareAlaskaVermontConnecticutRhode IslandWyomingMichiganHawaiiIllinoisNew JerseyMaineNorth DakotaPennsylvaniaMarylandNew YorkIowaAlabamaNebraskaMinnesotaMassachusettsNew HampshireSouth DakotaIndianaOhioVirginiaKentuckySouth CarolinaUSNorth CarolinaNew issouriOklahomaTennesseeTexasWest LouisianaArkansasMississippiFloridaWhen the contribution fromstudents is included, Coloradothis ranked 34 25,000 20,000 15,000 10,000 5,000 -State Appropriations per FTESource: SHEEO, State Higher Education Finance Report, FY 2013Net Tuition per FTE
landPennsylvaniaWest labamaIllinoisMissouriNorth DakotaMichiganNew YorkNew JerseyKentuckyNew HampshireIdahoMississippiSouth CarolinaVirginiaIowaMassachusettsVermontRhode IslandSouth DakotaIndianaNorth CarolinaMontanaConnecticutMaineNew MexicoOhioHawaiiDelawareAlaskaColorado is the mostproductive higher educationsystem in the nationCredentials and Degrees Awarded per 100,000 of State, Local, and Tuition and FeeRevenues54.543.532.521.510.5Source: National Center for Higher Education Management Systems.
FY 14-15 Historic Investment 100 million increase in Operating and Financial Aid 60 million Operating Funding11% increase in operating across all Governing Boards6% cap on tuition 40 million State Financial AidUniversity of Colorado - Boulder : 2.4mUniversity of Colorado - Colorado Springs - 1.8m, 3.5mUniversity of Colorado - Denver: 3.6m 112 million one-time Capital Construction and Controlled Maintenance 96.6m Capital ConstructionUniversity of Colorado - Colorado Springs - 13.3mUniversity of Colorado - Denver: 7.3m 15.9m Controlled MaintenanceUniversity of Colorado - Boulder : 1.8mUniversity of Colorado - Denver: 0.8m
Affordability: 6% Tuition CapPercent Change in Resident Tuition, FY 2013-14 to FY 2014-15(Based on 30 Credit Hours)InstitutionUniversity of Colorado - BoulderUniversity of Colorado - Colorado SpringsUniversity of Colorado - DenverColorado State UniversityColorado State University – PuebloFort Lewis CollegeUniversity of Northern ColoradoAdams State UniversityColorado Mesa UniversityMetropolitan State University of DenverWestern State Colorado UniversityColorado School of MinesAims Community CollegeColorado Mountain CollegeColorado Community College SystemPercent 2.7%0.0%1.8%4.5%Note: Calculation is based on tuition figures considered "Base Tuition Rates" (30 credit hours) and do not include tuition differentials, etc. Studentfees are not included.
What does the future hold?Source: Colorado Futures Center, Colorado State University
The questionHow do we get more people – especially those from the mostrapidly growing demographic groups – to attain high qualitypostsecondary credentials to meet future workforce needs asthe cost of attending college continues to rise?
The State’s Focus on Access,Affordability and CompletionConcurrentEnrollmentCOSIClosing theAttainmentGapRole andMissionGEAR upCollege inColoradoCOFStipendPerformanceGuidedPathwaysto SuccessHB 14-1319: Outcomes-based FundingProject for Higher Education
We are not aloneNational efforts to change the conversation: How do we create a new compact between the State andPublic Higher Education? How do we develop trust? What are we doing that diminishes trust? How do we use each opportunity given to us to re-establishthe public good of higher education and more deeplydevelop trust with policy makers, students, and the public?
Discussion: Colorado’s highereducation challenge What could you do differently? What could your campus do differently? What could the state do differently?
Questions
Colorado's higher ed challenge Experts project that by 2020, 74 percent of jobs in Colorado will require postsecondary education or training. Yet out of 100 ninth-graders in Colorado today, only 50 go to college and only 22 earn a degree. The gap for minorities is far worse. By 2015, Hispanic students are