Transcription
12020WIND AND WAVE CONDITIONS – GUYSBOROUGH –REFERENCE SITE 2Prepared by:Meysam Karimi, PhD, Dean Steinke, P.Eng.Dynamic Systems Analysis27 Parker Street · Dartmouth, Nova Scotia · B2Y 4T5CMAR.CACMAR.CA
TitleWind and Wave Conditions – Guysborough –Reference Site 2DSA DocumentReport-DSA-CMAR-19EXM-Guysborough Reference Site 2 Wind and WaveConditions RevB.0.docxBMeysam Karimi, Ph.D.Dean Steinke, P.Eng.CMARN/ARevisionAuthorCo-authorsPrepared forClient reference /projectDSA projectLast revisedPages (incl. Grove Br)CMAR-19EXM2020-10-1925DSA Pacific Office201-754 Broughton StVictoria, BC V8W 1E1 1.250.483.7207DSA Atlantic office210 – 3600 Kempt RoadHalifax, NS B3K 4X8 1.902.407.3722info@dsaocean.comwww.dsaocean.com
TitleRevisionDSA ProjectWind and Wave Conditions – Guysborough – Reference Site 2BDate Last Revised2020-10-19CMAR-19EXMClient Project /N/AReferenceRevision historyRevisionDatelastrevisedSummary of changes /CommentsRevisionsbyCheckedbyApprovedfor releasebyIssued to /DistributionA202010-09202010-19Report DraftMEKDMSDMSCMAREngineeringreviewstatus (IFI /IFR / IFC)IFRCMAR commentsapplied; Approved forpublic releaseMEKDMSDMSCMARIFRBList of authors / reviewersInitialsMEKDMSNameMeysam Karimi, Ph.D.Dean M. Steinke, P.Eng.Engineering Review Status AcronymsIFI – Issued for informationIFR – Issued for reviewIFC – Issued for constructionwww.dsaocean.comDynamic Systems Analysis Ltd. 2020Page 2 of 25
TitleRevisionDSA ProjectWind and Wave Conditions – Guysborough – Reference Site 2BDate Last Revised2020-10-19CMAR-19EXMClient Project /N/AReferenceExecutive SummaryIn support of Centre for Marine Applied Research (CMAR), the following report presents wind and waveconditions at one reference location at Dover Bay in Guysborough County, Nova Scotia, Canada.In this report, wave and wind conditions are presented for the location: Guysborough - Reference Site 2: 45 14.653'N, 61 1.057'W.To determine the wave field evolution closer to shore at a specific site, and to determine more accurate10- and 50- year return period wave data, near shore wave modelling can be used. For the GuysboroughReference Site 2, STWave was used to model the wave conditions inside the area. The results showedreduced wave heights, in comparison to the hindcast source point which is located at the southeastentrance to the Dover Bay, due to depth induced energy dissipation (bottom friction, breaking). TheSTWave model results are determined using wind and wave boundary condition data from the MSC50HindCast model of a nearby offshore location. The extreme wave conditions at the reference location isdetermined in part by propagating wave from the offshore hindcast model location into the site ofinterest.www.dsaocean.comDynamic Systems Analysis Ltd. 2020Page 3 of 25
TitleRevisionDSA ProjectWind and Wave Conditions – Guysborough – Reference Site 2BDate Last Revised2020-10-19CMAR-19EXMClient Project /N/AReferenceContentsRevision history . 2List of authors / reviewers . 2Executive Summary. 3Contents . 4Figures . 4Tables . 51Introduction . 61.1Overview . 61.2Objective(s) . 72Abbreviations and acronyms . 83Reference documents and drawings . 84Wave conditions . 84.1Overview . 84.2Wave Model Description . 94.3Boundary conditions – offshore wind and wave conditions . 104.4Wave modeling results . 204.4.1Wave/wind conditions for Guysborough – Reference Site 2. 22FiguresFigure 1 One (1) Reference Site location at Dover Bay in Guysborough county [4] . 6Figure 2 Dover Bay in Guysborough County, Nova Scotia, Canada . 7Figure 3 Bathymetry at site on hydrographic charts - Depth reported in meters . 9Figure 4 Bathymetry at site on STWave. Note the MSC50 HindCast model source point indicated at 45 12.000'N, 61 0.000'W Boundary conditions – offshore wind and wave conditions . 10Figure 5 Wave height versus wave direction plot. 11Figure 6 Wind speed versus wind direction plot for the source point . 12Figure 7: Extreme value analysis on wind data – for Source Point offshore location [1] . 14Figure 8: Extreme value analysis on wave data – for Source Point offshore location [1] . 16Figure 9 Maximum wind speed at 10- year return period and direction [from]- for Source Point offshorelocation [1] . 17Figure 10 Maximum wind speed at 50- year return period and direction [from]- for Source Point offshorelocation [1] . 18www.dsaocean.comDynamic Systems Analysis Ltd. 2020Page 4 of 25
TitleRevisionDSA ProjectWind and Wave Conditions – Guysborough – Reference Site 2BDate Last Revised2020-10-19CMAR-19EXMClient Project /N/AReferenceFigure 11 Maximum wave height at 10- year return period and direction [from]- for Source Pointoffshore location [1] . 18Figure 12 Maximum wave height at 50- year return period and direction [from]- for Source Pointoffshore location [1] . 19Figure 13 Wave modeling results for direction [From] 135 deg- SE . 21Figure 14 Wave modeling results for direction [From] 180 deg- S . 22Figure 15 Maximum wave height at 10- year return period and direction [from]- Guysborough –Reference Site 2 . 24Figure 16 Maximum wave height at 50- year return period and direction [from]- Guysborough –Reference Site 2 . 25TablesTable 1 Results extreme value analysis for wind and waves at the offshore source point locations inFigure 4 . 17Table 2 Tp values used in analysis. . 19Table 3 Estimated wave and wind design conditions for Guysborough – Reference Site 2. 23www.dsaocean.comDynamic Systems Analysis Ltd. 2020Page 5 of 25
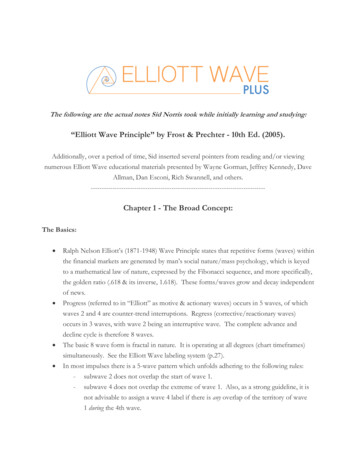
TitleRevisionDSA ProjectWind and Wave Conditions – Guysborough – Reference Site 2BDate Last Revised2020-10-19CMAR-19EXMClient Project /N/AReference1 Introduction1.1 OverviewFor the reference location at Dover Bay in Guysborough County shown in Figure 1, wind and waveconditions have been estimated. The following presents data on the predicted 10- and 50- year windand wave conditions at the reference location.Figure 1 One (1) Reference Site location at Dover Bay in Guysborough county [4]The location in Dover Bay is protected overall from offshore waves by surrounding lands to the north,but is vulnerable to waves from south and southeast which will travel directly into the area, as seen inFigure 2. These waves are expected to lose energy by travelling into shallower waters. Detailed wavemodelling is required to determine the amount of energy lost and wave height reduction.www.dsaocean.comDynamic Systems Analysis Ltd. 2020Page 6 of 25
TitleRevisionDSA ProjectWind and Wave Conditions – Guysborough – Reference Site 2BDate Last Revised2020-10-19CMAR-19EXMClient Project /N/AReferenceFigure 2 Dover Bay in Guysborough County, Nova Scotia, CanadaThe context of this project is that extreme wind and wave conditions are needed to select engineeringload cases for those wishing to install finfish or shellfish farms in the area. For example, extremeenvironmental conditions with minimum 10-year and 50-year return periods are required for the designof a marine fish farm site, as per guidance in the Scottish technical standard [2] and NS9415 [3]. Whilethe location assessed as part of this modeling exercise is not an actual aquaculture site location, thedata produced for this location is useful for understanding the approximate wave climate in the regionand can be used to evaluate any proposals for sites in the area. Understanding the wind and waveclimates at aquaculture sites is important for mitigating risks.1.2 Objective(s) Determine wave/wind conditions at one reference location at Dover Bay in Guysborough Countyand find the conditions with 10- and 50- year return periods.www.dsaocean.comDynamic Systems Analysis Ltd. 2020Page 7 of 25
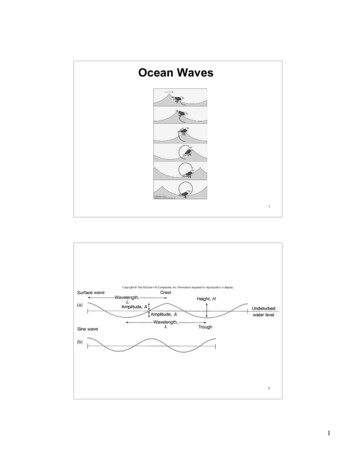
TitleRevisionDSA ProjectWind and Wave Conditions – Guysborough – Reference Site 2BDate Last Revised2020-10-19CMAR-19EXMClient Project /N/AReference2 Abbreviations and acronymsDSASMSCMARCHSDynamic Systems Analysis Ltd.Surface-water Modeling SystemCentre for Marine Applied ResearchCanadian Hydrographic Services3 Reference documents and ugh Wind and Wave Conditions RevB.0.pdfMarine Scotland. (2015). A Technical Standard for Scottish Finfish Aquaculture. MinisterialGroup for Sustainable Aquaculture's Scottish Technical Standard Steering GroupNorge, S. (2009). Norwegian Standard NS 9415. E: 2009. Marine Fish Farms—Requirementsfor Site Survey, Risk Analyses, Design, Dimensioning, Production, Installation andOperation. Standard Norge, Lysaker.CMAR proposed sites -RevB.kmz4 Wave conditions4.1 OverviewSMS version 12.2.13 was used to setup the bathymetric and computational grid. This section provides adescription of the grid size, mesh size and offshore environmental conditions. Site bathymetry isprovided in Figure 3. Note that a CHS hydrographic chart is used to generate the bathymetric data forwave modeling.www.dsaocean.comDynamic Systems Analysis Ltd. 2020Page 8 of 25
TitleRevisionDSA ProjectWind and Wave Conditions – Guysborough – Reference Site 2BDate Last Revised2020-10-19CMAR-19EXMClient Project /N/AReferenceFigure 3 Bathymetry at site on hydrographic charts - Depth reported in meters4.2 Wave Model DescriptionSMS, created by Aquaveo, is a modelling suite in which various water surface modelling tools, like waveand flow models, can be used. For this analysis SMS in combination with STWave is used. STWave is anearshore spectral Hydraulics model, developed by U.S. Army Engineer Research and DevelopmentCenter (ERDC) and Coastal and Hydraulics Laboratory (CHL). It is capable of modelling accurately wavetransformation and propagation.Two grids were setup, computational grid and spectral grid. The computational grid and its mesh sizesare mainly defined by the bathymetry. The bathymetry in SMS is presented in Figure 4. For this analysisthe computational grid size was 24.6 km x 24.1 km. The mesh size was 15 m x 15 m, resulting in 1642 x1610 2,643,620 grid cells.www.dsaocean.comDynamic Systems Analysis Ltd. 2020Page 9 of 25
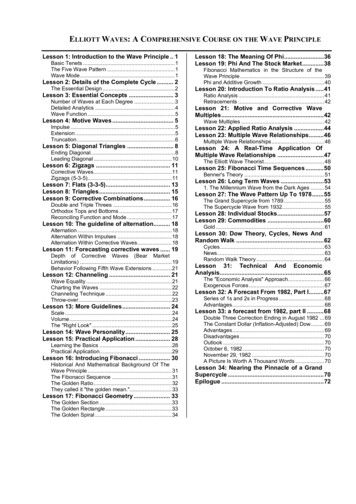
TitleRevisionDSA ProjectWind and Wave Conditions – Guysborough – Reference Site 2BDate Last Revised2020-10-19CMAR-19EXMClient Project /N/AReferenceThe spectral domain was divided into 72 directions and 50 frequencies, with a minimum frequency of0.03 Hz and a maximum frequency of 1.01 Hz.Source pointFigure 4 Bathymetry at site on STWave. Note the MSC50 HindCast model source point indicated at 45 12.000'N, 61 0.000'WBoundary conditions – offshore wind and wave conditions4.3 Boundary conditions – offshore wind and wave conditionsThe MSC50 HindCast model [1] data from location 45 12.000'N, 61 0.000'W was used to determine the10- and 50- year return periods for wind and wave of the Dover Bay Reference Site 2; the location islabelled as the “Source point” in Figure 4. The scatterplot of wave heights versus wave directions for thesource point is shown in Figure 5. The scatter plot of wind speeds versus wind directions for the sourcewww.dsaocean.comDynamic Systems Analysis Ltd. 2020Page 10 of 25
TitleRevisionDSA ProjectWind and Wave Conditions – Guysborough – Reference Site 2BDate Last Revised2020-10-19CMAR-19EXMClient Project /N/AReferencepoint is also shown in Figure 6. Extreme waves and wind at the source point appear to originate morefrequently from the southeast and south.Figure 5 Wave height versus wave direction plotwww.dsaocean.comDynamic Systems Analysis Ltd. 2020Page 11 of 25
TitleRevisionDSA ProjectWind and Wave Conditions – Guysborough – Reference Site 2BDate Last Revised2020-10-19CMAR-19EXMClient Project /N/AReferenceFigure 6 Wind speed versus wind direction plot for the source point10- and 50- year return period conditions are in general achieved by: Obtaining measured or hindcast data for parameter in questionFor each parameter, bin data by directionPerform extreme value analysis.o Extract annual maximao Fit Gumbel or Weibull distribution to this datao Use fitted distribution to calculate values corresponding to 10- and 50- year returnperiodThe extreme value analysis of the wind velocities is presented in Figure 7. U10 and U50 represent the10- and 50- year return period wind velocities, respectively.www.dsaocean.comDynamic Systems Analysis Ltd. 2020Page 12 of 25
TitleRevisionDSA ProjectWind and Wave Conditions – Guysborough – Reference Site 2BDate Last Revised2020-10-19CMAR-19EXMClient Project /N/AReferencewww.dsaocean.comDynamic Systems Analysis Ltd. 2020Page 13 of 25
TitleRevisionDSA ProjectWind and Wave Conditions – Guysborough – Reference Site 2BDate Last Revised2020-10-19CMAR-19EXMClient Project /N/AReferenceFigure 7: Extreme value analysis on wind data – for Source Point offshore location [1]The extreme value analysis of the wave heights is presented in Figure 8. Similar to the presentation ofthe wind data, Hs10 and Hs50 represent the 10- and 50- year return period wave heights, respectively.www.dsaocean.comDynamic Systems Analysis Ltd. 2020Page 14 of 25
TitleRevisionDSA ProjectWind and Wave Conditions – Guysborough – Reference Site 2BDate Last Revised2020-10-19CMAR-19EXMClient Project /N/AReferencewww.dsaocean.comDynamic Systems Analysis Ltd. 2020Page 15 of 25
TitleRevisionDSA ProjectWind and Wave Conditions – Guysborough – Reference Site 2BDate Last Revised2020-10-19CMAR-19EXMClient Project /N/AReferenceFigure 8: Extreme value analysis on wave data – for Source Point offshore location [1]In summary, the following data was obtained from the extreme value analysis:www.dsaocean.comDynamic Systems Analysis Ltd. 2020Page 16 of 25
TitleRevisionDSA ProjectWind and Wave Conditions – Guysborough – Reference Site 2BDate Last Revised2020-10-19CMAR-19EXMClient Project /N/AReferenceTable 1 Results extreme value analysis for wind and waves at the offshore source point locations in Figure 4Direction [from] [ ] Uwind,10year [m/s] Uwind,50year [m/s] Hs,10year [m] Hs,50year 1.982.4Polar plots for maximum wind speeds and wave heights at 10 year and 50 year return periods are shownin Figure 9 to Figure 12, respectively.Figure 9 Maximum wind speed at 10- year return period and direction [from]- for Source Point offshore location [1]www.dsaocean.comDynamic Systems Analysis Ltd. 2020Page 17 of 25
TitleRevisionDSA ProjectWind and Wave Conditions – Guysborough – Reference Site 2BDate Last Revised2020-10-19CMAR-19EXMClient Project /N/AReferenceFigure 10 Maximum wind speed at 50- year return period and direction [from]- for Source Point offshore location [1]Figure 11 Maximum wave height at 10- year return period and direction [from]- for Source Point offshore location [1]www.dsaocean.comDynamic Systems Analysis Ltd. 2020Page 18 of 25
TitleRevisionDSA ProjectWind and Wave Conditions – Guysborough – Reference Site 2BDate Last Revised2020-10-19CMAR-19EXMClient Project /N/AReferenceFigure 12 Maximum wave height at 50- year return period and direction [from]- for Source Point offshore location [1]The wave data, presented in Table 1, was set as boundary condition and specified as a JONSWAPspectrum. The peak-enhancement factor was set to 3.3 and directional spreading was included as acosm(θ) distribution.Only wind-wave interaction was considered. Current-wave interaction was not included because localflow velocities are very small.16 headings were used, the wind direction was kept constant within its directional bin. Tp was varied inthe presented range as shown in Table 2.Table 2 Tp values used in analysis.Direction [from] [ .dsaocean.comTp [s]4.14 15.459 14.56.6 14.66.6 136.5 148.2 148.4 138.8 13.89 14.88.9 14.4Dynamic Systems Analysis Ltd. 2020Page 19 of 25
TitleRevisionDSA Project225248270293315338Wind and Wave Conditions – Guysborough – Reference Site 2BDate Last Revised2020-10-19CMAR-19EXMClient Project /N/AReferenceSWWSWWWNWNWNNW8.9 14.17.5 15.34.1 15.44.1 14.33.5 14.53.7 14.4In this method, wave design conditions for the project location are based on 10- and 50- year returnperiod sea-state and winds for an offshore location, which have subsequently been transferred to theproject location. This will provide reasonable design conditions; however, they cannot be linked directlyto a return period at the site.4.4 Wave modeling resultsThe results of the wave modeling are presented in Figure 13 and Figure 14 for directions from southeast,and south, respectively for two key wave headings with the highest wave heights. As stated in theprevious section, the wind conditions are assumed to stay constant for the region. The results fromSTWave represent the maximum significant wave height value at the region including its spectral peakperiod and wave direction.The location of the Reference Site 2 in Dover Bay is presented in Figure 1. The estimated wave and windconditions for each site based on the STWave modeling are presented in the following sections.www.dsaocean.comDynamic Systems Analysis Ltd. 2020Page 20 of 25
TitleRevisionDSA ProjectWind and Wave Conditions – Guysborough – Reference Site 2BDate Last Revised2020-10-19CMAR-19EXMClient Project /N/AReferenceFigure 13 Wave modeling results for direction [From] 135 deg- SEwww.dsaocean.comDynamic Systems Analysis Ltd. 2020Page 21 of 25
TitleRevisionDSA ProjectWind and Wave Conditions – Guysborough – Reference Site 2BDate Last Revised2020-10-19CMAR-19EXMClient Project /N/AReferenceFigure 14 Wave modeling results for direction [From] 180 deg- S4.4.1 Wave/wind conditions for Guysborough – Reference Site 2The wave and wind results from the STWave model, for the Guysborough – Reference Site 2, aresummarized in Table 3. Note that the results in Table 3 indicate significant wave height (Hs) and peakperiod (TP) for the selected site. These represent the extreme wave conditions at this coordinate: 45 14.653'N, 61 1.057'W.www.dsaocean.comDynamic Systems Analysis Ltd. 2020Page 22 of 25
TitleRevisionDSA ProjectWind and Wave Conditions – Guysborough – Reference Site 2BDate Last Revised2020-10-19CMAR-19EXMClient Project /N/AReferenceTable 3 Estimated wave and wind design conditions for Guysborough – Reference Site 2Wave/Wind conditions Direction [from] [ ] Wind (m/s) Hs (m) Tp (s)10yr 1.1811.2813.725.852.672.442.392.542.242.7950yr dsaocean.comDynamic Systems Analysis Ltd. 2020Page 23 of 25
TitleRevisionDSA ProjectWind and Wave Conditions – Guysborough – Reference Site 2BDate Last Revised2020-10-19CMAR-19EXMClient Project /N/AReferenceIt should be noted that the return periods indicated for each wave parameter in Table 3 arerepresentative of the boundary condition used to derive that value, not the value itself. Polar plots formaximum wave heights are presented in Figure 15 and Figure 16.Figure 15 Maximum wave height at 10- year return period and direction [from]- Guysborough – Reference Site 2www.dsaocean.comDynamic Systems Analysis Ltd. 2020Page 24 of 25
TitleRevisionDSA ProjectWind and Wave Conditions – Guysborough – Reference Site 2BDate Last Revised2020-10-19CMAR-19EXMClient Project /N/AReferenceFigure 16 Maximum wave height at 50- year return period and direction [from]- Guysborough – Reference Site 2www.dsaocean.comDynamic Systems Analysis Ltd. 2020Page 25 of 25
DSA Project CMAR-19EXM Client Project / Reference N/A www.dsaocean.com Dynamic Systems Analysis Ltd. 2020 Page 8 of 25 2 Abbreviations and acronyms 3 Reference documents and drawings [1] Report-DSA-CMAR-19EXM-Guysborough Wind and Wave Conditions RevB.0.pdf [2] Marine Scotland. (2015). A Technical Standard for Scottish Finfish Aquaculture.