Transcription
University of British ColumbiaAnnual Enrolment Report2020/21Dr. Ananya Mukherjee-ReedProvost and Vice-President Academic, UBC OkanaganDr. Andrew SzeriProvost and Vice-President Academic, UBC Vancouver
ContentsLIST OF TABLES . 4LIST OF FIGURES .5PREFACE . 6Covid-19 Pandemic Impact . 6Data Initiatives . 6EXECUTIVE SUMMARY .7INTRODUCTION . 8UNDERGRADUATE AND GRADUATE STUDENT ADMISSIONS . 9How Many Undergraduate Students Applied, were Admitted, and Registered at UBC? .9How Many Graduate Students Applied, were Admitted, and Registered at UBC? .14Graduate Student Recruitment . 17What is the Academic Potential of New Undergraduate Students?. 18Where Did UBC’s New Direct-Entry Students Previously Study? . 19Where Did UBC’s New Transfer Students Previously Study? . 20Where did Indigenous Students at UBC Previously Study? . 22In Which Canadian Provinces Did UBC’s New Undergraduate Students Previously Study? .24In Which Countries or territories Did UBC’s New International Undergraduate Students Previously Study? .25Where Did UBC’s New Graduate Students Previously Study? . 27UNDERGRADUATE AND GRADUATE STUDENT ENROLMENT . 30What is UBC’s Government-Funded Domestic FTE Count by Campus? .30How Many Students did UBC Enrol in 2020/21? . 30How Many Domestic Students did UBC Enrol in 2020/21? . 32How Many Indigenous Students did UBC Enrol in 2020/21? . 33How Many International Students did UBC Enrol in 2020/21? . 34How Many Transfer Students did UBC Enrol in 2020/21? . 35How Many Students were Enrolled in Vantage College? . 37How Many Students were Youth Formerly in Government Care? . 37How Many World University Service of Canada Students were Enrolled? .38What are the Demographic Characteristics of UBC’s Students? . 38What Citizenships Are Held By UBC’s International Students? . 40INDICATORS OF STUDENT SUCCESS . 43How Many Credentials did UBC Award? . 43What are UBC’s Undergraduate Students’ Retention and Completion Rates? .45What are UBC’s Indigenous Undergraduate Students’ Retention and Completion Rates? .47What was the Time Taken by UBC Graduate Students to Complete their Programs? .48APPENDIX A: HEADCOUNT ENROLMENT TABLES . 512 Page
Okanagan Campus . 51Vancouver Campus . 53APPENDIX B: FTE ENROLMENT TABLES. 58APPENDIX C: DEGREES CONFERRED TABLES . 62APPENDIX D: GLOSSARY .643 Page
LIST OF TABLESTable 1: Undergraduate Students’ Admit and Yield Rates, All Year Levels, by Year . 13Table 2: Graduate Students’ Admit and Yield Rates, by Year . 17Table 3: All Enrolled Indigenous Students’ Previous Institution, by Year, by Campus . 22Table 4: Overall Student Headcount, by Year, by Campus . 31Table 5: Domestic Student Headcount, by Year, by Campus . 32Table 6: Domestic Indigenous Student Headcount, by Year, by Campus . 34Table 7: International Student Headcount, by Year, by Campus . 35Table 8: International Students’ Citizenship, by Year, Okanagan Campus . 40Table 9: International Students’ Citizenship, by Year, Vancouver Campus . 41Table 10: Number of Credentials Awarded, by Calendar Year, by Campus . 44Table 11: Number and Proportion of Credentials Awarded to Indigenous Students, by Calendar Year, by Campus . 45
LIST OF FIGURESFigure 1: Undergraduate Students’ Admissions Pyramid (Domestic, All Year Levels), Okanagan Campus, by Year . 10Figure 2: Undergraduate Students’ Admissions Pyramid (International, All Year Levels), Okanagan Campus, by Year. 11Figure 3: Undergraduate Students’ Admissions Pyramid (Domestic, All Year Levels), Vancouver Campus, by Year . 11Figure 4: Undergraduate Students’ Admissions Pyramid (International All Year Levels), Vancouver Campus, by Year . 12Figure 5: Graduate Students’ Admissions Pyramid (Domestic), Okanagan Campus, by Year . 15Figure 6: Graduate Students’ Admissions Pyramid (International), Okanagan Campus, by Year . 15Figure 7: Graduate Students’ Admissions Pyramid (Domestic), Vancouver Campus, by Year . 16Figure 8: Graduate Students’ Admissions Pyramid (International), Vancouver Campus, . 16Figure 9: Location of Previous Institution Attended, New Undergraduate Direct-Entry Students, 2020/21, by Campus . 19Figure 10: Top 10 Countries or Territories (other than Canada) of Previous Institution Attended, New Undergraduate DirectEntry Students, 2020/21, by Campus . 20Figure 11: Location of Previous Institution Attended, New Undergraduate Transfer Students, 2020/21, by Campus . 21Figure 12: Top 10 Countries or Territories (other than Canada) of Previous Institution Attended, New UndergraduateTransfer Students, 2020/21 . 21Figure 13: Indigenous Students’ Previous Institution, by Province, 2020/21, Okanagan Campus (if in Canada) . 23Figure 14: Indigenous Students’ Previous Institution, by Province, 2020/21, Vancouver Campus (if in Canada) . 23Figure 15: Canadian Province of Previous Institution Attended by New Undergraduate Students, 2020/21, OkanaganCampus (if in Canada) . 24Figure 16: Canadian Province of Previous Institution Attended by New Undergraduate Students, 2020/21, VancouverCampus (if in Canada) . 25Figure 17: Country or Territory of Previous Institution Attended, New International Undergraduate Students, 2020/21,Okanagan Campus . 26Figure 18: Country or Territory of Previous Institution Attended, New International Undergraduate Students, 2020/21,Vancouver Campus . 26Figure 19: Province of Previous Institution Attended (if in Canada), New Graduate Students, 2020/21, Okanagan Campus. 27Figure 20: Province of Previous Institution Attended (if in Canada), New Graduate Students, 2020/21, Vancouver Campus. 28Figure 21: Country or Territory of Previous Institution Attended (outside of Canada), New Graduate Students, 2020/21,Okanagan Campus . 29Figure 22: Country or Territory of Previous Institution Attended (outside of Canada), New Graduate Students, 2020/21,Vancouver Campus . 29Figure 23: Government-Funded and Delivered (Actual) Domestic FTEs, by Campus . 30Figure 24: Headcount of Transfer Student Admits and Registrations, by Campus, 2020/21 . 36Figure 25: Headcount of Transfers Between UBC Campuses, by Year . 36Figure 26: Funded Students with Lived Experience in Care, by Campus . 37Figure 27: Students’ Gender Distribution, by Program, by Campus, 2020/21 . 38Figure 28: Students’ Age Distribution, by Program, by Campus, 2020/21 . 39Figure 29: International Students’ Citizenship, 2020/21, Okanagan Campus . 42Figure 30: International Students’ Citizenship, 2020/21, Vancouver Campus . 42Figure 31: Retention Rates of Domestic and International First-Year Students, by Entry Year, by Campus . 46Figure 32: Six-Year Completion Rates of Domestic and International Undergraduate Students, by Entry Year, by Campus. 46Figure 33: Retention Rates of Indigenous Students, by Entry Year, by Campus . 47Figure 34: Six-Year Completion Rates of Indigenous Undergraduate Students, by Entry Year, by Campus . 48Figure 35: Master’s Students’ Years to Completion, 2010/11-2013/14 Cohorts, Okanagan Campus . 49Figure 36: Master’s Students’ Years to Completion, 2010/11-2013/14 Cohorts, Vancouver Campus . 49Figure 37: Doctoral Students’ Years to Completion, 2007/08-2010/11 Cohorts, Okanagan Campus. 50Figure 38: Doctoral Students’ Years to Completion, 2007/08-2010/11 Cohorts, Vancouver Campus . 505 Page
PREFACECOVID-19 PANDEMIC IMPACTWe welcomed new and returning students to UBC under decidedly different circumstances this year. The global COVID19 pandemic in 2020 impacted all facets of university life and operations. Student recruitment, campus operations,teaching modes, research, and the delivery of support services all saw significant transformation as our communityresponded to the pandemic. This was also a very challenging year for prospective and continuing students and theirfamilies, domestically and around the world.While the challenges will continue for some time, the university recognizes the extraordinary resilience and commitmentof its students, faculty, and staff in meeting the challenges, and we are grateful to students for their continuing pursuitof their educational goals. The profound resolve of our community is reflected in remarkable and amazing outcomes forthis year.DATA INITIATIVESUBC is actively involved in improving our demographic data to more fully support the diversity within our student body.In the spring of 2021, when our new student admission portal, Education Planner British Columbia (EPBC) is introduced,non-binary gender identification options for undergraduate applicants will become available.Furthermore, UBC is exploring the potential to collect additional demographic data from students to help better describethe student population, especially those who have been historically underrepresented on UBC campuses. The goal is toprovide the information needed to plan for and enhance student support and services. The Equity and Inclusion Office,Planning and Institutional Research, and Enrolment Services are working together to identify relevant data andappropriate methods for collection. Such data will support the evaluation of the student experience and the value ofexisting and planned supports.6 Page
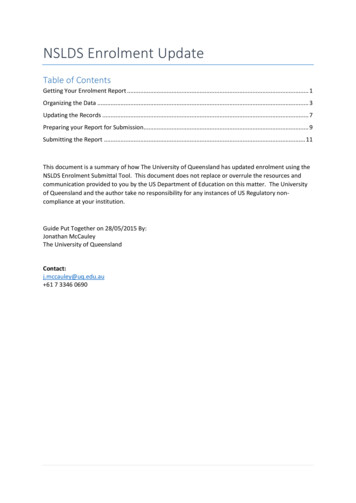
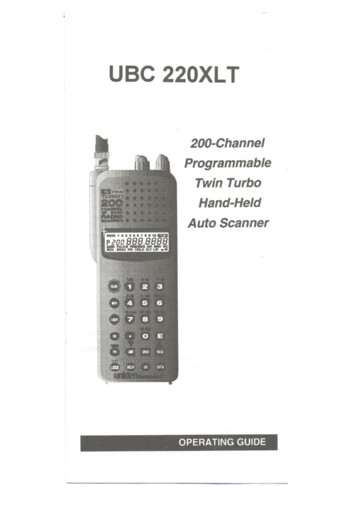
EXECUTIVE SUMMARYFirst Year Undergraduate Retention Rate 94%Total UBC Enrolment ver70,02467,95866,2662019/20 Retention rate for first-year, first-time, full-time studentsin baccalaureate programs progressing into their secondyear of studies.2020/21OkanaganIndigenous ternational StudentsOkanagan2020/21Graduate: 7%1,856Undergraduate: 93%2019/201,7311,773Domestic Students:94.2%Indigenous Students: 87.2%International Students: 93.7%2018/19Vancouver2017/18Graduate: 21%1,657Undergraduate: 79%2016/1717,918OkanaganGraduate: 16%18,283Undergraduate: 84%17,225Vancouver16,158Graduate: 25%14,433Undergraduate: 75%Direct-Entry Baccalaureate Students’ Origins50%40%30%20%10%0%OkanaganLower MainlandRest of BCOkanaganOther CanadaOutside CanadaVancouverUBC International Students’ Countries or Territories of CitizenshipIs the143countries represented by internationalundergraduate students1,933China4155,5107 Page337countries represented by internationalgraduate studentsIndia1,003487119United States ofAmericaRepublic of KoreaIndonesiaUnited States of America632China4151,11895India524396IranMexico
INTRODUCTIONThe UBC Annual Enrolment Report (2020/21) provides detailed information about incoming and enrolled studentssystem-wide and at the Okanagan and Vancouver campuses. UBC’s enrolment objectives are to: meet the Government’s targets for domestic undergraduate and graduate FTEs,increase the enrolment of Indigenous students, 1provide access for other historically underrepresented populations,attract the “best and the brightest” students to UBC,enrol a strong contingent of domestic students from British Columbia and attract students from elsewhere inCanada, andachieve a diverse international student body.Student enrolment is generally reported in one of two ways: as a headcount, which is a measure of the number ofstudents enrolled, and as a full-time equivalent (FTE), a measure of the course activity of the students enrolled. FTEs forundergraduate students are calculated by taking the number of annual course credits taken by a student and dividing bythe normal or expected number of credits required by the student’s program and year level. For example, a student whotakes 27 credits in a particular year, and whose program expects that 30 credits will be taken, is counted as 0.9 FTE. Forgraduate students, the FTE is determined by awarding 1.0 FTE for full-time status and 0.33 FTE for part-time status, foreach term, summing the three terms in an academic year, and then dividing by 3 to create an annual average FTE.The BC Ministry of Advanced Education and Skills Training sets targets for, and funds, student FTEs rather thanheadcounts. These FTE targets are set for domestic students (e.g., Canadian citizens, permanent residents, andrefugees), and do not apply to international undergraduate students. The Ministry provides base funding and strategicfunding. Base funding is allocated based on a specified number of FTE student spaces for domestic undergraduate andselected graduate students. The strategic funding is designed to create domestic student spaces for high priority areaswith significant labour market demands, such as for the health professions. For the 2020/21 fiscal year (April 1, 2020to March 31, 2021), UBC was government-funded for a total of 42,995 FTEs, 208 more than the previous year; 7,059FTEs were allocated to the Okanagan campus and 35,936 FTEs were allocated to the Vancouver campus. Overall,36,985 FTEs were funded undergraduate domestic student spaces and 6,010 were funded graduate student spaces. Anadditional 164 FTEs for the 20/21 year were directed to the Occupational Therapy program, Physical Therapy — Northprogram, Bachelor of Science in Computer Science, Bachelor of Applied Science in Biomedical Engineering, and Bachelorof Applied Science in Manufacturing Engineering on the Vancouver Campus. On the Okanagan campus, the additional44 FTE were directed to the Bachelor of Science in Computer Science and the Bachelor of Applied Science inManufacturing Engineering.For the purposes of this report new students include only those who were new at the start of the winter session.We use the term "Indigenous" to refer inclusively to members of First Nations, status and non-status, treaty and non-treaty Indians, Métis, and Inuitpeoples in Canada, recognizing in doing so that many people prefer the terms that are specific and traditional to their communities.18 Page
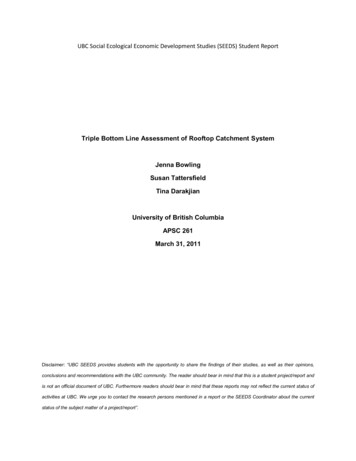
UNDERGRADUATE AND GRADUATE STUDENT ADMISSIONSHOW MANY UNDERGRADUATE STUDENTS APPLIED, WERE ADMITTED, ANDREGISTERED AT UBC?COVID-19 PANDEMIC IMPACT: The pandemic has impacted all facets of university life and operations. Studentrecruiting, campus operations, teaching modes, research and delivery of support services all saw significanttransformation as our community responded to the pandemic. This was also a very challenging year forprospective and continuing students and their families, domestically and around the world.While the challenges will continue for some time, the university recognizes the extraordinary diligence andcommitment of its students, faculty, and staff in responding to the situation, and we are grateful to students andtheir families for their continuing pursuit of excellent post-secondary education.UBC uses a competitive admission process because it receives applications from more students than can beaccommodated. UBC’s admission requirements are designed to select students who are the most likely to succeed intheir learning and to thrive on campus. Whereas UBC recruits for diversity in the incoming class, admission decisionsare based solely upon a fair and equitable process that evaluates applicants on their individual merits. Ultimately, thegoal is for the University to achieve its enrolment objectives in terms of the composition, qualities, and size of theincoming class.Students apply, complete their applications with all necessary documents, gain admission, and ultimately register incourses. Each stage of the process contains fewer students than the previous stage and requires ongoing analysis andstrategic decision making to ensure the best possible enrolment outcomes. UBC attracts applications from manyinternational students and the numbers have been increasing over time. It is important to note that internationalstudents do not compete with domestic students for the government-funded seats and thus do not displace domesticstudents. The two groups of students are measured by a common standard in two independent applicant pools andprocesses.In September 2021, UBC will use a new application system for undergraduate admissions, EducationPlannerBC. The newsystem, which is a province-wide service, integrates planning, application and data movement services. By usingcentralized planning resources, students can search for information about various programs, institutions andcommunities across B.C. When students decide to apply to one or more programs, they can complete their applicationthrough the system without having to re-enter the same information each time. In addition, the service further expandselectronic transcript exchanges to include more K-12 and post-secondary institutions and provincial hubs. Although theinauguration date follows UBC’s traditional application deadline, this “soft-launch” will permit the collection of a smallvolume of applications to further test and optimize the platform to meet UBC’s and students’ needs. This approach willreduce risks and produce a better applicant experience when fully launched for the 2021/2022 application cycle.Figures 1 through 4 illustrate the campus-specific undergraduate applicant pools by domestic and international status.Each pyramid shows the numbers of submitted and completed applications, and the numbers of admitted students andsubsequent registrations for 2015/16 through 2020/21. Undergraduate students may apply to two programs, ranked inorder of choice, offered by one or both campuses. The application pyramids report the students’ first choice programsfor the number of submitted and completed applications and the number of students admitted. The numbers ofregistered students have two counts: the upper number represents the number of students who registered in theirpreferred or first choice of program or campus (Ch1) and the lower number represents the number of students registered9 Page
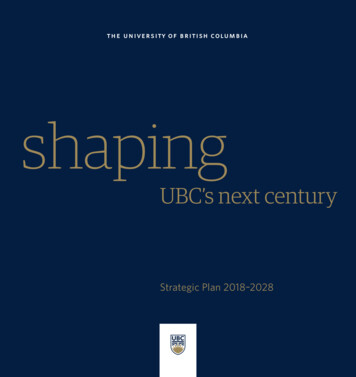
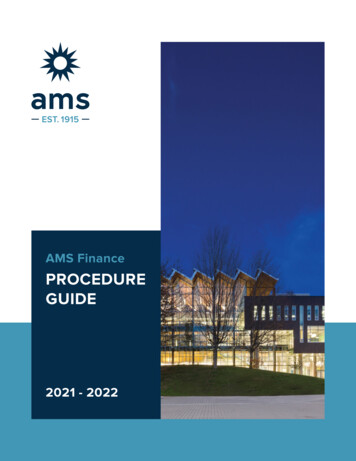
in their second choice, an alternative program on either campus (Ch2). The two counts combined provide the totalnumber of new students registered.Each pyramid shows the number of submitted and completed applications, the number of admitted students andsubsequent number of registrations for 2016/17 through 2020/21. A submitted application identifies a complete formalrequest to enter a UBC program of study accompanied by payment of an application fee. A complete applicationidentifies that all documentation and information required to initiate the evaluation of the application was received. Theterm admitted identifies that an application was reviewed and UBC extended an offer to enrol to the applicant. Lastly,“registered” identifies that the student accepted the offer of admission, selected courses and started attending classes.The pyramid shapes in Figures 1 through 8 indicate that at each stage of the enrolment process some applicants do notprogress to the next stage.In 2020/21, the total applicant pool (with completed applications) for the Okanagan campus was consistent with thenumber received in 2019/20. The size of the domestic undergraduate applicant pool was consistent with that of2019/20 (see Figure 1), and the international undergraduate applicant pool grew by 1% (see Figure 2).For the Vancouver campus, the total applicant pool (with completed applications) increased by 6% over 2019/20. Thedomestic applicant pool increased by 8%, over 2019/20 (see Figure 3), and the international applicant pool increasedby 3% (see Figure 4).FIGURE 1: UNDERGRADUATE STUDENTS’ ADMISSIONS PYRAMID (DOMESTIC, ALL YEAR LEVELS), OKANAGANCAMPUS, BY YEARNote: “Ch1” denotes first choice program, and “Ch2” denotes a second choice or alternative program choice.10 P a g e
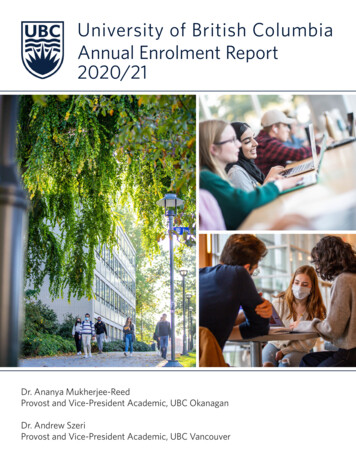
FIGURE 2: UNDERGRADUATE STUDENTS’ ADMISSIONS PYRAMID (INTERNATIONAL, ALL YEAR LEVELS),OKANAGAN CAMPUS, BY YEARFIGURE 3: UNDERGRADUATE STUDENTS’ ADMISSIONS PYRAMID (DOMESTIC, ALL YEAR LEVELS), VANCOUVERCAMPUS, BY YEAR11 P a g e
FIGURE 4: UNDERGRADUATE STUDENTS’ ADMISSIONS PYRAMID (INTERNATIONAL ALL YEAR LEVELS),VANCOUVER CAMPUS, BY YEARUBC receives applications from very highly qualified students. These high achieving students typically have severaloffers of admission from universities across Canada and around the world; consequently, they do not always acceptUBC’s offer of admission.Based on our past experience, we anticipate the proportion of applicants that would typically accept an offer ofadmission and register; consequently, a specified number of offers of admission are made to ensure that the targetednumber of students actually register. The admit and yield rates are shown in Table 1. The admit rate is the ratio ofstudents offered admission to their preferred choice of program to the number of completed applications received; thisincludes applicants refused admission for failure to achieve minimum requirements (e.g., missing a pre-requisite course)and those refused due to lack of space (e.g., their academic and personal profile assessments were not sufficientlycompetitive). The yield rate is the ratio of registered students to the number offered admission to their preferred choiceof program. The admit rate is influenced by the number of applicants, the number of seats available for each applicantpool (domestic and international) and the likelihood that the student, once offered admission, will register (theselikelihoods vary for domestic and international students).12 P a g e
TABLE 1: UNDERGRADUATE STUDENTS’ ADMIT AND YIELD RATES, ALL YEAR LEVELS, BY YEARCampusCitizenshipOkanagan DomesticAdmit RateYield RateInternationalAdmit RateYield RateOkanagan Total Admit RateYield RateVancouver DomesticAdmit RateYield RateInternationalAdmit RateYield RateVancouver Total Admit RateYield Rate2016/17 2017/18 2018/19 2019/20 %35%32%54%53%49%52%57%51%50%50%49%47%Admit Rate: Within an admissions cycle, the ratio of admitted students to completed applicants.Yield Rate: Within an admissions cycle, the ratio of registered students to admitted students.UBC’s ability to achieve its enrolment objectives is the result of strategic recruitment activities, supportive advising, androbust orientation programming for newly admitted students. For 2020/21, 48% of the direct-entry students admittedto their preferred program ultimately accepted their offer of admission. Of those who accepted an offer of admission toa program, 15% did not register and attend classes in September. Last year, 51% of these students accepted their offerof admission and 13% of those did not ultimately register and attend classes.After letters with offers of admission are provided to successful applicants, a targeted and timed communicationcampaign keeps these applicants engaged with the university through to the deadline by which they must accept theiroffer.COVID-19 PANDEMIC IMPACT: Many recruiting ev
The UBC Annual Enrolment (2020/21Report ) provides detailed information about incoming and enrolled students system-wide and at the Okanagan and Vancouver campuses. UBC's enrolment objectives are to: meet the Government's targets for domestic undergraduate and graduate FTEs,