Transcription
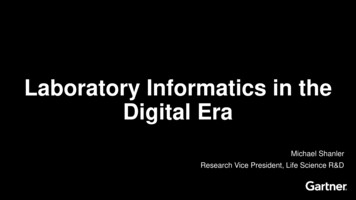
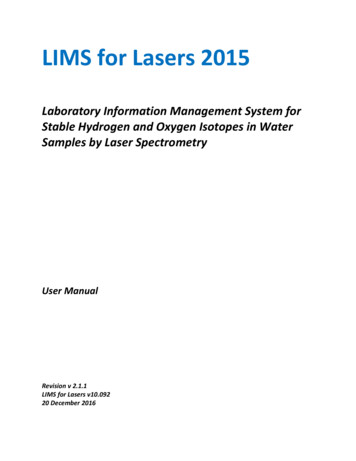
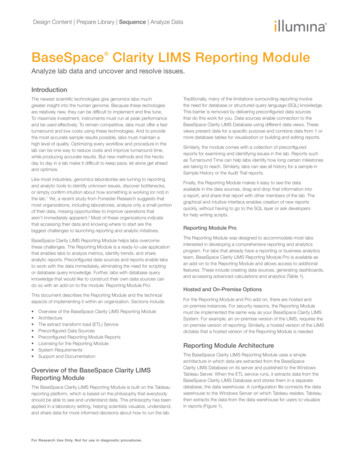
Design Content Prepare Library Sequence Analyze DataBaseSpace Clarity LIMS Reporting Module Analyze lab data and uncover and resolve issues.IntroductionThe newest scientific technologies give genomics labs muchgreater insight into the human genome. Because these techologiesare relatively new, they can be difficult to implement and fine tune.To maximize investment, instruments must run at peak performanceand be used effectively. To remain competitive, labs must offer a fastturnaround and low costs using these technologies. And to providethe most accurate sample results possible, labs must maintain ahigh level of quality. Optimizing every workflow and procedure in thelab can be one way to reduce costs and improve turnaround time,while producing accurate results. But new methods and the hecticday to day in a lab make it difficult to keep pace, let alone get aheadand optimize.Like most industries, genomics laboratories are turning to reportingand analytic tools to identify unknown issues, discover bottlenecks,or simply confirm intuition about how something is working (or not) inthe lab.1 Yet, a recent study from Forrester Research suggests thatmost organizations, including laboratories, analyze only a small portionof their data, missing opportunities to improve operations thataren’t immediately apparent.2 Most of these organizations indicatethat accessing their data and knowing where to start are thebiggest challenges to launching reporting and analytic initiatives.BaseSpace Clarity LIMS Reporting Module helps labs overcomethese challenges. The Reporting Module is a ready-to-use applicationthat enables labs to analyze metrics, identify trends, and shareanalytic reports. Preconfigured data sources and reports enable labsto work with the data immediately, eliminating the need for scriptingor database query knowledge. Further, labs with database queryknowledge that would like to construct their own data sources cando so with an add-on to the module: Reporting Module Pro.This document describes the Reporting Module and the technicalaspects of implementing it within an organization. Sections include: Overview of the BaseSpace Clarity LIMS Reporting ModuleArchitectureThe extract transform load (ETL) ServicePreconfigured Data SourcesPreconfigured Reporting Module ReportsLicensing for the Reporting ModuleSystem RequirementsSupport and DocumentationOverview of the BaseSpace Clarity LIMSReporting ModuleThe BaseSpace Clarity LIMS Reporting Module is built on the Tableaureporting platform, which is based on the philosophy that everybodyshould be able to see and understand data. This philosophy has beenapplied in a laboratory setting, helping scientists visualize, understand,and share data for more informed decisions about how to run the lab.For Research Use Only. Not for use in diagnostic procedures.Traditionally, many of the limitations surrounding reporting involvethe need for database or structured query language (SQL) knowledge.This barrier is removed by delivering preconfigured data sourcesthat do this work for you. Data sources enable connection to theBaseSpace Clarity LIMS Database using different data views. Theseviews present data for a specific purpose and combine data from 1 ormore database tables for visualization or building and editing reports.Similarly, the module comes with a collection of preconfiguredreports for examining and identifying issues in the lab. Reports suchas Turnaround Time can help labs identify how long certain milestonesare taking to reach. Similarly, labs can see all history for a sample inSample History or the Audit Trail reports.Finally, the Reporting Module makes it easy to see the dataavailable in the data sources, drag and drop that information intoa report, and share that report with other members of the lab. Thegraphical and intuitive interface enables creation of new reportsquickly, without having to go to the SQL layer or ask developersfor help writing scripts.Reporting Module ProThe Reporting Module was designed to accommodate most labsinterested in developing a comprehensive reporting and analyticsprogram. For labs that already have a reporting or business analyticsteam, BaseSpace Clarity LIMS Reporting Module Pro is available asan add-on to the Reporting Module and allows access to additionalfeatures. These include creating data sources, generating dashboards,and accessing advanced calculations and analytics (Table 1).Hosted and On-Premise OptionsFor the Reporting Module and Pro add-on, there are hosted andon-premise instances. For security reasons, the Reporting Modulemust be implemented the same way as your BaseSpace Clarity LIMSSystem. For example, an on-premise version of the LIMS, requires theon-premise version of reporting. Similarly, a hosted version of the LIMSdictates that a hosted version of the Reporting Module is needed.Reporting Module ArchitectureThe BaseSpace Clarity LIMS Reporting Module uses a simplearchitecture in which data are extracted from the BaseSpaceClarity LIMS Database on its server and published to the WindowsTableau Server. When the ETL service runs, it extracts data from theBaseSpace Clarity LIMS Database and stores them in a separatedatabase, the data warehouse. A configuration file connects the datawarehouse to the Windows Server on which Tableau resides. Tableauthen extracts the data from the data warehouse for users to visualizein reports (Figure 1).
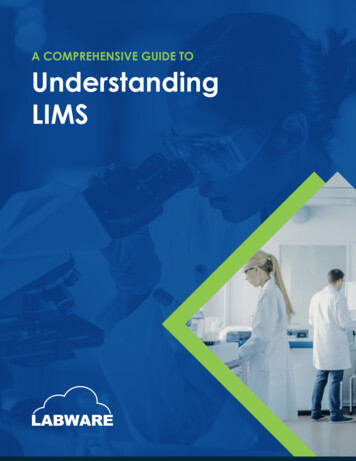
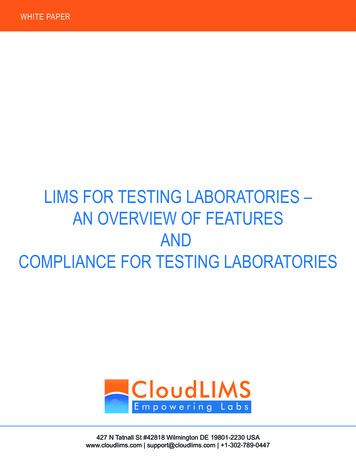
Design Content Prepare Library Sequence Analyze DataTable 1: Comparison of BaseSpace Clarity LIMS Reporting Module and Reporting Module ProFeatureBaseSpace Clarity LIMS Reporting ModuleCreate/Edit New ReportsXReporting Module ProXCreate/Edit Data SourcesAccess to preconfigured data sources onlyXCreate DashboardsView and interact with preconfigured dashboards onlyXAdvanced Calculations and AnalyticsAccess to standard calculations and analytics onlyXETL ServiceIt is recommended that Reporting Module users set up an emptydatabase on their existing BaseSpace Clarity LIMS Server so thatwhen the ETL Service runs, it’s accessing the same server and nothaving to go through the VPN tunnel or other remote connection.With Reporting Module Pro, users also receive a license for a desktopapplication that connects to the BaseSpace Clarity LIMS Server andthe Tableau Server.BaseSpace Clarity LIMS uses ETL to access data in the LIMSDatabase for visualization and reporting. This ETL Service readsdata from the LIMS Database, reformats it into a more reportingfriendly format, and loads the data into the data warehouse (Figure 2).Although most ETLs are fairly standard, this customized version moreefficiently handles user-defined fields, or those custom fields set upby LIMS users.BaseSpace ClarityLIMS ReportingBaseSpaceClarity LIMSLIMS DatabaseLinux UnixETLReporting DatabaseWarehouseTableau ServerWindowsBaseSpace ClarityLIMS Reporting ProFigure 1: A High-Level View of the BaseSpace Clarity LIMS Reporting ArchitectureManipulating the ETL ServiceAlong with the ability to control the timing of the ETLs, users candisable an ETL completely. Users may want to do this if the lab doesnot use a particular feature or functionality. For example, if you havenot enabled the audit trail on BaseSpace Clarity LIMS System, it mightmake sense to turn off the clarity auditing etl.The BaseSpace Clarity LIMS Reporting Module, requires installationof the ETL Service on the LIMS Server, or have the BaseSpace ClarityLIMS team install it for you. After it is installed, with access to theserver, users can start, stop, get status, and log files for the service.NOTE: Aggressive ETL or extract approaches can have an impact onthe performance of the BaseSpace Clarity LIMS Sytem.The ETL Service also uses an etl-config.properties file, which specifiesthe connection between the LIMS Database and data warehouse andthe frequency with which ETL jobs will run (Table 2).Table 1Table 2Table 3Table 4Table 5Table 6LIMS DatabaseReporting ViewETLUses an Extract Transform Load(ETL) to read data from thedatabase and stores it ina data warehouseFigure 2: How the ETL Service Interacts with the LIMS Database and the Reporting Database WarehouseFor Research Use Only. Not for use in diagnostic procedures.Reagents ViewUDF ViewsReporting DatabaseWarehouse
Design Content Prepare Library Sequence Analyze DataTable 2: ETL Job FrequencyFor example, sample UDFs are populated in the views with thefollowing naming convention, where # is the index of the view:JobFrequencyclarity reporting scheduleOnce a day at midnightclarity smp udf pivot# viewclarity auditing scheduleOnce a day at midnightin progress reporting scheduleEvery 5 minutesclarity artifact udfs scheduleAccess to standardcalculations and analytics onlyEach view contains up to 500 columns with the first column beingthe submitted sample id and the remaining 499 columns the valuesfor the sample UDFs. The number of columns in each view dependson the number of UDFs that are defined for samples.clarity dashboard scheduleOnce a day at midnightclarity reagents scheduleOnce a day at midnightclarity step udfs scheduleOnce a day at midnightclarity sample udfs scheduleOnce a day at midnightclarity client udfs scheduleOnce a day at midnightclarity container udfs scheduleOnce a day at midnightIf 499 or less UDFs are defined for samples, then one pivot view,clarity smp udf pivot1 view, will contain all of the sample UDFs. If more than 499 UDFs are defined for samples, then a secondpivot view, clarity smp udf pivot2 view, will contain additionalsample UDFs.As the number of sample UDFs increases, additional pivot viewswill be populated.Handling of UDFs Through the ETL ServiceIn BaseSpace Clarity LIMS, there are 7 entities on which users mayhave configured user-defined fields (UDFs): AccountOutput (referred to as Artifact)ClientContainerProjectSubmitted sampleStepDue to the unique nature of UDFs, 2 types of views are created forUDFs on each entity: UDF Name Map and UDF Pivot. The namingconvention for these views is as follows: clarity entityname udf name mapclarity entityname udf pivot# viewFor example, the views created for the Account entity are clarity actudf name map and clarity act udf pivot# view where # is the indexof the view; the views created for the Sample entity are clarity smpudf name map and clarity smp udf pivot# view, and so on.UDF Name MapThis view contains 4 columns of data: Name – in the reports, this displays as ‘Clarity Name’Alias – in the reports, this displays as ‘Reporting Alias’(see How the aliases are generated)PivottableUdfidUDF PivotThis view contains information about all the configured UDFs inyour system. By default, a minimum of 10 views are created.Due to database limitations, for each 499 UDFs a new UDF pivotview is populated. Each UDF pivot view includes an ID number, whichis needed to join to other views. The number of pivot views that arepopulated depends on the number of UDFs configured ona specific entity.How the aliases are generatedThe pivot views for all the UDF ETLs have been updated to haveunique human-readable column names, each ending with the ID ofthe UDF the column represents. The mapping tables have also beenupdated to include a Udfid column. Putting UDFs in a report-friendlyformat requires using the UDF name as a column header in the datawarehouse. Therefore, column headers are limited to a certain lengthand cannot contain special characters.The aliases are generated by the following algorithm: Replace % with ‘pct’Replace & with ‘and’Replace all whitespace with an underscore character ( ‘ ’ )Remove all remaining non-word charactersIf the alias starts with a digit, add the ‘udf ’ prefixIf the alias starts with an underscore character ( ‘ ’ ), addthe ‘udf’ prefixTruncate the alias such that the Udfid can be added as a suffixwith an underscore character ( ‘ ’ ), and the entire alias remains lessthan or equal to the maximum allowable column name size for thereporting database.Preconfigured Data SourcesThe BaseSpace Clarity LIMS Reporting Module uses predesigned,reusable data sources to connect to the database tables. These datasources are built with data views, which present data for a specificpurpose and can combine data from 1 or more database tables.Views are how the data are depicted at the database level. Datasources are how they are combined or used alone to appear inthe Reporting Module.Because BaseSpace Clarity LIMS Reporting uses predesigned datasources, users do not need SQL skills to edit and create reports; userscan simply work with the data in the predesigned data sources.A complete reference of each view exists in the user documentationfor the BaseSpace Clarity LIMS Reporting Module.For Research Use Only. Not for use in diagnostic procedures.
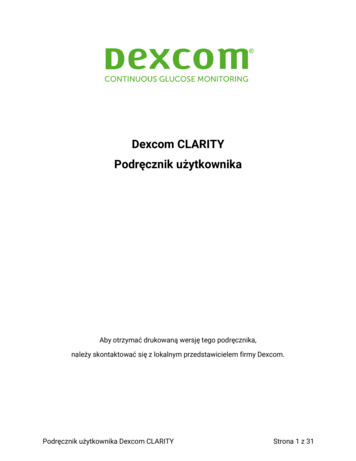
Design Content Prepare Library Sequence Analyze DataViewsclarity audit trail viewThe BaseSpace Clarity LIMS Reporting data sources access 5 views:clarity reporting view, clarity in progress view, clarity dashboardview, clarity audit trail view, and clarity reagents view. Views arecreated in the BaseSpace Clarity LIMS data warehouse by thereporting service. For more detailed information, and descriptionsof the columns each view includes, see the Reporting Data ModelDocumentation PDF.Includes information pertaining to:clarity reporting viewThe clarity reporting view extracts data from 24 separate tables. Eachrow represents a step that a sample has been through, and containsdetailed sample, project, and client information. Includes informationpertaining to: Submitted SampleDerived SampleProjectClientStepProtocolWorkflowStep TechnicianContainerInstrumentQC FlagsEscalationclarity in progress viewThe clarity in progress view focuses specifically on the samplescurrently in progress in BaseSpace Clarity LIMS. Each row representsa derived sample in progress, along with the technician and status ofthe progress. Includes information pertaining to: Derived Samples in ProgressStep TechnicianStep Statusclarity dashboard viewThe clarity dashboard view contains data similar to that displayedin the BaseSpace Clarity LIMS Overview dashboard. Each rowcontains a submitted sample that is active in the LIMS. It includesinformation about the protocol and workflow in which each sampleis currently queued, and the client and project the sampleis associated with. Includes information pertaining to: Audit EventsAudit ChangesEvent TypesChange TypesApplication NameApplication Typeclarity reagents viewIncludes information pertaining to: StepReagent KitReagent LotKit SupplierLot Expiry DateData sourcesData sources are the reporting depictions of single or combinationsof views. The data sources included in the Reporting Module aredescribed in the documentation available (Figure 3).ClarityReporting Reagents Data SourceThe ClarityReporting Reagents data source forms the basis for mostreports. The data source is created by combining the clarity reportingview and the clarity reagents view, both of which are defined withinthe LIMS Database.This data source counts the number of steps completed by a sample.It is used for calculating turnaround time, client account information,reagents, and container details. This data source does not includeUDFs, or audit trail information. The ClarityReporting Reagentsdata source contains 3 prebuilt hierarchies (for workflow, project,and reagent). These allow the report user to drill down into thereport details and examine the data at a more granular level.BaseSpace Clarity LIMS Reporting can connect directly to theClarityReporting Reagents data source without the need tomake any joins or filter any data.Submitted Samples assigned to a workflowWorkflowProtocolClient AccountClientFigure 3: A Small Subset of Data Sources from BaseSpace Clarity LIMSReporting ModuleFor Research Use Only. Not for use in diagnostic procedures.
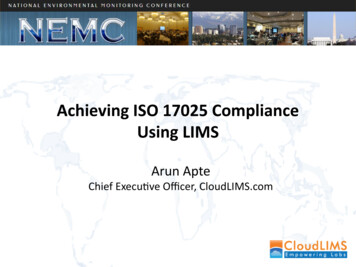
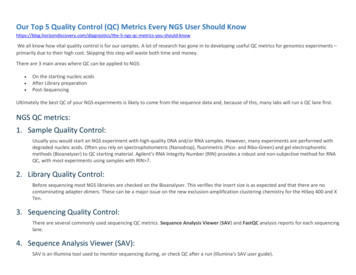
Design Content Prepare Library Sequence Analyze DataData Sources Mapped from ViewsEscalations ReportAdditional data sources are available as 1:1 mappings and canbe used when creating reports and worksheets from multiple datasources and views.The Escalations report focuses on samples escalated for managerreview in Lab View. The report displays escalations based on project,technician, and timeline. This report is made up of 3 sections:Escalations by Project, Escalations by Technician, andEscalation Trends (Figure 4).For detailed information on these data sources, see the ReportingData Model Documentation PDF.3Reagents ReportRefreshing Data in Data SourcesThe Reagents report focuses on reagent use and is helpful whentroubleshooting problems related to sample quality. One of thepossible causes of poor-quality results can be a bad reagent lot.With this report, users can quickly identify all samples that wereexposed to a particular reagent lot number.There are 2 major phases that occur when refreshing the datainside a data source. The first is the transfer of data from theLIMS Database to the data warehouse. By default, the ETLService performs this transfer every night at midnight. Theexception to this rule is the in-progress data and thedashboard data, which update every 5 minutes.Users can also use this report to help manage reagent supply. Thereport indicates the number of times a particular reagent has beenused, and how many active lot numbers are in the LIMS.The second phase involves extracting the data from the datawarehouse and transferring it to the BaseSpace Clarity LIMSReporting Module. By default, this happens every weekdaymorning at 4:00 AM. Users with the proper privileges canmodify these defaults. Also, you can refresh either phaseon an as-needed basis with the BaseSpace Clarity LIMSReporting Module.This report is made up of 3 sections: Samples per Reagent,Reorder Reagents, and Reagents and Samples (Figure 4).Sequencing ReportThe Sequencing report provides lab managers with an understandingof sequencing runs completed, samples sequenced, and instrumentsused. It allows you to interrogate sequencing runs using filters for rundate, container type, instrument type, and instrument name.Preconfigured ReportsThe Reporting Module includes preconfigured reports that weredesigned to capture some of the most common data in which a labwould be interested. These reports can be used as they are or youcan modify them to fit a lab’s specific needs.This report is made up of 3 independent reports: Sequencing Steps,Samples per Container, and Sequencing per Run Date (Figure 4).Project Management ReportSample History ReportThe Sample History report summarizes information about a singlesample or a small group of samples. This information is presentedas a dashboard that compiles information from several independentreports. It includes information about the project, reagents, and steps.Users can filter the report by client account, project, and submittedsample name (Figure 4).Sample HistoryEscalationsInformation presented in the Project Management report is similarto the information shown in the Overview dashboard. However, thisreport lets users filter the data based on client account, project name,project client, and workflow assigned. The charts are color-coded byproject. This report shows only open and active projects in your LIMS.This report is made up of 2 sections: Workflows by Projectand Protocols by Project (Figure 4).ReagentsFigure 4: A Sampling of Preconfigured ReportsFor Research Use Only. Not for use in diagnostic procedures.SequencingProject Management
Design Content Prepare Library Sequence Analyze DataIn Progress ReportTurnaround Time ReportThe In Progress report allows you to see all steps in progress, samplesin progress, and the technicians currently working on samples. Thisreport is made up of 2 sections: Steps in Progress and Samples inProgress (Figure 5).Lab managers of a commercial or core lab need to track the timebetween sample arrival to sending results to clients for individualprojects or samples, and for a batch of projects or samples. Theymay also need to calculate the average turnaround time of all projectsor samples in a given time period (Figure 5).Steps Completed ReportThe Steps Completed report displays the number of steps eachsample has completed in the LIMS, per project. The report graphsthe number of distinct step IDs associated with each project.An increased number of steps may indicate that samples needed tobe reworked or requeued. Highlighting these increases can help usersto identify potentially problematic steps, protocols, and samples, andfix any inefficiencies (Figure 5).Top Projects ReportThe Top Projects report displays the top number of projects basedon the number of submitted samples that have completed at least 1step in the LIMS. The report graphs the number of distinct submittedsample IDs associated with each project.This visualization allows lab managers and directors to identify thetop projects in their labs, over a particular date range or for a particularclient account (Figure 5).NOTE: The Turnaround Time Report is also available for examiningthe amount of time it takes to complete steps in the LIMS.Audit Trail ReportThe Audit Trail IT and lab managers need to show auditors everythingthat has occurred in the LIMS Database over a given time period, for aspecific sample or for a particular database.While the Audit Trail feature in the LIMS tracks this information,the Audit Trail- Events and Audit Trail- Change reports allows labmanagers to interrogate the audit events and audit change tablesbased on many factors, at a granular level.The Audit Trail - Events report tracks all events that occur in the LIMS.The Audit Trail - Change report tracks all changes that occur in theLIMS (Figure 5).Top Workflows ReportThe Top Workflows report displays the top workflows based onthe number of submitted samples assigned to the workflow thathave completed at least 1 step in the LIMS. The report graphs thenumber of distinct submitted sample IDs associated with eachworkflow (Figure 5).This visualization allows lab managers and directors to identify the topworkflows in their labs, over a particular date range or for a particularclient account.In ProgressThe Turnaround Time by Client or Project graphs the averageturnaround time associated with each project. The report includesautomatic calculations and averages for turnaround time based onclient account or project.StepsFigure 5: A Preconfigured Sampling of ReportsFor Research Use Only. Not for use in diagnostic procedures.Container View ReportThe Container View report is based on the contents of a container.This view allows you to see the contents of a specific container,including the sample names and the date that derived samplesin the container were created (Figure 5).Top ProjectsTop Workflows
Design Content Prepare Library Sequence Analyze DataSystem RequirementsUDF Map ReportThe UDF Map reports show how UDF names in the LIMS map tothe field names used in the Reporting Module (Figure 5). The reportsmay be used to help decipher truncated UDF names. 7 reports areprovided: Sample UDF MapProject UDF MapAccount UDF MapClient UDF MapContainer UDF MapStep UDF MapOutput (Artifact) UDF Map The UDF name used in the LIMS(column name: BaseSpace Clarity LIMS Name)The UDF alias created for reporting purposes(column name: Reporting Alias)The name of the udf pivot view that contains each UDF(column name: Pivottable)The unique ID for each UDF(column name: Udfid)Editing and Creating ReportsUsers with the appropriate permissions can create new reports,duplicate reports, and rename reports, directly from the user interface.In addition, there are a wide variety of components that users canmodify to make sure that each report displays the data of interest.Comprehensive documents for creating and editing reports can befound on Zendesk and accessed through the online help availablefrom Tableau.Licensing for the Reporting ModuleThe BaseSpace Clarity LIMS Reporting Module comes with 2named licensed. Users and organizations can purchase additionallicenses at any time. Reporting Module Pro comes with 1 additionallicense. Full documentation on accessing and logging on to theReporting Module is included in the BaseSpace Clarity LIMS ReportingModule Documentation.4Turnaround TimeThe prerequisites described must be in place before the BaseSpaceClarity LIMS Reporting ETL Service can be installed and used. If usershave a hosted implementation of BaseSpace Clarity LIMS Reporting,the BaseSpace Clarity LIMS Support team will perform any stepsrequired to meet these prerequisites.Client and Server Systems Meet BaseSpaceClarity LIMS RequirementsReporting is supported on BaseSpace Clarity LIMS versions 3.5.9,4.0.12, 4.1.4, 4.2.4, and later.The following columns of information are included in each report: ETL Service RequirementsUsers need to make sure that your system meets the requirementsdescribed in the BaseSpace Clarity LIMS Technical Overviewdocument for the version of BaseSpace Clarity LIMS (located inthe Technical Requirements forum of the LIMS documentation).5NOTE: The BaseSpace Clarity LIMS Reporting Module supports RedHat and CentOS operating systems only. The SUSE operating systemis not supported.An Empty Database/Schema is Availablefor the Reporting Data WarehouseBaseSpace Clarity LIMS Systems with a PostgreSQL Database:Make sure that a new database has been created and configured onthe server designated for reporting.BaseSpace Clarity LIMS Systems with an Oracle Database: Makesure that an empty schema has been created and configured on yourdatabase server designated for reporting.In addition to the new database/schema, a new database user isrequired. This user will be used by the ETL Service and will have fullread/write access to the database/schema. Instructions for configuringuser access and permissions are provided in the BaseSpace ClarityLIMS Reporting Installation Guide.6 The reporting integration populatesthis database/schema at run time.Audit TrailFor Research Use Only. Not for use in diagnostic procedures.Container ViewUDF Maps
Design Content Prepare Library Sequence Analyze DataThe database/schema: Can be on the same server as the current Clarity LIMS Database.Must not be the same database/schema used by Clarity LIMS.Requirements for BaseSpace ClarityReporting Module and ProBaseSpace Clarity LIMS integrates with Tableau Server and TableauDesktop to provide BaseSpace Clarity LIMS Reporting Module andBaseSpace Clarity LIMS Reporting Pro.NOTE: The requirements listed in this section are based on TableauServer requirements and recommendations. See Minimum HardwareRequirements and Recommendations for Tableau Server.BaseSpace Clarity LIMS Reporting Module: Server Requirementsand Recommendations Microsoft Windows Server 2008 SP2 with platform update,2008 R2, 2012, or 2012 R2; Windows 7, 8, 8.1, or 10 on x86or x64 chipsets 64-bit versions of Windows Minimum of Intel Pentium 4 or AMD Opteron processor 32-bit color depth recommended Internet Protocol version 4 (IPv4) Internet connection speed:Minimum: 100 Mbps Ethernet network or fasterRecommended: 1 Gbps Ethernet network or faster No server application such as Internet Information Services (IIS)web server should be installedMinimumThe minimum specifications listed are suggested for prototyping andtesting of BaseSpace Clarity LIMS Reporting Module only. The installerchecks for these minimum system requirements and will not proceedon computers with less than the hardware minimums.64-bit computers Windows Microsoft Windows Vista SP2 or later (64-bit) Microsoft Server 2008 R2 or later (64-bit) Minimum of Intel Pentium 4 or AMD Opteron processor (SSE2or later required) 2 GB memory Minimum 750 megabytes free disk space Internet Explorer 8 or laterMac iMac/MacBook 2009 or later OS X 10.9 or laterSupport and DocumentationSupport is provided through the BaseSpace Clarity LIMS Team. Fulldocumentation is available on Zendesk after licenses are acquired.Learn MoreTo learn more about the BaseSpace Clarity LIMS Reporting Module,contact informatics@illumina.com.References1.L. How Lab Analytics for the Whole Lab Works Lab Manager.Lab Manager. cs-for-the-whole-lab#.v2nuquyrkaw. Accessed October14, 2016.2.The Forrester Wave: Big Data Hadoop Solutions, Q1 2014.Forrester. https://www.forrester.com/report/The Forrester Wave Big Data Hadoop Solutions Q1 2014/-/E-RES112461.Published February 27, 2014. Accessed October 14, 2016.3.GenoLogics Customer Support. GenoLogics Customer erence-guide. AccessedOctober 14, 2016.4.GenoLogics Customer Support. GenoLogics Customer erence-guide. AccessedOctober 14, 2016.5.GenoLogics Customer Support. GenoLogics Customer 13972063-claritylims-4-0-technical-overview. Accessed October 14, 2016.6.GenoLogics Customer Support. GenoLogics Customer /201689323clarity-lims-reporting. Accessed November 10, 2016.4 cores8 GB system memory15 GB minimum free disk spaceRecommendedThe minimum configuration recommended for production usage ofBaseSpace Clarity LIMS Reporting Module is based on: BaseSpace Clarity LIMS Reporting Pro:System RequirementsSingle computer64-bit processor8 physical cores, 2.0 GHz or higher CPU32 GB system memory200 GB minimum free disk space on a second driveNOTE: Core count is based on ‘physical’ cores. Physical cores canrepresent actual server hardware or cores on a virtual machine (VM).Hyperthreading is ignored for the purposes of counting cores. ForBaseSpace Clarity LIMS Reporting Module running on a 64-bit virtualmachine, you will need a minimum of 4 physical cores.Illumina 1.800.809.4566 toll-free (US) 1.858.202.
Clarity LIMS Database on its server and published to the Windows Tableau Server. When the ETL service runs, it extracts data from the BaseSpace Clarity LIMS Database and stores them in a separate database, the data warehouse. A configuration file connects the data warehouse to the Windows Server on which Tableau resides. Tableau