Transcription
STRYKERKevin A. Lobo,Chairman and Chief Executive OfficerJanuary14, 2015
FORWARD LOOKINGSTATEMENTCertain statements made in the presentation may contain information that includes or is based onforward-looking statements within the meaning of the federal securities law that are subject tovarious risks and uncertainties that could cause our actual results to differ materially from thoseexpressed or implied in such statements. Such factors include, but are not limited to: weakening ofeconomic conditions that could adversely affect the level of demand for our products; pricingpressures generally, including cost-containment measures that could adversely affect the price of ordemand for our products; changes in foreign exchange markets; legislative and regulatory actions;unanticipated issues arising in connection with clinical studies and otherwise that affect U.S. Foodand Drug Administration approval of new products; changes in reimbursement levels from thirdparty payors; a significant increase in product liability claims; the ultimate total cost with respect tothe Rejuvenate and ABG II matter; the impact of investigative and legal proceedings andcompliance risks; resolution of tax audits; the impact of the federal legislation to reform the UnitedStates healthcare system; changes in financial markets; changes in the competitive environment; ourability to integrate acquisitions; and our ability to realize anticipated cost savings as a result ofworkforce reductions and other restructuring activities. Additional information concerning these andother factors is contained in our filings with the U.S. Securities and Exchange Commission,including our Annual Report on Form 10-K and Quarterly Reports on Form 10-Q.A copy of this presentation will be available for 90 days on the Events &Presentations page of the For Investors section of our website at www.Stryker.com.2
MISSIONTOGETHER WITH OUR CUSTOMERS,WE ARE DRIVENMISSIONTO MAKE HEALTHCARE NCE3
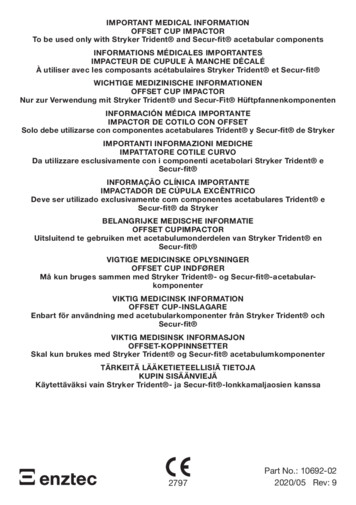
GLOBAL MEDTECH LEADER Pursuing global marketleadership in threesegmentsNeuro tainabilitySolutions 2% Growing throughbusiness unitspecializationKnees14%Hips13%2014 SalesMedical8% 9.7BTrauma &Extremities13%Endoscopy14%Other3%Instruments15%4
HISTORY OF PERFORMANCE109876543210 9.7BSales ( B)7914Adjusted Diluted Net EPS* ( )6.005.004.003.002.001.000.003.944.304.494.72 – 4.74Dividends Paid Per Share ( 21314* Non-GAAP financial measure. See the reconciliation of GAAP Diluted NetEarnings Per Share to Adjusted Diluted Net Earnings Per Share in the appendix.5
GROWTH AT THE HIGHEND OF MEDTECH7.0%Organic Revenue Growth*5.8%6.0%5.1%5.0%4.2%4.0%3.0%2.6%2.4% 2.6% - 2.8%2.0%1.0%0.0%2012MedTech Market**20132014Stryker* Organic revenue growth removes the impact of changes in foreign currency exchange rates,divestitures and the first twelve months of acquisition sales that affect the comparability andtrend of sales.**MedTech market growth is based on Company research of 20 companies6
ORTHOPAEDICSKEY GROWTH DRIVERS Drive market adoption of robotic arm assisted surgery Expand portfolio and specialty selling teams in highgrowth segments Drive Power Brands Geographic expansion with the Trans-Atlanticoperating model7
DRIVING DIFFERENTIATIONRIO SYSTEM PLACEMENTS4Q131Q142Q143Q144Q1413*26820* 5 sold after acquisition closed on December17th2015 PORTFOLIO EXPANSION Cementless uni knee limited release Total Knee 510(k) submitted and pending Hip Power Brands X3 poly bearingsIMPROVED OUTCOMES Procedure advancement Improved patient experience Implant innovation8
MEDSURGKEY GROWTH DRIVERS Ramping of key acquisitions (Berchtold, Pivot,SurgiCount, and CHG Hospital Beds) Execution of Trans-Atlantic operating model Continue momentum of our reprocessing business Continue market expansion of Neptune WasteManagement System9
NEUROTECH & SPINEKEY GROWTH DRIVERS Ischemic market expansion aided by recentpositive clinicals Leverage cross-divisional strength to gain share Expand sales force in key business units &geographies Spine portfolio development focused on growthsegments and premium products10
ACCELERATING GLOBALGROWTH Strong U.S. ets8%2014 Sales 9.7BUnited States68% Build on Europeanmomentum with theTrans-Atlantic operatingmodel Trauson expandingoutside of China11
FOCUSED ON INNOVATION Demonstrating commitmentto internal innovation Driving innovation withproducts and services 11%3 Year CAGRR&D* Focused on improved outcomes & deliveringgreater cost savings/efficiencies* 3 year CAGR is for periods 2011 - 201312
OPERATING LEVERAGEINITIATIVES Amplify the GQ&O cost reduction program Reduce inventories through product rationalization Drive SG&A savings via Shared Services Simplify and rationalize our Information Technologyfootprint13
CONTINUED STRENGTHTHROUGH M&AAscentConcentricPorexOtisMed2009Patient mometal2012SurpassSonopetNeurovascularPivot Medical2013CHG Hospital Beds2014MAKO2015Small BoneInnovationsBerchtold Holding Targeting core and key adjacent marketsCore Business Accelerate our top line, drive innovationAdjacency14
BALANCE SHEET STRENGTH( MILLIONS)Cash & Short-Term InvestmentsNet Cash*Shareholders’ EquityNet Cash / Shareholders’ Equity9/30/20144,6777158,624 Approximately 2/3 of cash heldoutside the United States at9/30/2014 Planned cash repatriation of 2B USD, most of which willoccur in the back half of 20158%* Net Cash Total Cash & Short-Term Investments less Debt15
CAPITAL DEPLOYMENT M&A to drive sales growth and innovationFocused on driving sales growth in core and adjacent marketsGuidelines: - generally to exceed cost of capital by year- target 12.5% IRR Dividend growthDividend CAGR of 20% since 2010Committed to increasing the dividend at or above EPSM&A 3.3BShareRepurchases 0.5B Share repurchasesResidual share buybacks over timeimpacted by M&A timingDividends 1.1B2012–2014*CapitalDeploymentHistory* Through 9/30/201416
2014 Preliminary ResultsFY2014 5.8%Organic sales growth 4.72 – 4.74Adjusted diluted net earnings per shareFY2015 FX Outlook 0.20Negative impact to 2015 AdjustedEPS, if rates stay at current levelsThis has nearly doubled since the 0.10to 0.12 estimate at the end of Q3, 201417
STRYKER ADVANTAGE Strength in key hospital segments Focused on innovation Accelerating global growth Opportunities to drive meaningful operational leverage Balance sheet strength18
STRYKERAppendix19
NON-GAAP FINANCIAL MEASURESWe supplement the reporting of our financial information determined under accountingprinciples generally accepted in the United States (GAAP) with certain non-GAAP financialmeasures, including percentage sales growth in constant currency; percentage organic salesgrowth; adjusted gross profit; cost of sales excluding specified items; adjusted selling, generaland administrative expenses; adjusted intangible amortization; adjusted operating income;adjusted effective income tax rate; adjusted net earnings; and adjusted diluted net earnings pershare (EPS). We believe that these non-GAAP measures provide meaningful information toassist investors and shareholders in understanding our financial results and assessing ourprospects for future performance. Management believes percentage sales growth in constantcurrency and the other adjusted measures described above are important indicators of ouroperations because they exclude items that may not be indicative of or are unrelated to our coreoperating results and provide a baseline for analyzing trends in our underlying businesses.Management uses these non-GAAP financial measures for reviewing the operating results ofreportable business segments and analyzing potential future business trends in connection withour budget process and bases certain management incentive compensation on these non-GAAPfinancial measures.To measure percentage sales growth in constant currency, we remove the impact of changes inforeign currency exchange rates that affect the comparability and trend of sales. Percentagesales growth in constant currency is calculated by translating current year results at prior yearaverage foreign currency exchange rates. To measure percentage organic sales growth, weremove the impact of changes in foreign currency exchange rates and acquisitions that affectthe comparability and trend of sales. Percentage organic sales growth is calculated bytranslating current year results at prior year average foreign currency exchange rates excludingthe impact of acquisitions.To measure earnings performance on a consistent and comparable basis, we exclude certainitems that affect the comparability of operating results and the trend of earnings. Theseadjustments are irregular in timing, may not be indicative of our past and future performanceand are therefore excluded to allow investors to better understand underlying operating trends.Adjustments may include, but are not limited to, the following: Acquisition and integration related costs. These adjustments include costs related tointegrating recently acquired businesses and specific costs related to the consummation ofthe acquisition process. Amortization of intangible assets. These adjustments represent the periodic amortizationexpense related to purchased intangible assets. Restructuring and related charges. These adjustments include costs associated with focusedworkforce reductions and other restructuring activities. Rejuvenate and recall matters. These adjustments are our best estimate of the minimum ofthe range of probable loss to resolve certain product recalls, including the recall ofRejuvenate / ABG II modular-neck hip stems and certain matters pertaining to the recall ofthe Neptune Waste Management System. Regulatory and legal matters. These adjustments represent our best estimate of theminimum of the range of probable loss to resolve certain regulatory matters and other legalsettlements. Tax matters. These adjustments represent certain discrete tax items and adjustments tointerest expense related to the settlement of certain tax matters.Because non-GAAP financial measures are not standardized, it may not be possible tocompare these financial measures with other companies' non-GAAP financial measureshaving the same or similar names. These adjusted financial measures should not be consideredin isolation or as a substitute for reported sales growth, gross profit, cost of sales, selling,general and administrative expenses, intangible amortization, operating income, effectiveincome tax rate, net earnings and diluted net earnings per share, the most directly comparableGAAP financial measures. These non-GAAP financial measures are an additional way ofviewing aspects of our operations that, when viewed with our GAAP results and thereconciliations to corresponding GAAP financial measures at the end of the discussion ofResults of Operations below, provide a more complete understanding of our business. Westrongly encourage investors and shareholders to review our financial statements and publiclyfiled reports in their entirety and not to rely on any single financial measure.20
RECONCILIATION OF GAAPTO NON-GAAP RESULTS2014Range(Per Share Amounts)201120122013Diluted Net Earnings per Share 3.45 3.39 2.63 1.28 1.37Acquisition and integration related charges0.370.090.190.170.17Amortization of intangible assets0.220.230.260.350.35Restructuring and related charges0.160.150.120.210.21Regulatory and legal matters-0.090.17Rejuvenate and recall 2 4.49 4.72 4.74Tax mattersAdjusted Diluted Net Earnings per Share 3.94 4.301.691.62--21
the Neptune Waste Management System. Regulatory and legal matters. These adjustments represent our best estimate of the minimum of the range of probable loss to resolve certain regulatory matters and other legal settlements. Tax matters. These adjustments represent certain discrete tax items and adjustments to


![WELCOME [s22.q4cdn ]](/img/21/nvidia-2018.jpg)