Transcription
Interstate Differences in Pension Vesting Rules and K-12 Teacher ExperienceLeslie E. PapkeMichigan State Universitypapke@msu.eduDaniel Litwok*Michigan State Universitylitwokda@msu.eduPrepared for theNational Tax Association106th Annual Conference on TaxationNovember 21-23, 2013Session entitled “Local Fiscal Sustainability and Pensions”AbstractPublic sector pensions have gained wide attention recently due to concerns about financialsustainability and state fiscal health. Several states have enacted reforms in an effort to reducetheir future pension obligations but 98 percent of teachers continue to be covered by definedbenefit plans. While these plans’ strong retirement incentives have been the focus of muchresearch, we focus on important interstate differences in teacher pension opportunities acrossstates in the early years of a teacher’s career. Unique among public sector workers, a state’s K12 teacher workforce age and experience may have implications for the educational attainmentof a state’s workforce. We illustrate state differences in the actuarial present value of a teacher’spension wealth with different experience levels and salary. Second, we examine the correlationbetween state vesting rules with the age and experience distribution of a state’s teacherpopulation. Using cross section aggregate data, we find that pension characteristics relevant tothe early years of a teacher’s career influence the fraction of younger teachers in a state.*Litwok acknowledges support from Institute of Education Sciences Grant R305B090011 toMichigan State University. The opinions expressed are those of the author and do not representthe views of the U.S. Department of Education.
I. IntroductionThe funding of public pension systems has become a source of significant stress on statefinancial systems. Actuarial valuations from state financial reports estimate a total ofapproximately 325 billion in unfunded liabilities, which the literature considers to be anunderestimate due to unrealistic actuarial assumptions (Doherty et al. 2012; Novy-Marx andRauh 2011). Minor reforms to teacher pension systems have attempted to alleviate some fiscalstress by increasing vesting requirements and raising teacher and employer contributions.1 Theseparameter changes have implications not only for state budgets but for the age and experiencedistribution of K-12 teachers in a state.While the private sector has moved to defined contribution plans, and pension reform hasmade some inroads in public plans for general government workers, 98 percent of K-12 teacherscontinue to be covered by defined benefit plans with influential pension accrual patterns andlimits to portability. Unique among public sector workers, a state’s K-12 teacher workforce ageand experience may have implications for the educational attainment of a state’s workforce. Theaccrual pattern in pension wealth may affect a district’s ability to attract younger, more mobileteachers or individuals from the private sector changing jobs mid-career.In this paper we focus on vesting rules, portability through service credits, and pensionwealth differences across states for teachers in the early years of their career. Pension vestingrules have received little attention in the literature, yet they may have unintended effects on newteacher retention or teacher preferences for shorter-term employment. For example, recently theNew York State Teachers’ Retirement System changed the vesting requirement from five yearsto 10 years for new teachers. Additionally, they now require the teacher to contribute to his orher pension for the length of active membership, as opposed to only the first ten years of1
employment. Similar reforms to pension parameters were made in Florida, Illinois, Michigan,and Texas. These changes reduce the incentive for new teachers to stay in teaching for severalyears. Restrictions across state borders on purchasing credits may also reduce young teachermobility. Yet these early years of teaching are critical for teacher effectiveness. Several recentstudies have found that new teachers are less effective than those with some experience.2We illustrate the magnitude of these differences across four states with different vestingrules. We construct the actuarial present value of pension liability (or, wealth from the teacher’sperspective) that is commonly used in valuing pensions for legal matters, such as QualifiedDomestic Relations Orders following divorce.3 This termination liability, or accrued benefitobligation, is a measure of the pension liability owed at different points through a teacher’scareer should she separate from service.4The next section briefly reviews the literature on mobility and retirement effects ofdefined benefit plans with an emphasis on teacher pensions. In section III we discuss ourcalculations of individual teacher pension wealth and compare wealth for teachers at differentlevels of experience across four states as an illustration. Section IV provides preliminaryevidence that these interstate differences in pension vesting rules may affect the distribution ofteacher experience across states. There is a brief conclusion.II. Related LiteraturePrevious studies of mobility and pension wealth focus on retirement incentives at the endof the career for public sector workers. Friedberg (2011) reviews retirement and mobilityimplications of defined benefit plans and the related literature for public employees and teachersin particular. She finds that defined benefit pension incentives play a significant role in the2
timing of one’s retirement from the labor market. However, she notes that empirical evidenceregarding the predicted reduced mobility of younger workers with defined benefit plans issuggestive, but not definitive. Using the Survey of Consumer Finances (SCF) data from 1983,Friedberg and Owyang (2002) find that private sector workers with a defined benefit pensionhave total expected tenure that is 5-7 years longer on average than workers without any pensions,but that workers with defined contribution plans also have longer tenure than workers withoutpensions. Using the CPS and Public Plans Database, Munnell et al (2012) find that theprobability of remaining with a single plan until earliest normal retirement eligibility is reducedif the employee also has a defined contribution plan and is covered by Social Security.Prior work that has focused specifically on teacher retirement incentives associated withdefined benefit plans includes Friedberg and Turner (2010), Friedberg and Turner (2011),Furgeson, Strauss, and Vogt (2005), and Costrell and Podgursky (2009). This literaturedescribes the incentives created by the defined benefit programs and provides state-specific andnational studies of teacher response to these incentives. For example, there was a large increasein teacher retirement in Pennsylvania from 1997-1998 to 1998-1999 in response to moregenerous retirement benefits (Furgeson, Strauss, and Vogt, 2005).A related literature on the retirement incentives imbedded in Social Security benefitsexamines the effect of the peak value of benefits on retirement. The peak value conceptsubtracts current pension wealth from the peak of pension wealth that is available in the future.5Work on teacher retirement typically compares pension wealth peaks and job exit. Costrell andMcGee (2010) use administrative data from particular states to describe pension wealthdifferences. Friedberg and Turner (2011) use the Teacher Follow-Up Survey of the Schools andStaffing Survey in 2000 and 2004 (SASS). Using a peak value approach along with data on3
teacher satisfaction, they find that teachers who are dissatisfied with their jobs respond morestrongly to pension retirement incentives. Teachers who express job satisfaction still respond toretirement incentives, but with a much smaller magnitude.A subset of the teacher retirement literature focuses specifically on cross-state variationin teacher pension wealth and provides simulation evidence of peak wealth. These calculations,like ours, use the characteristics of state pension programs to calculate the present discountedvalue of a teacher’s pension benefits under a number of different assumptions about teacher age,experience, and salary growth. Costrell and Podgursky (2009) focus on six states in theirsimulation, and show the cross-state variation in spikes in pension wealth. Toutkoushian et al.(2011) calculate a simulation for one identical career teacher in all 50 states, providing a rankingfor the most generous pension plans.6 Rather than focusing on the generosity of plans at thenormal retirement age, our simulations provide some insight into the present discounted value ofpension wealth for younger workers. We compare the magnitude of this pension wealth uponvesting across states. In addition, we improve upon earlier assumptions by using actual statestarting salaries and salary caps so that teacher salaries do not grow to unrealistic values.III. Vesting Rules and Teacher Pension WealthTo illustrate the large differences across states in early-career teacher pension wealth, weselected four states with pension plans that have different vesting rules – some as a result ofrecent changes – as well as other differences. We compare the present discounted value ofpension wealth for similarly-experienced teachers in California, Florida, Michigan, andWisconsin. Michigan requires ten years of service before a teacher is vested, while Florida onlyrequires six years. California requires five years for vesting, but teachers do not contribute to4
Social Security and are no longer allowed to retire prior to the traditional retirement age with fulllifetime benefits (Doherty et al, 2012). Prior to 2011, teachers were immediately vested inWisconsin. Now Wisconsin has a vesting rule of five years. There are differences in teachercontribution rates and the age for retirement with full benefits as well. Table 1 summarizes thesedifferences.Based on these pension plan parameter values and a number of assumptions detailedbelow, we calculate the present discounted value of pension wealth at any point in time for ahypothetical teacher. This calculation involves determining the annual pension benefit, which iscalculated as follows:Benefit Final Average Salary Factor Years of ServiceFinal average salary and the multiplicative factor are also plan specific parameters that we obtainfrom each state’s pension plan brochures. We multiply this value by the probability of survivalat each age, assuming the individual will live until age 100. Lastly, we calculate the presentdiscounted value of pension wealth using a discount rate r as follows:𝑡 100 𝐶𝑃𝐷𝑉 𝑡 0𝐴(1 𝑟)𝑡where A is the actuarial value of annual benefits, t indicates the year at which the calculation isdone, and C is the teacher’s age at the time of the calculation.We also make a number of assumptions. First, the teacher’s starting salary is the state’saverage salary for the teacher’s level of education from the 2008 Schools and Staffing Survey(SASS). Salaries grow at three percent per year until they reach the top step reported by theSASS. Once the salary reaches the top step for the state, the salary remains constant. Whileteachers typically begin contributing to the pension as soon as they begin working, if the teacherleaves before vesting, these contributions are refunded (sometimes with interest). Our reported5
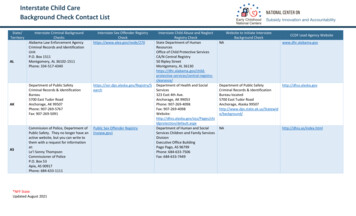
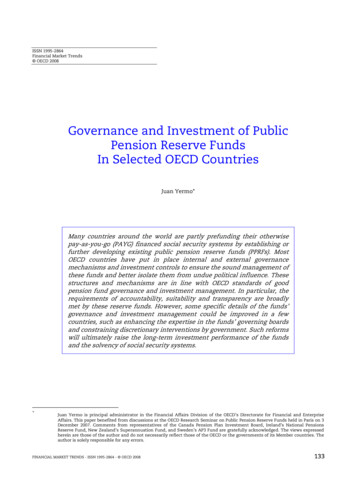
present value deducts contributions, but we omit the possible interest payments. We assume athree percent discount rate in our calculations, and use the 2008 female combined-race life tablesto estimate the probability of survival to the next year (Arias, 2012). In footnote seven weillustrate variations due to racial differences in mortality.Our calculations do not include cost of living adjustments (COLAs). In some states, suchas Michigan, cost of living adjustments are a predetermined percent of initial benefit. In otherstates, the legislature votes annually on the possibility of a COLA that year. In other plans,COLAs are linked to an inflation index with a cap. Because our focus is on the front end of ateacher’s career, and because inserting a COLA would require arbitrary and differentassumptions across states, we do not include COLAs in our empirical work. For illustration, inTable 2 we compare pension wealth estimates for Michigan teachers with and without the COLA– three percent per year (not compounded) starting in October after one full year of retirement.Clearly, cost of living adjustments can have significant effects on present discounted values forretirees who work as teachers throughout their careers (depending on actual levels of inflation).However, they make a much smaller difference early in the teacher’s career, our demographic ofinterest.Figure 1 shows our calculation of the present discounted value of pension wealth net ofcontributions over a typical teacher’s lifetime career for our illustrative states. We assume thisteacher started working at age 25 with a Bachelor’s degree and no prior experience. The ages onthe x-axis are the ages when the teacher stops teaching and stops accruing pension benefits. Thevalues on the y-axis are the present discounted values of pension wealth assuming a three percentdiscount rate and taking into account the probability of survival and salary growth as discussedabove. The shape of Figure 1 is commonly found in analyses of defined benefit pension plans.6
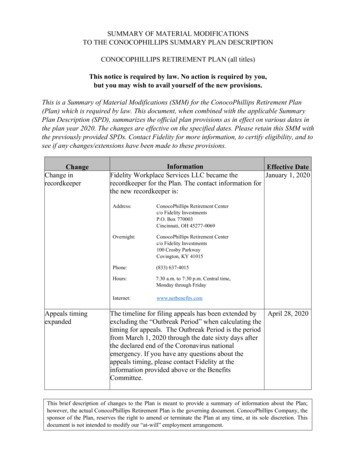
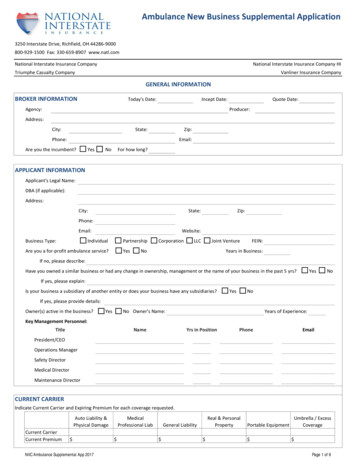
The accrual pattern of these plans creates significant jumps in pension wealth at particular agesand strong incentives to retire when wealth reaches a maximum at the plan’s normal retirementage.Our focus is on the front end of the career trajectory. In Figure 2, we zoom in on theearly years of the teacher’s career. Note the jump in pension wealth when the teacher becomesvested – at different levels of experience in the four states. While the pension formulas differwith respect to salary and pension multiplier, the cross-state variation in vesting requirementsalone accounts for timing differences in any pension wealth. Recently several states haveincreased the years required before vesting, reducing their future pension obligation but possiblywithout regard to retaining young teachers to maximize their experience and value-added tostudents.There are other factors driving the cross-state variation in Figures 1 and 2. Apart fromvesting rules, contribution rates, salary calculations, and benefit formulas also contribute to thesedifferences. For example, consider the calculation of the final average salary used in the definedbenefit formula. In Michigan and Wisconsin this number is the average of the highest threeyears of compensation, in California it is the highest consecutive twelve months, and in Florida itis the average of the highest eight years. The significantly lower present value for Wisconsin inFigure 1 occurs because of a relatively high contribution rate coupled with a significantly lowersalary. The average starting salary of 30,700 for a Wisconsin teacher with no prior experienceand a Bachelor’s degree is substantially lower than an identical teacher in the other states.Furthermore, the peak salary of 57,100 is the lowest among the four states. Wisconsin’spension plan includes a relatively high contribution rate of 6.65 percent of salary as well.7
In Table 3, we calculate pension wealth for various early stages in a teacher’s career. Fora teacher who started teaching at 25 years old with a Master’s degree, we compare the presentdiscounted value of her pension if she quits after two years, five years, and 10 years and also attypical retirement ages. Column (1) highlights interstate differences in the peak value of herpension along with the age at which the peak will occur. The remaining columns include thedifference from the peak value in parentheses. This difference is one measure of the opportunitycost of quitting or moving across state (district) boundaries in terms of pension wealth.7 If theteacher chooses to relocate across state lines she could face a similar penalty, as many teachersdo.The simulated values of pension wealth in Table 3 indicate that young teachers with adefined benefit pension earn virtually nothing toward their pension wealth before they are vested.In contrast, in the bottom row of Table 3 we also simulate the value of a young teacher’s pensionif she were contributing to a defined contribution plan, using the Michigan teacher definedcontribution plan offered to new hires as of September 2012 as an example. We assume that ateacher contributes six percent of her salary to the account with a 50 percent match rate (up tothree percent) by the employer. We further assume that this account grows at three percent peryear. Table 3 shows how defined contribution pension wealth steadily grows for this worker,even in the early years. If a teacher quits after two or five years she still earns a sizable amountof pension wealth if she participates fully in this defined contribution plan.8IV. Pension plan characteristics and the distribution of teacher experienceIn this section, we analyze the relationship between two key pension plan characteristics thataffect a teacher’s early career and the distribution of teacher experience across 50 states. In addition topension plan characteristic data from the 59 largest teacher plans for the 50 states, we add data from the8
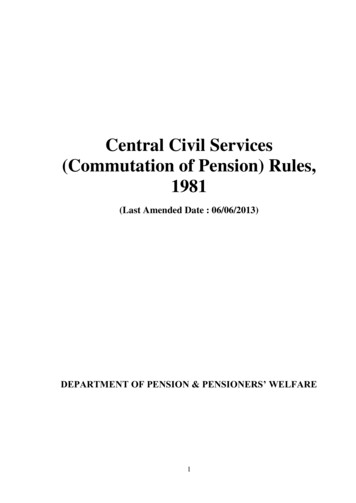
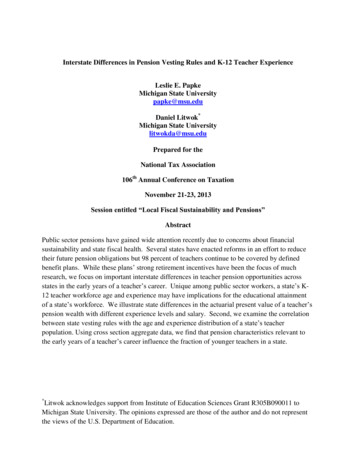
2008 SASS on starting salary and the experience distribution across states. The SASS provides thefollowing experience categories: fewer than four years of experience, between four and nine years, 10 to14 years, and 15 plus. Table 4 provides summary statistics that highlight the cross-state variation in theexperience distribution of teachers, vesting requirements, the ability to purchase service credits, andstarting salary. These statistics show that almost 19 percent of teachers in the sample have less than fouryears of experience and almost 27 percent have between four and nine years.The sizable number of low-experience teachers is evident in national data as well. InFigure 3 we use the tenure of teachers in the National Longitudinal Survey of Youth of 1997(NLSY97) to illustrate this point.9 We plot the current tenure (in years) of 560 individualsidentified as teachers. We can see that the great majority of these young teachers have notreached the threshold of five (or ten) years of service required to vest in most state pension plans.If these individuals choose to change careers or move to a different state, they will receive nopension for their early years of work. In future work, we will focus on the behavioral responseof these young teachers to cross-state variation in pension vesting rules.A second pension plan characteristic affects portability of benefits once vested. Definedbenefits may not be fully portable across states or sometimes even within the same state. That is,when a teacher changes school systems, he or she may be able to accrue continued service in thesame plan. If not, some plans allow for the purchase of service credits that reflect previouspublic sector employment. Arrangements vary across plans, however, in the types and amountsof creditable service allowed, and the cost and payment options. For our empirical work, wecode the reported provisions into a dummy variable indicating typical purchase of creditsallowed versus none or limited purchase of prior service credit. This is certainly anoversimplification of these rules, but we save the refinement for future work.9
Table 5 reports results from a regression of the state-level experience categories on pensioncharacteristics to see if pension characteristics that affect the early career are related to thedistribution of new teachers. We focus on years until vesting and the ability to purchase creditsin a new district/state. We also include as controls the average age among teachers in the stateand the natural logarithm of the starting salary for a teacher with no prior experience. In the firstpanel – percentage of teachers with less than four years of full time teaching experience – thevesting coefficient of -.455 (p-value .062) suggests that for each additional year of waiting timerequired until any pension wealth is owned, a state will have almost half a percent fewer newteachers. A vesting period of 5 years is common – 37 of these 59 largest public plans requirefive years. Those states will have two percentage points fewer teachers in early career stages.Eleven states require 10 years – they are predicted to have 4.6 percentage points fewer newerteachers – more than one standard deviation in the mean of this variable. Vesting rules do nothave a statistically significant effect on the percentage of teachers with four to nine years ofexperience – many of these are already vested and the rest are close.10 Years to vesting ispositively related to the percentage of teachers with 10 to 14 years experience – since thesepercentages sum to 100 the vesting coefficients must be of opposite sign at some point, andvesting cannot have any influence at this point in their career. This cohort is vested near midcareer.Credit purchasing does not appear to affect the distribution of teacher experience. Inregressions not reported here, it did not affect the distribution of teacher tenure either. It may bealso that there is not sufficient variation in this variable to get an accurate estimate with only 59observations – 90 percent of plans in this sample allow for credit purchases. Also note thathigher starting salaries do appear to increase the percentage of younger teachers (by 4.8 and 13percentage points for the two youngest categories).10
V. ConclusionThis paper adds to the literature on the incentives created by teacher pension benefits byfocusing on the early career, specifically the incentives created by vesting requirements. Oursimulations of pension wealth at various points throughout a teacher’s career show the variationacross four states in the initial jump in pension wealth that occurs upon vesting. Furthermore, weprovide cross-sectional evidence that the incentives created by vesting requirements are havingimpacts on the distribution of the teaching labor force. Future work will focus on individualteachers’ behavioral responses to these incentives. Specifically, do young teachers adjust entryand exit decisions in the teaching profession in response to changes in pension wealth? Giventhe vital role that teachers have in educating the future workforce, we can also try to understandif these labor market responses are affecting the educational outcomes of students.11
Endnotes1See the National Conference on State Legislatures’ annual review of pension and retirementplan enactments.2For an overview, see Rice (2010), and for individual studies see Kane, Rockoff, and Staiger(2006), Ladd (2008), Sass (2007).3Papke thanks Robert Raasche for providing detailed information about these arrangements.4This is similar to the accrued benefit obligations emphasized in Rauh (2010).5Coile and Gruber (2007) use peak value to measure Social Security incentives and Friedbergand Webb (2005) use data from the Health and Retirement Survey for individuals aged 50 andover.6Because of the large scope of this simulation, they only present results for one type of teacherwho spent their entire career in the teaching profession with no salary cap. In addition, theyassume one starting salary across all states and a salary growth rate of 3 percent with no cap.These assumptions result in six figure final salaries for lifetime teachers.7We can incorporate race into our calculations. If the teacher is white, the highest value of herpension (from Table 3) in California, Florida, Michigan, and Wisconsin, respectively, would be 693,921, 684,392, 666,664, and 372,561. If she is black these values would be 638,249, 634,157, 614,999, and 342,051.8Some states allow teachers to purchase credits from their new district if they have previousexperience as a teacher. We account for this in our regression analysis.9The NLSY97 is a longitudinal survey of individuals age 12 to 16 that began in 1997. In Figure3 we use the 2008 wave of the survey, when most respondents are between 23 and 27 years old.We identify teachers by using the industry and occupation variables that describe currentemployment.10Papke (2004) finds that quit rates in public employment drop off steeply right before vesting.12
Table 1. State Teacher Pension Parameters.Salary (Bachelor’s,Experience 0)StateRetirementRuleFactorCalifornia60/51.4% to 2.4%, 40,100depending onage atretirement 75,4008%No1.6% 33,300 60,8003%Yes1.5% 34,200 66,700 510 6.4%of anyincome over 15,000Yes1.6% 30,700 57,1006.65%YesVesting 5FAS highestyear salaryFlorida62/6, A/30SalaryContribution Covered bySocial(Top Step) RateSecurity?Vesting 6FAS averageof highest 8yearsMichigan60/10, 46/30Vesting 10FAS averageof highest 3yearsWisconsin65/5, 57/30Vesting 5FAS averageof highest 3years13
Source: SASS and state-specific handbooks detailed below.California: CALSTRS 2013 Member Handbook (available at ments/memberhandbook2013 web v4.pdf)Florida: Florida Retirement System Pension Plan Summary Plan Description (available at chigan: Michigan Public School Employees Retirement System Member Handbook (available athttp://www.michigan.gov/documents/MPSERS1 92795 7.pdf)Wisconsin: Wisconsin Retirement System Benefit Handbook (available at http://etf.wi.gov/publications/et2119.pdf)Note: Retirement rule provides the minimum age and minimum years of service required for full retirement benefits. This is writtenas a fraction: minimum age/minimum years of service. “A” implies full retirement benefits at any age (provided the teacher has theminimum years of service). FAS stands for Final Average Salary.14
Table 2StateMichiganNo COLAMichiganWithCOLACost of Living AdjustmentsPeakQuit After 10Retire at 55Retire at 60Retire at 65ValueYears 457,10148,963457,101443,489399,078Age 55(-408,138)(0)(-13,612)(-58,023) 663,788Age 55 65,909(-597,879) 663,788(0) 632,911(-30,877) 561,805(-101,983)Note: This table compares the present discounted value of pension wealth for a simulated teacher in Michigan both with and without Cost of Living Adjustments(COLA). The assumed formula for Cost of Living Adjustments is three percent of annual benefit each year (not compounded) starting the October after one fullyear of retirement.Started teaching at age 25 with Master’s DegreeTable efinedContributionPlan)PeakQuit after 2 Quit after 5Quit After 10Retire at 55 Retire at 60 Retire at 65ValueyearsYearsYears 691,288 0 27,069 56,223 487,271 691,288 612,237Age 051) 681,5950049,971681,595667,366616,536Age 59) 663,7880065,909663,788632,911561,805Age 983) 370,893011,27919,237322,055354,977304,814Age (-66,079)---------6,34117,32240,161Note: Difference from peak value appears in parentheses below the present discounted value.Source: Authors’ calculations.15664,480802,186927,981
Table 4Summary StatisticsMeanStandarddeviationMinimumMaximumYears of exp. 418.656%3.26111.928.34 years 926.83%3.69718.635.610 years 1415 yearsYears until 2.950.310Purchase credits?.898.30501Starting salary 33,5034,14624,80042,700Table 5Regression results. Dependent variables: Distribution of teacher experiencePercent with fewerthan 4 years experYears until 0.102(42.628)59.072159.170059.064759.4560Purchase credits?Average ageLog(startingsalary)ConstantObs.R2Percent with 4 to 9years exper.396(.166)Percent with 10 to 14years s: Pension data are from the Public Pension Database. 2001-2010. Center for Retirement Research at BostonCollege and Center for State and Local Government Excellence.Robust standard errors are in parentheses.16
Figure 1Pension Wealth Over the Teaching CareerSource: Authors’ calculations from 2013 CAFRs.17
Figure 2Pension Wealth Early in the Teaching Career18
Figure 3Source: National Longitudinal Survey of Youth of 1997, 2008 Wave19
ReferencesArias E. (2012) United States life tables, 2008. National vital statistics reports; vol 61 no 3.Hyattsville, MD: National Center for Health Statistics.Coile, Courtney and Jonathan Gruber. (2007) “Future social security entitlements and theretirement decision.” Review of Economics and Statistics (89:2): 234-246.Costrell, Robert and Joshua McGee. (2009) “Teacher pension incentives, retirement behavior,and potential for reform in Arkansas.” Education Finance and Policy (5): 492-518.Doherty, Kathryn M., Sandi Jacobs, and Trisha M. Madden. (2012). “No One Benefits: HowTeacher Pension Systems are Failing Both Teachers and Taxpayers.” National Council onTeacher Quality, Washington D.C.Fitzpatrick, Maria D. (2011) “How much do public school teachers value their retirementbenefits?” Stanford Institute for Economic Policy Research working paper, July 2011.Friedberg, Leora. (2011). “Labor market aspects of state and local retirement plans: a review ofthe evidence and a blueprint for future research.” Pension Economics and Finance 10 92): 337361, April 2011.Friedberg, Leora and Michael Owyang. (2002). “Not your father’s pension plan: the rise of401(k) and other defined contribution plans,” Federal Reserve Bank of St. Louis Review, 8
rules have received little attention in the literature, yet they may have unintended effects on new teacher retention or teacher preferences for shorter-term employment. For example, recently the New York State Teachers' Retirement System changed the vesting requirement from five years to 10 years for new teachers.