Transcription
ResearchFebruary 2019A critical moment:NHS staffing trends,retention and attritionJames Buchan, Anita Charlesworth, Ben Gershlick and Ian Seccombe
AcknowledgementsA number of people contributed to the development of this reportthrough peer review and we would like to thank them for theircomments and advice.Errors or omissions remain the responsibility of the authors alone.A critical moment: NHS staffing trends, retention and attritionis published by the Health FoundationISBN: 978-1-911615-25-5 2019 The Health Foundation
ContentsExecutive summary: Trends in the NHS workforce2Introduction and background5The NHS workforce in England: Profile and trendsThe NHS workforce profileNursing and midwifery numbersWorkforce nationality and international flowsThe general practice workforceStudent nurse intakes8810152021Pressure pointsRetention in the NHS workforceStudent nurse attrition262630Conclusions32References34Contents1
Executive summary: Trends in theNHS workforceThis is the third annual NHS workforce trends report published by the Health Foundation.Analysis of the NHS staff profile and trends in England in 2018 largely confirms the trendsidentified in our 2016 and 2017 reports, and shows an ongoing deterioration for some keystaff groups. The key findings are: The NHS employs over a million staff. The past year has seen modest growth in thenumber of full-time equivalent (FTE) staff, with 18,567 more staff in July 2018compared with a year before – an increase of 1.8%. But this is against a backdrop ofmore than 100,000 vacancies reported by trusts, a figure projected to only rise overthe coming years. About half of the growth in NHS staff (9,376 FTE) is among professionally qualifiedclinical staff. But growth is patchy. The professionally qualified clinical staff withthe highest rates of growth were ambulance staff, hospital and community healthservice doctors, and scientific, therapeutic and technical staff, all of which grew byaround 3% or more. By contrast, the number of midwives increased by less than 1%,while the number of nurses and health visitors increased by less than 0.5%. While there has been continued growth in the number of hospital-based doctors,the number of GPs has fallen. The staffing model for primary care is changing. TheFTE number of GPs (excluding locums and trainees) has fallen by 1.6% in the year toSeptember 2018. The mix of staff working in general practice is changing – over thepast year, the number of nurses and other direct patient care staff working in generalpractice has been expanding. There has been a small but notable increase in thenumber of general-practice-based pharmacists and advanced practice nurses. Despite substantial rises in activity pressures, the FTE number of registered nursesand health visitors employed in the NHS in England grew by just under 0.5% (1,300FTE) between July 2017 and July 2018. Although there has been very modestoverall registered staff growth, underlying shortages are evident in the high vacancyrates across the NHS. There are more than 41,000 registered nursing posts reportedvacant in the NHS in England – more than 1 in 10 posts. Moving care from hospitals into primary and community health services has longbeen a policy goal and The NHS Long Term Plan continues to reflect this ambition.However, turning it into a reality on the front line remains elusive. Althoughthe overall number of nurses employed in the NHS has increased slightly, thereare particular problems in key priority areas such as primary care and learningdisabilities. The number of nurses and health visitors working in community healthservices has continued its long-term decline, falling 1.2% (538 FTE), driven by a fall2A critical moment: NHS staffing trends, retention and attrition
in the number of health visitors negating a small rise in the number of other nursesworking in community services. The numbers in mental health nursing – anotherpriority area – increased by less than 0.5% (172 FTE) over the year to July 2018. To address nursing shortages, the government has committed to increasing thenumber of nurses in training. However, 2018 was the second year in a row in whichthe number of applications and acceptances for pre-registration nursing degreesin England fell. Our conclusion is that the change in funding arrangements inEngland, combined with a dip in the population of 18-year-olds, has resulted in afall in the number of nursing students, rather than the expected rise. This problemis compounded by the ‘attrition’ rate – student nurses either not graduating in theexpected timeframe or not at all. Our analysis finds that, across the UK, almost aquarter (24%) of those starting a nursing degree either didn’t graduate or failed to doso within the expected timeframe. There is no sign of sustained improvement in theattrition rate since 2008. Our survey in partnership with Nursing Standard foundthat the student attrition rate ranged from as much as 50% to as little as 5% acrossdifferent universities, suggesting wide variation in completion rates. Another source of new staff is international recruitment. As The NHS Long TermPlan acknowledges, this will remain vital to achieving the overall staffing numbersneeded, but it is currently being constrained by broader migration policies and bythe uncertainties of Brexit. At present there is no coherent government approach tointernational recruitment in the NHS in England. A more strategic and 'joined-up'approach is required, involving government health departments, the Home Office,regulators and employers; one that is embedded in overall national health workforceplanning. Although the new white paper on general migration policy (and The NHS LongTerm Plan) may signal a move in this direction, it is not enough to address the urgentstaff shortages in the NHS. In the short term, more staff should be added to theShortage Occupation List*, including allied health professionals (many of whomdo not earn above the 30,000 salary floor) and certain medical specialties, whilekeeping nurses on the list (along with their salary exemption). Improving NHS staff retention is also a priority, but our analysis shows there hasbeen no improvement in retention over the past year. This is worrying, as staffretention has worsened since 2011/12 and there is an urgent need to reduce thehigh rates of vacancies and staff turnover that we currently see. These issues aremost stark in community trusts, where on average 1 in 5 staff left their role over thecourse of 2017/18. The analysis also finds significant regional variation. In 2017/18,the median staff stability index of trusts in the north-east region was 89% (that is,89% of staff employed at the beginning of the year remained in their role at the endof the year), which made it the most ‘stable’ region that year. The least stable regionwas north-central and east London, which had a staff stability index of 81%.*The list of occupations of which the UK has a shortage, and that are subject to less-stringent immigration rules.Executive summary: Trends in the NHS workforce3
This report is being published at a critical moment. The NHS Long Term Planrecognises that the NHS workforce can be the enabler of its objectives. However,if the existing workforce shortages and deficits continue, they will severely hinderprogress. In this report, we highlight that a lack of coherent policy that takes intoaccount both funding and staffing has been a recurring theme, the effect of whichhas been to undermine any long-term consistency in the NHS’s approach toworkforce policy and planning.We note with hope and expectation that The NHS Long Term Plan may be thecatalyst for improvements in funding for the NHS workforce, and for improvementsin workforce planning and policy functions. But beyond any specific policymeaures, the underlying faultlines in the overall approach to workforce policy andplanning needs to be addressed. If the ‘national’ element in the overall workforcepolicy and planning system is to be truly national, and fully effective, it must:4––take account of the national labour market (not just NHS employment)––align planning and policy across different occupations and sectors––focus more on productivity and investment in the current workforce ratherthan on new roles (unless there is significantly more central support forscaling up)––achieve a more efficient balance of skill mix––enable local workforce planning to be conducted within a supportive overallframework––recognise that national workforce policy and planning cannot be effectiveunless the relationship between staffing and funding is at the forefront of theapproach.A critical moment: NHS staffing trends, retention and attrition
Introduction and backgroundThis report is the Health Foundation’s annual assessment of the profile and trends in NHSstaffing in England. It is intended to be read as an annual update, examining changes inthe overall profile of the NHS workforce, identifying key trends and focusing in detail onspecific workforce ‘pressure points’. This is the third such annual report. Over time, wehope to provide a long-term picture of trends and changing profiles, while also taking ayear-by-year focus on specific issues that warrant more attention.In advance of the publication of The NHS Long Term Plan, we jointly published a briefingwith The King’s Fund and Nuffield Trust, The Health Care Workforce in England: Make orBreak?,1 highlighting the scale of the workforce challenge now facing the NHS, and thethreat this poses to the delivery and quality of care over the next 10 years.NHS trusts currently report a shortfall of more than 100,000 staff. The joint briefingreports that in the context of growing demand for health care – as the population grows,ages and has more chronic disease – the projected gap between the number of staff neededand that available will reach almost 250,000 by 2030. If staff shortages continue, this couldlead to growing waiting lists, deteriorating quality of care and the risk that The NHS LongTerm Plan will be undeliverable.The NHS Long Term Plan, published in January 2019, sets out an ambitious programmeof service-delivery expansion and change.2 It highlights the need to address workforceshortfalls, and states that a new workforce implementation plan will be published later inthe year.Against this backdrop of staff shortages and a commitment to a new national workforceplan, there are a number of other, related policy actions, and continued policy concerns,about the NHS workforce in England.Since the publication of our last workforce report in 2017, Rising Pressure: The NHSWorkforce Challenge,3 these have included: GP shortages: There has been no progress towards the government-set 2020 targetto recruit 5,000 more GPs, with an acknowledgement by government ministers thatthe target date may be postponed.4,5 The most recent data suggest numbers of GPsare actually declining, and the latest National GP Worklife Survey reported that twoout of every five GPs intend to quit in the next 5 years.6 This survey of 2,195 GPs inEngland found that 39% were likely to leave ‘direct patient care’ by 2022, comparedwith 19.4% in 2005. There has also been a reported doubling of the number of GPstaking early retirement since the beginning of the decade.7 Nursing shortages: There are high and growing levels of nursing vacancies. InOctober 2018, there were approximately 41,000 vacancies across the NHS nursingworkforce in England.8 Nursing workforce shortages were the focus of a HouseIntroduction and background5
of Commons Health and Social Care Select Committee report published in early2018, which reported that ‘the nursing workforce is overstretched and strugglingto cope with demand [ ] Major changes have recently been made to routes into nursing. However, too little attention has been given to retaining the existingnursing workforce, and more nurses are now leaving their professional registerthan are joining it.’ The Committee noted that funding for continuing professionaldevelopment had fallen from 205m in 2015 to just over 83m in 2017.9 InDecember 2018, it was reported that the Chief Executive of NHS Improvementanticipated that balance between the supply of, and demand for, NHS medical staffwill be achieved in the next 5 years, but that there will continue to be shortfalls inNHS nursing staff .10 New policy responses to nurse shortages: One response has been to introducenew routes into nursing: nursing associates, nursing degree apprenticeships andthe Nurse First scheme.11 It is too early for a full assessment of the effect of theseinitiatives but, according to the Chief Executive of Health Education England, therehas been one unintended consequence – recruitment of workers into the nurseassociate scheme has triggered staff being recruited from social care.12 Anotherresponse to nurse shortages has been the nationally led, targeted effort to improvenurse retention. NHS Improvement claims it has had early success in a ‘directsupport model’, where it is working with NHS trusts to address areas with highturnover.13 International recruitment: Uncertainty about the status of EU nationals afterBrexit, changes to immigration policies, and the impact of changed language testingrequirements for international nurses have led to a reduction in the inflow of healthprofessionals from the EU and a shift in focus to the recruitment of non-EU nurses.This has not yet compensated for the drop in the number of nurses coming from theEU, with the total international intake of new nurse registrants in 2017/18 less thana third that of 2015/16. Uncharted territory for staff NHS pay: In early 2018, the 7-year public sector pay‘freeze’, which had capped NHS staff pay rises and seen NHS staff earnings fall backrelative to growth in other sectors, was ended. The Health Foundation noted at thetime that this alone cannot solve the NHS's workforce problems – it must be part ofa wider programme of engagement and support for nurses and other NHS workers.1 Lack of investment in ongoing training and development: There has beena continued lack of investment in continuing professional development (CPD)for NHS staff. The central investment in ongoing training and development forexisting staff is now a third of its 2014/15 value, with 84m dedicated to workforcedevelopment in 2018/19. This is 2bn lower than it would have been had 2006/7levels been maintained.1 This spending is part of Health Education England’sbudget, and so no additional investment will be confirmed for future years until the2019 Spending Review.6A critical moment: NHS staffing trends, retention and attrition
Structural change: Health Education England has had the national and regionalworkforce planning remit since it was established in 2012. In October 2018, itwas announced that Health Education England will now ‘work jointly with NHSImprovement’ at national level to develop its mandate for 2019/20, with the aimto ‘ensure that workforce plans are more closely aligned with NHS service plans.’At the regional level, the reported aim is that Health Education England’s regionalteams should ‘align’ with NHS Improvement/NHS England. The rationale forthis is to ‘help ensure that our organisations work much more closely together tosupport local health systems to recruit, train, develop and retain the staff the NHSdepends upon’.14As well as assessing the implications of the trends in NHS staffing, this report also focusesin more detail on a critical ‘pressure point’ – the retention and attrition of both studentnurses and NHS staff. Improved NHS staff retention (that is, lower attrition and turnoverrates) has understandably been identified as a main area for policy attention, as it offersthe promise of faster and cheaper methods of reducing staff shortfalls than training orrecruiting new staff.In our last annual workforce trends report, we highlighted that the turnover of NHSstaff was increasing, and that most NHS trusts were exhibiting reductions in workforcestability rates.3 These retention measures suggested that the problem of retaining staff wasincreasing, despite it being regarded as a policy priority. This year we look at this in moredepth, and focus specifically on two main areas of retention and attrition: trends in the stability of the NHS trust workforce student nurse attrition.This report concludes with a brief assessment of ‘where next’ in terms of health workforcepolicy and planning in England, in the context of ongoing NHS reforms.Introduction and background7
The NHS workforce in England:Profile and trendsIn our previous workforce report, Rising Pressure: The NHS Workforce Challenge, wereported that growth among professionally qualified clinical staff groups had slowed since2014.3 We noted that the only contrary trend was among managers and senior managers,the numbers of which have been increasing since 2015 and outpacing the slow (or nonexistent) growth in most of the other main staff groups. Rising Pressure also highlightedthe sustained growth of the workforce in support roles in several areas. In this section, wehighlight key trends in the NHS workforce in the period up to July 2018.The NHS workforce profileNHS workforce statistics for July 2018 cover NHS hospital and community health service staffgroups in England.8 They show a total workforce of 1.2 million (head count) and an overallincrease of 1.8% (18,567) in the full-time equivalent (FTE) workforce since July 2017.A varied pattern of growth and stagnation lies beneath the headline data, withprofessionally qualified clinical staff growing at 1.7%, clinical support staff growing by1.5%, and NHS infrastructure support staff growing by 2.5%.As in the previous year, the largest percentage increase was among managers (6.0%, upby 1,292 FTE to 22,775 FTE). The number of managers and senior managers has nowincreased for 20 consecutive months. Among the professionally qualified clinical staffgroups, the fastest growth has been among ambulance staff (3.8%). The growth rate forhospital and community health service doctors rose from 2.6% in 2016/17 to 2.9% in2017/18, with a net increase of just over 3,140 FTE to 110,622 FTE in the year to July2018. Much of this expansion is due to growth in the number of consultants (up by 1,436FTE), but it is also down to an increase of 1,697 FTE in the number of doctors in coremedical training* (up by 20.6% to 9,941 FTE). In terms of absolute numbers, most ofthe increase is in general medicine (1,157 FTE), with the largest percentage increases inemergency medicine (358 FTE, or 5.7%). Psychiatry had the smallest percentage increase(49 FTE, or 0.6%), despite mental health being identified as a priority.*Core medical training is the 2-year part of postgraduate medical training following Foundation Years 1 and 2.Successful completion of core medical training is required to enter higher training in the medical subspecialties.8A critical moment: NHS staffing trends, retention and attrition
Over the past year, the FTE number of allied health professionals has grown by 2.3%,slower than the 3.0% rise in the previous year. In absolute terms, the largest increaseshave been in diagnostic radiography, occupational therapy and physiotherapy, with largerpercentage increases in some of the smaller specialties, such as therapeutic radiography. Bycontrast, the number of support staff for allied health professionals has grown more slowly,at 1.3% (178 FTE), compared with 3.7% in the previous year.Although the number of health care scientists* increased by 1.7% to just over 24,000 FTEin July 2018, the total remains lower than its peak of 26,343 FTE in October 2010.Table 1: Change in full-time equivalent (FTE) staff groups in the NHS in England,hospital and community health sevices (HCHS), July 2017 to July 2018Staff group20172018562,937572,3139,376 (1.7%)Doctors107,482110,6223,140 (2.9%)Nurses and health visitors281,363282,6611,298 (0.5%)Midwives21,28121,482201 (0.9%)Ambulance staff19,91920,676757 (3.8%)132,892136,8723,980 (3.0%)314,514319,2094,695 (1.5%)243,472246,0602,588 (1.1%)Support to ambulance staff14,79615,299503 (3.4%)Support to scientific, therapeutic and technical staff56,24657,8491,603 (2.9%)165,252169,3484,096 (2.5%)Central functions80,94883,4272,479 (3.1%)Hotel, property and estates52,70552,903198 (0.4%)Senior managers10,11610,243127 (1.3%)Managers21,48322,7751,292 (6.0%)Other/unknown4,1254,525401 (9.7%)1,046,8281,065,39518,567 (1.8%)Professionally qualified clinical staffof which:Scientific, therapeutic and technical staffSupport for clinical staffof which:Support to doctors, nurses and midwivesNHS infrastructure support staffof which:TotalChangeSource: NHS Digital, NHS Hospital and Community Health Service (HCHS) monthly workforce statistics – July 2018,provisional statistics (2018).*'Health care scientists' comprises those working in laboratory (pathology) sciences, physiological sciences,medical physics, clinical engineering and bioinformatics.The NHS workforce in England: Profile and trends9
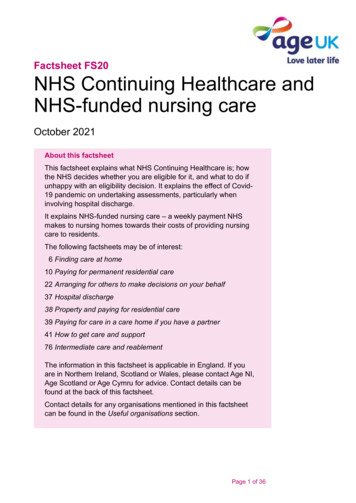
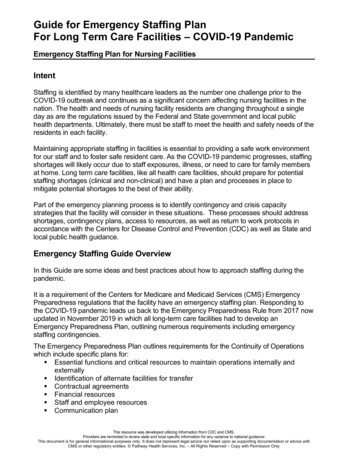
Nursing and midwifery numbersOverview of NHS trends in registered nurses, midwives and health visitorsIn the year to July 2018, the number of nurses and health visitors has scarcely changed –increasing by less than 0.5% to 282,661 FTE. There are now more than 41,000 qualifiednursing and midwifery posts reported vacant in the NHS in England – more than 1 in 10.15However, the overall picture of stagnation in the numbers masks some wide differencesbetween areas of nursing (Figure 1). For example, while the FTE number of nurses andhealth visitors in children’s health grew by 2.2%, and in mental health grew by 0.5%, incommunity services it fell by 1.2%. This fall was driven by a decrease in the number of healthvisitors negating a small rise in the number of other nurses working in community services.Figure 1: Change in nursing workforce by work area (HCHS), October 2014 toJuly 2018% change since October 2014AdultCommunityLearning disabilityChildMental healthHealth 1820nJa1720ctO701l2Ju701r2Ap 01r2Ap1520nJa2ctOSource: NHS Digital. NHS Hospital and Community Health Service (HCHS) Monthly Workforce Statistics – July 2018,provisional statistics (2018).Community nurses, school nurses, district nurses and health visitorsShifting the balance of health care to the community has been a priority for successivegovernments. But as measured by the availability of nursing staff, there is little sign thatthis policy priority has been translated into practice. The number of district nurses hasincreased slightly over the past year (by 235 FTE to 3,850 FTE), while the number ofhealth visitors has continued a long-term decline, falling 7% in the past year (by 597 FTEto 7,852 FTE). Over the same period, the number of other registered nurses working incommunity settings has remained static, at around 24,000 FTE, for the past 3 years(Figure 2).10A critical moment: NHS staffing trends, retention and attrition
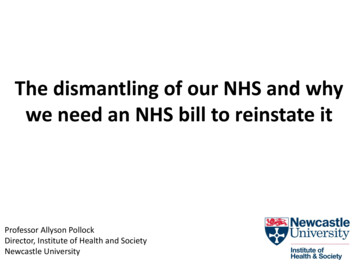
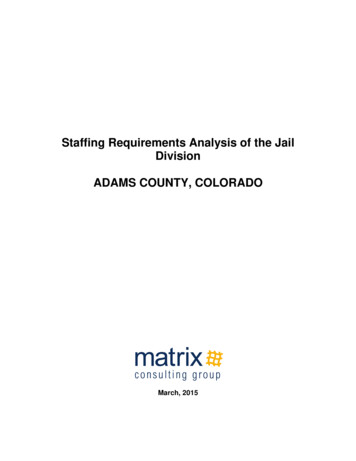
Figure 2: Change in community nursing and health visiting, selected occupations(HCHS), October 2014 to July 2018District nurses% change since October 2014Health visitorsOther first-level registered nurseSchool nursesNursing support r2Ap1820nJa1720ctO701l2Ju701r2Ap 01r2Ap15201420nJactOSource: NHS Digital. NHS Hospital and Community Health Service (HCHS) Monthly Workforce Statistics – July 2018,Provisional Statistics (2018).Note: 'Other first-level registered nurses' are those that are not district nurses, health visitors and school nurses. 'Nursingsupport staff' includes nursing assistants/auxiliaries, nursing assistant practitioners and health care assistants.Analysis published by the Queens Nursing Institute has highlighted that, after severalyears of growth, the number of people entering a district-nurse specialist-practitionerprogramme fell by 2.5% in the last academic year.16 There was also a 10% drop in thenumber of people qualifying from a district nurse specialist practitioner course in 2017,compared with 2016. Some of the decline in these areas may have been offset to somedegree by staff moving into employment in the independent or private sector. However,recent analysis suggests caution in interpreting incomplete data sets, as there has been littlerecent growth in the number of nurses working for independent health care providers.17In Rising Pressure, we highlighted the slump in school nurse numbers.3 This decline hassince accelerated. The number of school nurses fell by 8.7% (to 2,213 FTE), and the numberof nursing support staff in this area also fell by 7.4% (400 FTE).We also highlighted the contrasting trends between the hospital and community nursingworkforces, with no evidence of sustained growth in community nursing numbers, despitethis being the main policy focus for service delivery growth. One consequence of the trendsreported above is that this staffing gap between acute and community sectors has growneven wider over the past year. The number of nurses working in adult hospital nursinggrew by 0.7% to 178,582 FTE, compared with a 1.2% fall in community nursing (includinghealth visitors) to 42,944 FTE (Figure 3).The NHS workforce in England: Profile and trends11
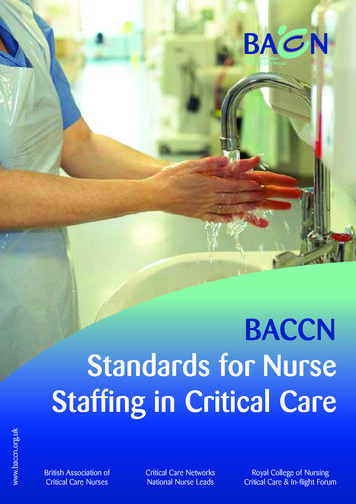
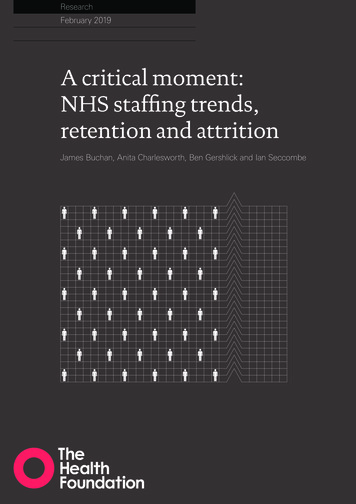
Figure 3: Change in adult hospital nursing and community nursing/health visiting inthe NHS in England (HCHS), October 2014 to July 2018% change since October 2014Adult nursingCommunity nursing/health JaApJuOJaApJuctctctnnnnl2l2l2l2r2r2r220 r 68756Source: NHS Digital. NHS Hospital and Community Health Service (HCHS) Monthly Workforce Statistics – July 2018,Provisional Statistics (2018).Bank nursesA further consequence of the limited growth in the nursing workforce is an increasedreliance on 'bank' staff – that is, staff with no set contracted hours, and staff working flexibleshifts. In part, this will have been driven by NHS Improvement requirements that NHStrusts reduce expenditure on agency staff, and switch to using bank nurses. There is someincomplete evidence suggesting that this switch has been made, but information publishedby NHS Improvement in December 2018 highlighted that the NHS had overspent onbank staff by 260m and on agency staff by 93m in the year to date.18 In June 2018, shiftsworked by bank nurses and health visitors amounted to 10,158 FTE, an increase of 3.7%from June 2017 (Figure 4). This came at a cost increase of 11% on the previous year. Theseestimates should be regarded as a minimum because of data-collection issues.*MidwivesOver the year to July 2018, the number of midwives has increased by 0.9% (201 FTE), ahigher rate of growth than in the previous year, with a total of 21,482 FTE midwives inemployment at the end of June 2018.*'Bank' staff are defined in NHS Digital statistics as those working in roles with no set contracted hours whoare paid through the Electronic Staff Record. Other bank staff may be paid through other systems and are notincluded in these figures; neither are staff employed through other agencies.12A critical moment: NHS staffing trends, retention and attrition
Registered nurses in mental healthMental health was identified as a priority in the Five Year Forward View,19 and also in TheNHS Long Term Plan. Despite this, the number of mental health nurses has risen by lessthan 0.5% (171 FTE) over the past year (to 35,373 FTE). The number of nurses working incommunity mental health has risen by 4% (658 FTE) in the past year to just over 17,240FTE. By contrast, the number of nurses working in other areas of mental health has fallenby 2.6% in the same period, to around 18,132 FTE.Figure 4: Nurses and health visitors working as bank staff (full-time equivalent) inthe NHS in England, HCHS, October 2015 to July 2018Number of staff14,00012,00010,0008,0006,0004,0002,0000801l2 8Ju 012nJu 018r2Ap 0182bFe 0172ecD 0172ctO 0172gAu 1720nJu 170r2Ap 1720bFe 0162ecD 0162ctO 0162gAu 1620nJu 160r2Ap 1620bFe 01521520ecDctOSource: NHS Digital. NHS Hospital and Community Health Service (HCHS) Monthly Workforce Statistics – July 2018,Provisional Statistics (2018).Nursing support staffNursing support staff include nursing assistants/auxiliaries, nursing assistant practitionersand health care assistants. Health care assistants are vocationally qualified, and assistantpractitioners usually have a foundation degree. Nursing support staff serve as part of thebroader nursing team in many care environments, but the ‘mix’ between registered nursesand these nursing support staff varies markedly in different specialties and localities. Incontrast to the very slow growth in the number of NHS registered nurses described above(only 0.7% since October 2014), the number of nursing support staff has grown by around11% over the same period (Figure 5). However, as with registered nurses, the trend variesbetween work areas.The NHS workforce in England: Profile and trends13
Figure 5: Change in registered nurses, health visitors, midwives and nursingsupport staff (full-time equivalent) in the NHS in England (HCHS), October 2014 toJuly 2018% change since October 2014Nurses, health visitors and midwivesNursing support nJa1720ctO701l2Ju701r2Ap 01r2Ap15201420nJactOSource: NHS Digital. NHS Hospital and Community Health Service (HCHS) Monthly Workforce Statistics – July 2018,Provisional Statistics (2018).The comparatively new role of nursing assistant practitioner has risen by 23.9% (1,045FTE) in the past year, to 5,418 FTE (Figure 6). The annual increase in nursing assistantpractitioner numbers (in absolute terms) is now approaching that of health care assistants.The latter increase
4 A critical moment: NHS staffing trends, retention and attrition This report is being published at a critical moment. The NHS Long Term Plan recognises that the NHS workforce can be the enabler of its objectives. However, if the existing workforce shortages and deficits continue, they will severely hinder progress.