Transcription
2022 Van TCO report: UK1. Electric van market in the UKBased on Dataforce registration data for the first half of 2021, battery-electric vans make up 2.7% of theBritish van market (5137 e-vans registered in H1 2021). For reference, the e-van market share in theEU UK in H1 2021 was 2.3%.The UK is not included in the ICCT market monitoring [EU average: 3% in 2021, up from 2% in 2020.]Note that ACEA also publishes full-year data on fuel types of new vans, available here. However data isnot disaggregated between kinds of electrically-chargeable vehicles (ECV). For information,“Electrically Chargeable” includes battery-electric vehicles, plug-in hybrids, fuel cell electric vehicles,and extended-range vehicles. “Alternative Fuel” includes natural gas, LPG, biofuels, and ethanol.Based on ACEA data, ECV vans made up 4.2% of all vans in the UK in 2021.2. Van survey results2.1. Characteristics of British van usersA survey of 745 vans users in France, Germany, Italy, Poland, Spain and the UK found the followingregarding British van users [data in brackets is for the average for all six countries]: 56% of their vans are large (above 1,800 kg) [54%] 71% of their vans are bought new [72%] Users own vans for 4 years on average, with 62% users owning vans for 4 years or longer [5,70%] Users drive 189 km/day on average, with an average maximum daily distance of 409 km/dayand an average annual distance of 36,292 km [avg: 175 km/day, max: 425 km/day, avg: 37,700km/year] Their vans are parked during the day for 1h30/day on average [1h42/day] 80% of van users describe their use as planned, regular, or predictable, and thus easier toelectrify [75%]A briefing by1
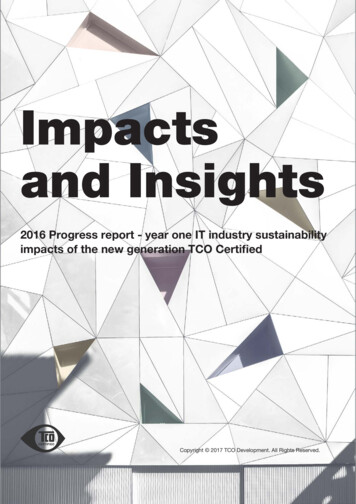
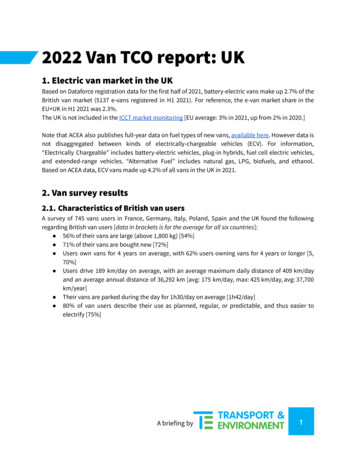
2.2. Attitudes towards electric vansFigure 1: e-van adoption in the surveyIn total, 89% of British respondents either already own an e-van, will buy an electric van in 2022, orwould consider buying one for their next purchase, compared to 84% for the survey overall. 72% ofBritish respondents would consider a hydrogen fuel cell van for their next purchase, compared to 73%for the survey overall.A briefing by2
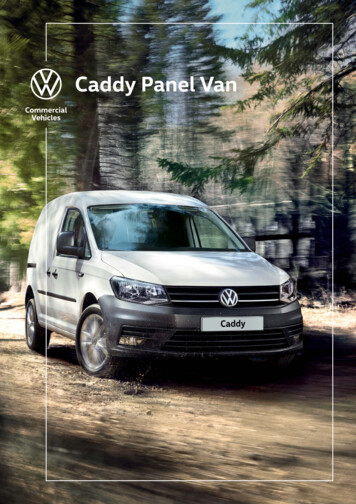
2.3. Reasons for/against e-van ownershipThe top three reasons for e-van adoption in the UK are CO2 savings, improving the companyʼsimage, and a lower TCO [same ranking as in the survey overall].Figure 2: Reasons for e-van adoption in the UKFigure 3: Reasons for e-van adoption in France, Germany, Italy, Poland, Spain, and the UKA briefing by3
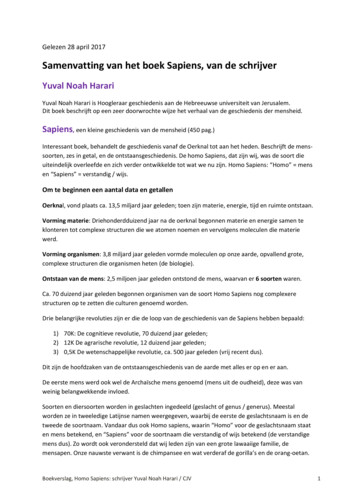
The top three reasons against e-van adoption in the UK are purchase price, lack of overnightcharging, and lack of public charging [top 3 in the survey overall: lack of range, purchase price,lack of public charging].Figure 4: Reasons against e-van adoption in the UKFigure 5: Reasons against e-van adoption in France, Germany, Italy, Poland, Spain, and the UKA briefing by4
3. Total Cost of OwnershipThe total cost of ownership (TCO) for light and heavy, diesel and electric vans was estimated for severalcategories of end users. The main inputs are the average duration of ownership—5 years for all endusers except short-term rental services (STR) and lessees—and the annual mileage. These inputs arebased on data from all users in the survey, not just British users1. As a result, differences in TCObetween countries are due to differences in diesel and electricity prices, registration charges,purchases subsidies, etc.Table 1: Van user characteristics used in the TCO modelBased on T&E TCO modelling, electric vans are already cheaper to own than diesel in the UK: For both light and heavy models For all average users (i.e. average ownership years, average mileage) Both with and without subsidies.1This is because there are too few respondents of each user category in each group, so the results wouldnot be reliable statistically speaking.A briefing by5
Figure 6: TCO of electric and diesel vans in the UK in 2022A briefing by6
Figure 7: Average TCO of electric and diesel vans in all six countries considered in 2022A briefing by7
4. Impacts of higher van CO2 targetsWhat adopting T&E targets rather than the EC proposal would mean for the UK [and the EU]: E-vans: 0.6 million e-vans missing on UK roads by 2030 [2.4 million] TCO savings: 4.4 billion euros or 2.9 billion from 2025–2030 [13.1 billion euros] Oil savings: 26 million barrels of diesel saved in 2025–2030 [101] Emissions savings: 3.4 MtCO2 saved in 2030, 11.1 MtCO2 saved in 2025–2030 [2030: 12.8MtCO2, 2025–2030: 42.3 MtCO2]The figure below shows the impact of opting for the EC proposal instead of the T&E targets.Figure 8: Cost, emissions, and oil savings in the EU from adopting T&Eʼs recommended targets insteadof the Commissionʼs proposed targetsA briefing by8
2022 Van TCO report: UK 1. Electric van market in the UK Based on Dataforce registration data for the first half of 2021, battery-electric vans make up 2.7% of the British van market (5137 e-vans registered in H1 2021). For reference, the e-van market share in the EU UK in H1 2021 was 2.3%.