Transcription
Schulze et al. BMC Bioinformatics 2013, 5METHODOLOGY ARTICLEOpen AccessPlanktoVision – an automated analysis system forthe identification of phytoplanktonKatja Schulze1,2*, Ulrich M Tillich1, Thomas Dandekar2 and Marcus Frohme1AbstractBackground: Phytoplankton communities are often used as a marker for the determination of fresh water quality.The routine analysis, however, is very time consuming and expensive as it is carried out manually by trainedpersonnel. The goal of this work is to develop a system for an automated analysis.Results: A novel open source system for the automated recognition of phytoplankton by the use of microscopyand image analysis was developed. It integrates the segmentation of the organisms from the background, thecalculation of a large range of features, and a neural network for the classification of imaged organisms intodifferent groups of plankton taxa. The analysis of samples containing 10 different taxa showed an averagerecognition rate of 94.7% and an average error rate of 5.5%. The presented system has a flexible framework whicheasily allows expanding it to include additional taxa in the future.Conclusions: The implemented automated microscopy and the new open source image analysis system PlanktoVision - showed classification results that were comparable or better than existing systems and the exclusionof non-plankton particles could be greatly improved. The software package is published as free software and isavailable to anyone to help make the analysis of water quality more reproducible and cost effective.BackgroundThe composition of phytoplankton communities isdependent on different ecological and toxicological factors and the analysis of these communities entails themonitoring of water quality which is prescribed by theEuropean Water Framework Directive [1,2]. However,this approach is time consuming since the organismshave to be registered individually and, due to the highmorphological complexity of phytoplankton, most of theroutine analysis is still done by hand and microscope.Also reproducibility between different scientists andeven for the same person is relatively low and reducesthe credibility of the retrieved data [3].To overcome these problems, automation of phytoplankton analysis seems to be a good alternative. It should speedup the process, make it more transparent and reproducible,and therefore improve the effectiveness of phytoplanktonidentification for water monitoring and protection. Because* Correspondence: logy and Functional Genomics, Technical University of AppliedSciences, Bahnhofstraße, 15745, Wildau, Germany2Bioinformatics, University of Wuerzburg, Biocenter, Am Hubland, 97074,Wuerzburg, Germanyof these advantages, different systems for an automated analysis of phytoplankton communities have been developed.The use of flow cytometers allows a fast analysis of different plankton groups [4] and removes the need to preserve the sample [5]. Yet the strongest drawback of thismethod is that particles must be differentiated based onthe optical characteristics as seen by the photomultipliertube (e.g. light scattering and fluorescent features)resulting in poor species resolution, far below microscopicmethods (especially for nano- and microplankton) [5,6].Another noteworthy approach is the investigation ofthe whole phytoplankton community in parallel via ametagenomic analysis. Since this method is based on genomic data, it has great potential for high taxonomic resolution [7]. Unfortunately, the costs are still too high to befeasible for a routine analysis, though this is expected tochange in the future with the rapid advancements in thisfield. This also applies to some extent to modernbarcoding methods based on the sequence and structureof genetic markers such as ribosomal RNA [8]. Quantification via metagenomic analysis or related barcodingmethods may also be difficult as DNA or RNA moleculesand not cells are counted and the number of genomes of 2013 Schulze et al.; licensee BioMed Central Ltd. This is an Open Access article distributed under the terms of the CreativeCommons Attribution License (http://creativecommons.org/licenses/by/2.0), which permits unrestricted use, distribution, andreproduction in any medium, provided the original work is properly cited.
Schulze et al. BMC Bioinformatics 2013, 5each organism (which varies not only depending on species, but also on growth phase) has to be known. Finally,the identification of a DNA needs a previously sequencedreference genome, i.e. one can only properly identify species which have been studied beforehand.Since taxonomy of plankton is based on morphologicaldifferences, various systems using digital image analysis(scanner, flow systems, video systems) can be found [9].Yet, these systems are mostly developed for the analysis ofzooplankton resulting in a resolution too low for an accurate differentiation of phytoplankton. Due to their higherresolution, microscopic systems seem to be more adequatefor the analysis of this plankton subclass. Additionally, microscopes are currently used for the established procedures for plankton analysis, thereby allowing first anadaptation and then an easy comparison of both systems.One reported automated microscopic system is PLASA,which was developed with the goal of classifying differentphytoplankton organisms with the use of automated microscopy and image analysis for an ecotoxicological microcosm study [10]. To allow a better differentiation betweendifferent phytoplankton taxa and between phytoplanktonand other objects in the sample (zooplankton, detritus andinorganic particles) fluorescence imaging for phycoerythrin and chlorophyll was integrated into the system. Thesoftware was written in IDL, a proprietary programminglanguage requiring a commercial license to legally run therespective programs, which potentially hindered the development and adoption of this system. Additionally, it hasbeen reported to only be able to differentiate between fewtaxa, and has seen no further development since it wasfirst published in 2006.In this paper we describe a novel system using automated microscopy and image analysis for the automatedidentification of phytoplankton for monitoring freshwaterquality. Like PLASA, the microscopic system uses fluorescence imaging, for a better discrimination. The chlorophyll filter set used in PLASA was improved and inaddition to the filter for phycocyanin, a new filter set forphycoerythrin was also integrated into the analysis. Additionally, a new method, where different focal levels are integrated into one image during the microscopy (QuickFull Focus images), was used. One of the goals was to develop open source software that is available for a broadrange of research. Therefore, the image analysis was written as a plugin for ImageJ, which is a free and open sourceproject written in Java [11]. This allows the use of the software on almost any operating system without costs. Sincethe code for the plugin is also licensed as free softwareanyone can adapt and expand the system.PlanktoVision was specifically developed to improvewater quality analysis. In order to make this possible, weso far focused on some of the most important taxa (indicator taxa) as defined by the harmonized taxa listPage 2 of 10for phytoplankton in Germany. This list is based on anation-wide study with the goal to standardize phytoplankton analysis to make it more reproducible [12].For the automated classification the use of neural networks was examined. Neural networks consist of artificial neurons, resembling the properties of biologicalneurons. These neurons are equations connected in different layers and allow complex classification tasks.In the following, PlanktoVision and the used microscopic system are described. Initial results for the classifications of 10 different indicator taxa using a neuralnetwork are discussed.ResultsAutomated image acquisitionImages within the scanning path showed a consistent quality (e.g. no change in the illumination or background color)and no significant changes in the characteristics of the sample could be observed during the microscopy (data notshown). Because of an uneven bottom of the sedimentationchamber an auto focus function had to be used for everyposition resulting in a longer image acquisition time.Since typical bright field images only integrate one focalplane into the image, parts of some organisms with a largervolume were, however, still blurred, which occurred moreobviously in the mixed samples. In the Quick Full Focusimages (QFF images), which integrate different focal planesinto one image, all organisms could be imaged completely(without blurred parts) in the mono culture samples, aswell as in the mixed sample (see example images inAdditional file 1). With this method, however, it is essentialto avoid vibration during the imaging process to preventthe organisms from moving and creating artefacts in theimage. For the fluorescence imaging it could be observedthat the short exposure of a single position already causedbleaching effects that reached further than the immediatearea of the taken image. To keep the bleaching on the different recording positions to a minimum the distance between them was set to 500 μm. Additionally, the gain forthe fluorescence images was set as high as possible (withoutaffecting the subsequent image analysis because of highnoise in the image) to keep exposure times as short as possible. After this change, the characteristics of the analyzedsamples remained stable during the imaging procedure.Image processingAdaptation of ImageJAll image processing and classification tasks wereperformed with ImageJ since it already integrates manyfunctions for the work with microscopic images. Additionally, ImageJ is an open source project that can be easily extended. Nevertheless, it is not primarily intended to beused for complex classification tasks as presented in thiswork. To allow this, ImageJ’s core functionality had to be
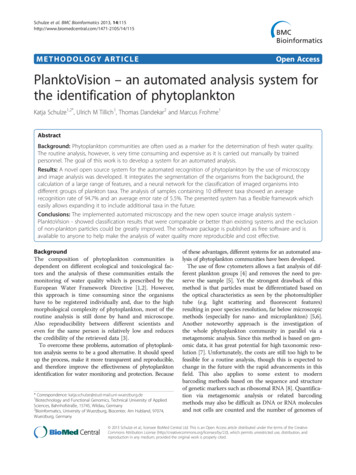
Schulze et al. BMC Bioinformatics 2013, 5expanded. This includes the integration of a region growing segmentation algorithm and the calculation of additional features (see Methods). ImageJ is also unable toperform classification tasks by itself. To allow this, the classification API Encog [13] was integrated into the system.Page 3 of 10were not in focus was possible it still resulted in an inaccurate feature calculation and a poor classificationprocess. Based on these results only QFF images wereused for the following training and testing.Selected features & classificationSegmentationIn this step of the image processing all particles in animage are separated from the background and registeredindividually. Comparing both types of images (typicalbright field and QFF images) the separation of the singleorganisms from the background was better for the QFFimages (Figure 1). Since they integrate different focalplanes into one image most of the organisms could beproperly segmented and an accurate feature calculation(and classification process) was possible. For the brightfield images a good segmentation was only possible whenthe organism was imaged at, or near to its focal point.However, it was often impossible to obtain images with allorganisms in focus. Some organisms have three dimensional structures which can not be focused simultaneouslyand not all organisms occupy the same focal level whensedimented. When the segmentation of organisms thatAfter the segmentation, different features are calculated(see Method section “Feature calculation” for a full overview) that describe the characteristics of the particles.These features are then used in the classification step todifferentiate the plankton species. It has to be noted thatnot all calculated features are used for the classificationthat is presented within this manuscript as the use ofsome features reduced the classification results with ourspecies selection (data not shown). However, these features could be useful to differentiate between a differentset of taxa. The features selected for our work are listedin the section below.The classification procedure was divided into twosteps. First a neural network was trained to separateplankton particles from non-plankton particles; the latterexhibited a great range of texture, size and shape and interfered with the actual classification of the plankton.Figure 1 Exemplary segmentation results for bright field and Quick Full Focus images. The images show the segmentation of taxa thathave a certain three dimensional structure. The part of the image which was segmented from the background is marked by a black line. Thesegmentation is shown for a bright field image (on the left side) and an according Quick Full Focus image (on the right side).
Schulze et al. BMC Bioinformatics 2013, 5Page 4 of 10Since no non-plankton particles showed any fluorescence and all were mostly transparent or brown, featuresfor color (hu histogram), fluorescence (mean brightness inthe Roi of phycoerythrin, phycocyanin and chlorophyllfluorescence), area and circularity showed good classification results with the mixed test sample (Table 1).In a second step, another separate network was trainedfor the actual differentiation between the plankton taxa.Best results for the mixed test sample could be achievedwith 2 hidden layers (first hidden layer 50 neurons, second hidden layer 30 neurons) and features for the texture inside of the organism (local binary pattern, imagemoment 1), shape (eliptic fourier descriptor 2–13, circularity, roundness, solidity, minimum feret and perimeter), size (area), and pigmentation of the organism(color via hu histogram; single photo pigments viafluorescence).The classification of the test sample showed an averagerecognition rate of 94.7% ranging from 89.9–99.9%. Therate of false positive particles showed an average of 5.5%(ranging from 0–13.6%) and was mainly caused by occludedor aggregated organisms, organisms that did not show thetypical morphological features, incorrectly segmented particles or particles that were out of the focus range.DiscussionWe present here a system for the automated identification of phytoplankton using microscopy and computerbased image recognition in regard to water quality analysis (see Figure 2 for an overview). It integrates methodsalready described [10,14] as well as new approaches intothe analysis. The procedure performed by the systemcan be divided into the two general steps: automated imaging of the water sample and the following image processing and recognition.The sample was sedimented in an Utermöhl chamberand automatically scanned in the microscope. To enable aprecise analysis of the samples, different images (brightfield images and autofluorescence of the organisms) weretaken for each position during the scanning process.Quick Full Focus images (QFF), which integrate differentfocal planes into one image, were newly implemented in aplankton classification system. This has two distinct benefits compared to regular bright field images. On the onehand plankton organisms with a large expansion over thefocal plane can be imaged in total, even when using a greatmagnification, improving the accuracy of the followingimage processing and recognition (segmentation, featurecalculation and classification). On the other hand, the lossof whole groups of organisms, which are mostly located ata higher focal point above other sedimented organisms(due to spikes that are attached around the organism ortransparent capsules into which an organism is embedded), can be reduced. This results in a smaller overall systematic error for the system (data not shown).Since the used Keyence software is proprietary, it wasnot possible to determine exactly how QFF images are generated. This may complicate the adaption of PlanktoVisionto other microscope systems, which probably have similarbut not necessarily identical functions available. To avoidthese problems and make methods available to morepeople it is advisable to use open source solutions for theTable 1 Confusion matrix for the classification resultsPlanktoVisiondetukw12345678910% recognition% false 2594.735.45ØThe data were classified into detritus (det), unknown plankton organism (ukw), Cyclotella (1), Anabeana (2), Chlorogonium (3), Cryptomonas (4), Desmodesmus (5),Staurastrum (6), Botryococcus (7), Pediastrum (8), Trachelomonas (9) and Crucigenia (10). The test set included images of 4 different samples that wereindependently prepared, imaged and analyzed on different days to prevent the selection of an over fitted classifier. The results of PlanktoVision (columns) werecompared to a manual classification (rows). Correctly classified results are shown in bold.
Schulze et al. BMC Bioinformatics 2013, 5Figure 2 Overview of the plankton analysis. During the automatedmicroscopy bright field and fluorescence pictures are taken for differentpositions in the Utermöhl chamber. For the image analysis all particlesare segmented from the background of the bright field image andfeatures are calculated. After manual sorting, the segmented imagescan be used to train a neural network which is then able to classify newimages according to taxon.control of microscopes (if available). One possible solutionwould be the use of the micro manager software [15]. Micro manager allows the recording of z-stacks and since it isbased on ImageJ, existing or newly created plugins for a zstack projection could be easily integrated. The currentlysupported hardware of Micro manager includes singlecomponents as well as fully motorized microscopes fromleading manufacturers. Unfortunately, micro manager doesnot support the hardware currently used for the development of PlanktoVision and therefore could not beintegrated.In addition to the fluorescence of chlorophyll andphycoerythrin, which was already recorded by thePLASA system, the imaging of the phycocyanin fluorescence was newly integrated in the imaging process. Unlike as described for PLASA [14], we used a chlorophyllPage 5 of 10filter which is able to excite chlorophyll a and chlorophyll b simultaneously so that both could be includedinto the analysis. The filter set used for PLASA has beenreported not to induce chlorophyll fluorescence forsome species during the experiments. It only exciteschlorophyll b, which is not present in the photo systemof many phytoplankton species [16].The image processing itself can be divided into threedistinct steps: (1) segmentation of the organisms fromthe background; (2) calculation of features that describethe segmented particle in a more defined way; and (3)classification of the different groups of organisms basedon the calculated features.For the segmentation a region growing approach waschosen [17]. Compared to a histogram-based thresholding, where the whole image influences the segmentation, it enables a more robust segmentation of very different organism. This is possible since only thebackground region is included into the calculations forthe segmentation and the amount and type of the organisms in the analyzed image has no influence. Edge detection (in the brightness channel) was integrated into theregion growing, to allow a good segmentation of transparent organisms and organisms that include transparent parts. Because of this, the segmentation was onlypossible for organisms that were imaged at their focalpoint, since edges are only detectable at sharp intensitydifferences in the image. This, however, is not a drawback, as the segmentation of organisms that are out offocus results in a reduced accuracy, or even erroneousfeature calculation and has an overall negative impact onthe analysis. Therefore the positive effects of the edgedetection vastly outweigh its disadvantages and we conclude for this application that the combined approach ofedge detection and region growing is superior to a region growing without previous edge detection.For the feature calculation, new features (especially forthe texture description) as well as those previouslyreported (e. g. in PLASA) were used. Despite the factthat most factors for illumination were set to fixedvalues and the image as well as the rotation of the organisms was corrected before classification, it was notedthat few features, which are not invariant to those factors, were less suitable for classification. These featuresinclude statistics of the gray level co-occurrence matrixas well as normalized brightness and saturation of theorganisms. Also features that are influenced strongly byslight variations in shape (such as fourier descriptor 12–29, or the aspect ratio) seem to deteriorate the resultssince the shape varies to differing extents with the different organisms.The classification of the organisms described was doneby using neural networks. For the differentiation of all taxaone network with 12 output possibilities (ten for the
Schulze et al. BMC Bioinformatics 2013, 5respective taxa, one for detritus, and one for unknownparticles) was chosen and trained with one pre-selectedset of features. Another possibility would be to use onenetwork for every organism with a feature set optimizedand specifically selected for this organism. In this case,classification would be done by going through every network and checking if the particle belongs to one class ornot. However, training and feature selection for the different networks would be more complex and every networkwould have to be checked and (when needed) adapted toeach new organisms integrated into the system. Since theclassification with one network showed a good performance this approach was preferred due to its simplicity andexpandability.Despite the average classification rate of 95%, anover-training of the network can be excluded as theimage test set contained images from independent samples and all samples showed good classification resultswithout bias towards a wrong class. A comparison of theclassification rate to other published systems is difficultsince there are differences in the number of classes, aswell as varying similarities of the organisms that shouldbe differentiated. Additionally, most of the reported systems are used for differentiation of marine plankton.Culverhouse [18], however, made a comparison of reported systems. The classification results are summarizedas followed: ADIAC (37 taxa, 75–90% recognition), whichis a system for the automated analysis of diatom slides[19]; Zooscan (29 groups, 75–85% recognition), which is aplatform for the analysis of mesozooplankton where samples are imaged with a water-proof scanner [20,21]; SIPPER(5 groups, recognition of 75–90%) [22] and VPR (7 groups,72% recognition) [23], which both are system for the analysis of mesozooplankton, where the organisms are imagedduring the sampling; DiCANN (3–23 species, 70–87% recognition), which is a system for the classification of dinoflagellates [24]; Cytosense (30 groups, 91% recognition),which is a flow cytometric approach [25].The average recognition rate of PLASA ( 94% for 5classes) was above the recognition rate of the previouslymentioned systems and is comparable to the rate achievedby PlanktoVision ( 95% for 10 classes). Nevertheless,PlanktoVision showed a much smaller rate of false positives ( 6%) when compared to other reported results(PLASA 20%; VPR 55% [23], Zooscan 26% [21]). For allthe mentioned systems the false positives were mostlycaused by a wrong classification of non-plankton particlesand unidentified objects.In PlanktoVision this cause of errors could be drasticallyreduced by the use of the adapted chlorophyll fluorescencefilter which allowed a very good exclusion of nonplanktonic particles from the analysis with an error rate 1%. Additionally, “unknown” particles (e.g. particles thatwere wrongly imaged and/or segmented and organismsPage 6 of 10that did not show the typical morphological features orwere occluded/aggregated with other particles or organisms) could be identified with 92% accuracy during theanalysis, despite the fact that they showed a great range ofshape, color and fluorescence. Additionally, the systemallowed a good classification of taxa that show similaritiesin their morphology (for example Cryptomonas andTrachelomonas, with a round and quite similar shape)as well as a good differentiation of taxa that show varyingmorphology within their class (e.g. Botryococcus andAnabeana have one basic cell shape, but the number ofcells in an aggregate changes while growing).Comparing the average classification rate of 95%achieved by PlanktoVision to human accuracy, the resultsare in the same range as those reported for routinely engaged personnel (84–95% accuracy) and notably betterthan those for trained but not routinely engaged personnel(67–83% self consistency and 43% consensus betweentrained personnel) [3]. Here it has to be stated that an analysis of a sample by a human generally does not provide areproducible error rate - despite an automated system.ConclusionsThe implemented automated microscopy and the newopen source image analysis system -PlanktoVision- alloweda good differentiation of the presented test set consisting of10 different phytoplankton taxa. The classification resultswere comparable or better than existing systems and thefalse positive rate could vastly be improved over reportedresults due to a better exclusion of non-plankton particlesand unidentified objects. The image analysis was developed as an open source system in order to make it available for many researches and thereby help to make theanalysis of water quality more reproducible. For futurework, more taxa should be integrated into the analysis toallow the generation of more significant results in regardto the water quality analysis of real phytoplankton samples. However, the chosen methods for the image processing might have to be revised to test if they are still sufficient, or if they will have to be further extended(e.g. the integration of other feature calculation methods).Additionally, the choice of the neural network structuremight have to be reexamined for the differentiation of alarger number of taxa.MethodsStrainsFor the training and testing of the system 10 differenttaxa (Table 2) from mono-cultures were fixed with 1%paraformaladehyde to preserve fluorescence characteristics. The morphological characteristics can be seen inFigure 3.
Schulze et al. BMC Bioinformatics 2013, 5Table 2 Used taxa for the training and testing ofPlanktoVisionStrainOriginCyclotella meneghinianaSAG 2136Anabaena sp.CBT 149Chlorogonium elongatumSAG 31.98Cryptomonas ovataSAG 979-3Desmodesmus perforatusIsolated by U. Mischke fromthe “Müggelsee” lake, BerlinStaurastrum tetracerumSAG 7.94Botryococcus brauniiSAG 807-1Pediastrum duplexSAG 28.83Trachelomonas volvocinaSAG 1283-4Crucigenia tetrapediaSAG 9.81SedimentationFor the image acquisition the fixed samples weresedimented according to the Utermöhl method [26]. Thesample volume was chosen so that the sedimented cellsdid not occlude each other on the bottom of the chamber. To obtain training images for the different taxa themono-cultures were sedimented separately. To obtainPage 7 of 10test images, different mixed samples consisting of alltaxa were sedimented.Automated microscopyFor the image acquisition the computer controlled inverse Keyence BZ 9000 fluorescence microscope wasused. The microscope was equipped with the followingfluorescence filter sets: chlorophyll a & b (excitation:435/40 nm; beam splitter: 510 nm; emission: 515 nmlong-pass), phycoerythrin (excitation: 543/22 nm; beamsplitter: 562 nm; emission: 593/40 nm) and phycocyanin(excitation: 600/37 nm; beam splitter: 625 nm; emission:655/40 nm). To allow a fully automated analysis of thesamples, a mouse recorder software was used to program a scanning routine, where images for 80 differentpositions were taken within a predefined rectangulararea. Before starting the image acquisition, lighting,aperture stop, and exposure time for the fluorescenceimaging were adjusted to predefined values (bright field:exposure time 1/28s, aperture 65% open, light intensity84% ; fluorescence: exposure time 1/4,5s and gain 18dB).Additionally, a white balance was performed and animage without the sample was stored for image correction. During the scanning the auto focus functionFigure 3 Bright field microscopic images and Quick Full Focus images of the analyzed taxa. For every pair of images the left side showsthe bright field image and the right side shows the Quick Full Focus image. The taxa are: Cyclotella (1), Anabeana (2), Chlorogonium (3),Cryptomonas (4), Desmodesmus (5), Staurastrum (6), Botryococcus (7), Pediastrum (8), Trachelomonas (9) and Crucigenia (10).
Schulze et al. BMC Bioinformatics 2013, 5of the Keyence software was started for every position(since the glass slide in the Utermöhl chamber is notnecessarily completely even). Afterwards, five differentimages were taken with an 60 objective: A normalbright field image, a Quick Full Focus image (QFF)that integrates 35 different focal levels above and 23focal levels below the auto focused image into a singleimage, and fluorescence images addressing the absorption/emission spectra of chlorophyll, ph
and therefore improve the effectiveness of phytoplankton identification for water monitoring and protection. Because of these advantages, different systems for an automated ana-lysis of phytoplankton communities have been developed. The use of flow cytometers allows a fast analysis of dif-ferent plankton groups [4] and removes the need to pre-