Transcription
Collaborative Embedding Features and Diversified Ensemble forE-Commerce Repeat Buyer PredictionZhanpeng Fang , Zhilin Yang and Yutao ZhangDepartment of Computer Science and Technology, Tsinghua University{fzp13, yzl11, yt-zhang13}@mails.tsinghua.edu.cnAbstractIn online advertisement, after sales promotion, it isimportant to predict which buyers will return andbecome loyal repeat buyers. Given the action logsof users, brand and category information of items,and user profiles, we study the problem of repeatbuyer prediction on E-commerce data, which aimsto predict whether a new buyer of a merchant is aone-time deal hunter or will become a loyal repeatcustomer.We develop a set of useful features to capturethe underlying structure of the data, includingfeatures regarding users, merchants, categories,brands, items and their interaction. We also propose to learn collaborative features with embeddings, which represent users and merchants in ashared feature space.We use logistic regression, gradient boosting decision trees, and factorization machines as individualclassification models. We develop a diversified ensemble model to combine different feature sets andmodels.Our solution obtained AUCs of 70.4762% in stage1 and 71.0163% in stage 2, ranked 2nd and 3rdplaces respectively in IJCAI 2015 Repeat BuyerPrediction Competition.1IntroductionOnline sales promotions usually attract a large number ofbuyers on E-commerce sites. However, only a small portionof the users will return and become loyal repeat buyers. InIJCAI 2015 Repeat Buyer Prediction Competition, we studythe problem of predicting repeat buyers on E-commerce data.In this task, we are given user profiles and action logs onTmall.com. Tmall runs large-scale sales promotions onNovember 11th each year, which is usually called the “Double 11” day. The dataset of the challenge consists of twotables. In the first table, we have user profiles, includingage ranges, gender and user IDs. The second table contains indicates equal contribution.user action logs, in which each log represents a click/add-tocart/add-to-favorite/purchase action between a user u and amerchant m on an item i at time t. Each item i is associatedwith a brand bi and a category ci . These action logs are collected in a span of six months prior to the “Double 11” day.Our task is to predict whether a new buyer of a merchant onthe “Double 11” day will return and purchase in the followingsix months.The competition has two stages. In stage 1, the data setcontains 260, 865 training instances, 261, 478 test instancesand action logs of 7 million distinct user-merchant pairs. Weran our algorithms offline and submitted the prediction results for evaluation. In stage 2, we submitted our code toa distributed computing platform provided by the organizer,where the platform distributes the records of different users todifferent nodes. The data set in stage 2 contains 3, 441, 313training instances, 3, 443, 594 test instances, and action logsof 192 million distinct user-merchant pairs. The IDs of merchants, items, categories and brands are shared in training andtest sets, while user IDs of the two sets do not overlap.One key challenge of the problem is how to leverage thecollaborative information between users and merchants. Conventional methods like collaborative filtering [Sarwar et al.,2001; Breese et al., 1998], matrix factorization [Koren etal., 2009], and factorization machines [Rendle, 2010] addressthe issue by modeling similar users, modeling similar merchants, or factorizing the low-rank interaction between usersand merchants. However, these methods represent users andmerchants in separate spaces, and thus simply applying dotproducts across spaces will not be expressive enough. Also,with such methods, similar users do not directly interact witheach other to learn better features. In this work, we proposeto model users and merchants as continuous embeddings ina shared latent space based on random walks. By modelingusers and merchants in a shared space, applying dot products can have clear explanations of similarities. Also, throughrandom walks, similar users and similar merchants are at thesame time incorporated into the optimization framework.Another challenge is how to leverage the rich action logsto improve the prediction. Extra information including categories, brands and items is very important in this task. We develop a set of collaborative features by examining repeat purchase statistics and the frequent categories, brands and itemsfor a given pair of user and merchant.
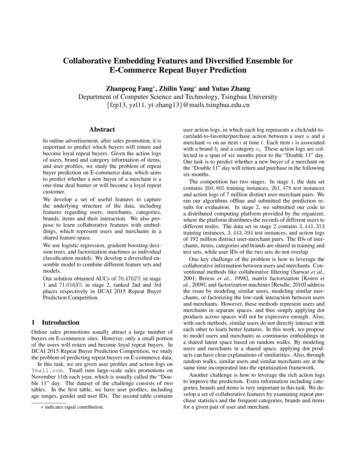
Based on logistic regression [Cox, 1958], gradient boosting trees [Friedman, 2001], and factorization machines [Rendle, 2010], we develop a diversified ensemble model for prediction. We combine different feature sets and different models, and use ridge regression [Hoerl and Kennard, 1970] toblend the prediction on the test data.In stage 1, we took the 2nd place by achieving an AUCof 70.4762%. In stage 2, because we have to deploy our algorithms on the distributed computing platform, we did notimplement all of our algorithms in stage 1. As a result, wetook the 3rd place by achieving an AUC of 71.0163%. Thescore in stage 2 is better than that in stage 1 because of largerdata amount.2FrameworkIn this section, we illustrate the proposed prediction framework.Our solution can be divided into three components: featureengineering, individual models, and model ensemble. Figure1 illustrates the architecture of our solution.We design a bunch of feature engineering techniques to extract useful features from the data. Besides basic general features for recommender systems, we design two novel featuresets to better capture the underlying structure of the data. Wedevelop embedding techniques to represent users and merchants in a shared latent space, and use the cosine similaritiesas features. We also focus on repeat action statistics to utilizethe statistical power of category/brand/item information.We propose a diversified ensemble model for prediction.Let F be a set of feature sets, where each element is a set offeatures. Let M be a set of models, which are logistic regression, gradient boosting decision trees, and factorizationmachines in our solution. We apply a Cartesian product onthe two sets F M to obtain combinations of models andfeatures. We use ridge regression to ensemble different combinations to obtain the final LR1LR1EmbeddingfeaturesFeature EngineeringRidgeRegressionEnsembleLR1LR1LR modelsLR1LR1GBDTmodelsLR1LR1FM modelsModelsFigure 1: Architecture of our solution.3Feature EngineeringIn this section, we introduce the three sets of features we derive - basic features, repeat features, and embedding features.Basic features are general features for recommender systems.Repeat features are designed for this specific problem, focusing on repeat statistics regarding users and the interactionswith categories, brands and items. Embedding features areextracted with advanced learning techniques, which jointlyrepresent users and merchants in a shared latent space.3.1Basic FeaturesGenerally, the basic features can be categorized into threegroups: the user-related features that describe users’ characteristics; the merchant-related features that are only relatedto merchants’ information; and the user-merchant featuresthat capture the interactions and the characteristics of usermerchant pairs.User-Related FeaturesThe dataset provides information on users’ age and gender, and we take those fields as categorical features directly.We count the total number of click, purchase, and add-tofavourite actions of a user to measure user activity. Weomit add-to-cart actions in all our features because we foundthat the information provided by add-to-cart actions is almostidentical to that of purchase actions, and in both stages of thecontest the performances of our method improved after removing the features related to add-to-cart actions. We alsouse the number of distinct items/merchants/categories that auser clicked/purchased/favored for characterizing a user’s activity. We utilize the time information by using the number ofactive days, the number of recent active days, and the oldestactive day for a user as numerical features.Merchant-Related FeaturesMerchant ID is a very strong indicator for a merchant’s likelihood of having repeat buyers. However, we also derive someother merchant-related features, because the training data ofsome merchants is sparse, and the feature weights of thesemerchants’ IDs can not be estimated accurately. Besides merchant IDs, we count the number of actions and distinct usersthat clicked/purchased/favored a merchant as numerical features. We use the ratio of purchased items in summer tomodel a merchant’s seasonality.Notice that we only use this category of features in stage1 of the contest, since the distributed environment of stage 2does not guarantee that all data records of one merchant aresent to the same node.User-Merchant FeaturesThe user-merchant features are similar to the user-related features. We compute the number of click/purchase/favorite actions and the number of total/recent/oldest active days of auser-merchant pair as numerical features. In addition, we usethe category IDs and the brand IDs of the items that a userpurchased from a merchant as categorical features to modelthe context of a user-merchant pair.Post Processing For Feature VectorsIn order to leverage the nonlinear effect of features, in stage 1we discretize all the numerical features into bins of equal frequencies before feeding the features into linear models likelogistic regression. However, we do not adopt this practice instage 2, since the split points can not be computed in the provided distributed environment. Thus, we convert the featurevalue x of each numerical features to log(1 x) in stage 2.
Experiments show that both processing techniques performsimilarly and are much better than the original one.3.2Repeat FeaturesIn this section, we introduce a set of repeat features. Becausethe problem is to predict repeat buyers, we focus on the repeatbuying statistics to extract features. We leverage extra information like categories and brands to develop the new featureset.User Repeat FeaturesIn the given datasets, unlike merchants, the sets of users donot overlap between training and test. Therefore, we cannotuse user IDs as features, though they may be informative. Instead, it is important to examine the repeat buying statisticsof users.For each user, we extract the following features to indicatethe user’s repeat buying pattern. Average span between any two actions. Average span between two purchases. How many days since the last purchase.The features above characterize the activity and repeat buying pattern of each user, which are important statistics of userbehaviors.User-Merchant/Category/Brand/Item Repeat FeaturesWe also leverage merchant/category/brand/item informationto better capture the repeat buying patterns of users. We extract the following features. Average active days for one merchant, category, brandor item. Maximum active days for one merchant, category, brandor item. Average span between any two actions for one merchant,category, brand or item. Ratio of merchants, categories, brands or items with repeated actions.Category/Brand/Item Repeat FeaturesBesides repeat buying patterns of users, it is also importantto utilize the repeat buying patterns of categories, brands anditems. To this end, we extract the following features for eachcategory/brand/item. Average active days on the given category, brand or itemof all users. Ratio of repeated active users on the given category,brand or item. Maximum active days on the given category, brand oritem of all users. Average days of purchasing the given category, brand oritem of all users. Ratio of users who purchase the given category, brand oritem more than once. Maximum days of purchasing the given category, brandor item of all users. Average span between two actions of purchasing thegiven category, brand or item of all users.Given a pair of user u and merchant m, we compute thetop-k frequent categories, brands and items in the interactionlog between u and m, and then use the according featuresabove as the features of u, m .3.3Collaborative Embedding FeaturesTo leverage the collaborative information between users andmerchants, we develop a set of collaborative features to characterize how well a user’ interest aligns with a merchant. Wemodel users and merchants in a shared latent space to uncoverthe underlying structure of the user-merchant interaction data.We compute the similarities between users and merchants asfeatures based on the learned embeddings.Algorithm 1: Learning collaborative features with usermerchant embeddingsInput: Action logs L, user set U , merchant set M , walksper vertex γOutput: Embeddings f// construct the user-merchantinteraction graph1 initialize vertex set V U M2 initialize edge set E 3 foreach u, m L do4E E u, m 5 construct a graph G (V, E)// generate random walks6 initialize random walks W 7 for i 1 to γ do8V 0 random shuffle(V )9foreach v V 0 do10W random walk(v, G)11W W W121314// learn embeddingsinitialize f 0 and fSGD(W, f , f 0 )return fAlgorithm 1 illustrates the procedure of learning usermerchant embeddings. Let U and M be the set of users andmerchants. The input of the algorithm is a set of action logs,where each element is a user-merchant pair u, m , whereu U and m M , indicating that u interacted with m. Weconsider all types of actions equally. If u has multiple actionswith m, the pair u, m will appear in L multiple times.f is a ( U W ) d matrix, where d is the dimension ofthe embeddings. Each row of f represents the embedding ofa user or merchant. f 0 is an auxiliary matrix.Following [Perozzi et al., 2014] and [Mikolov et al., 2013],we generate sequences of random walks on the user-merchantinteraction graph and learn the user-merchant embeddingsbased on the Skipgram model.We construct a user-merchant interaction graph. The vertexset of the graph is U M . For each action log u, m inL, we add an edge between vertex u and vertex m.
After constructing the user-merchant interaction graph, wegenerate a series of random walks starting from each user andmerchant.Given random walks W, the loss function of the Skipgrammodel is defined asTX 1XL T t 1W W4.2XX0 (fWfWt t jw V c j c,j6 0fw0 fWt )where f 0 and f are input and output embeddings. T is thelength of random walk W and c is the window size of context. We perform stochastic gradient descent (SGD) [Bottou, 2010] to update f and f 0 . We use the implementation ofGensim [Řehu̇řek and Sojka, 2011] for learning the Skipgrammodel.Diversified Features at Different IterationsGiven a pair of user u and merchant m, we compute the cosine similarity between fu and fm and apply it as a feature.We develop a method to extend the dimensionality anddiversity of the embedding features. As is shown in Algorithm 1, we use SGD to iteratively update the embeddings f .To further diversify our features, we read out the embeddingsf every k iterations. For example, if we set k 10 and runSGD for 100 iterations, then we read the embeddings f at iteration 10, 20, · · · , 100 and obtain a 10-dimensional featurevector. This idea is similar to ensembling classifiers with different regularization parameters, which is effective at diversifying the results and improving the prediction, as demonstrated in our experiments.4ModelsIn this section, we describe our ensemble method based on logistic regression, ridge regression, gradient boosting decisiontrees and factorization machines.4.1contrast to linear models like LR and SVMs, FMs modelall interactions between variables using factorization method.Thus, FMs are able to overcome the sparsity problem in manytasks. We use the implementation of LibFM [Rendle, 2012].Individual ModelsFormally, our task is a binary classification problem. Thus,we leverage three popular classification models, includinglogistic regression (LR), gradient boosting decision trees(GBDT), and factorization machines (FM) in our solution.Logistic regression is a widely-use linear classifier. It is intrinsically simple and so is less prone to over-fitting. In fact,our experimental result shows that LR achieves the best performance among all the individual models. We use L2 regularizer in stage 1 and L1 in stage 2. We use the implementation of LibLinear [Fan et al., 2008].Gradient Boosting Decision Tree is a tree-based additivemodel. GBDT learns multiple decision trees iteratively,where the learning target of the current tree is defined asthe loss gradient of the previous trees. GBDT outputs theadditive predicitions of all trees as the final prediction. Ithas a strong predictive power and naturally handles data withheterogeneous features. We use the implementation of XGBoost [Chen and He, 2015].Factorization Machines combine the advantages of supportvector machines (SVM) and matrix factorization models. InDiversified EnsembleWe describe the ensemble techniques we develop in stage 1.We initially extract a baseline feature set F0 . Iteratively,we design new features and merge them with original features to obtain a new feature set. In this way, we obtain asequence of feature sets F0 , F1 , F2 , · · · , Fn , where Fi Fi 1 , i n. This method makes a trade-off between stability and diversity. For one thing, by introducing new featuresets, we introduce diversity into different models. For another, by incorporating the previous feature sets into the newfeature sets, we maintain the stability of our models. Thisdiversified feature ensemble method can yield better results,especially when the appended features cannot give reasonably good prediction alone but will improve the predictiontogether with the original features.Let F i Fi , and M be the set of three individual models. We apply Cartesian product to obtrain F M. Then wetrain all models in F M separately to generate F M predictions, denoted as ŷ.In order to diversify the ensemble result, we perform nonlinear extension to obtain new predictions ŷ, ŷ2 , exp(2ŷ).We then train a ridge regression model on the extended predictions, and output the final predictions. We tune the hyperparameter of the ridge regression model to have relativelystrong regularization.5ExperimentsStage 1 Performance. Table 1 shows the best performanceson stage 1 test set for each type of individual models weuse and that of the diversified ensemble method. The tablealso presents the performance of a simple ensemble methodthat ensembles the three best individual models for comparison. It can be seen that logistic regression obtains the bestperformance among the three individual models, which suggests that the derived features may not have strong interaction patterns that can be captured by factorization machinesand GBDT. For ensembling, the diversified ensemble methodachieves an improvement of 0.7% in terms of AUC compared to the best single model, and it performs significantlybetter than the simple ensemble method, which demonstratesthe effectiveness of the diversified ensemble method.Table 1: Performances for each type of individual models andensemble methods on stage 1 test set.ModelAUC (%)Logistic regression69.782Factorization machines69.509GBDT69.196Simple ensemble70.329Diversified ensemble70.476
Factor Contribution Analysis. We provide an analysis onthe contribution of the two sets of features: embedding features and repeat features. Table 2 shows the performancegains after adding each set of features. As shown in the table,we can observe a clear performance increase when addingeach set of features. This indicates that both embedding features and repeat features contribute to performance improvement, and our method works well by combining different setsof features.Table 2: Performance gains for each set of features on stage1 test set (with logistic regression).No.MethodAUC (% ) Gain1Basic features69.36921 Embedding features69.4950.12632 Repeat features69.7820.287Stage 2 Performance. Table 3 gives a brief introduction ofseveral important performance gains of our method on stage2 test set. It can be seen that repeat features still play animportant role in the large data set, which brings an improvement of 0.243% compared to basic features and performsconsistently in both stages. We do not use embedding features in this stage since we cannot extract those features inthe given distributed environment. Moreover, data cleaningachieves a significant improvement 0.309% in stage 2, because the data set of stage 2 contains duplicated/inconsistentrecords that the data set of stage 1 does not have.Table 3: Performance gains on stage 2 test set.No.MethodAUC (% ) Gain1Basic features70.34621 Repeat features70.5890.2433 2 Data cleaning & more features70.8980.30943 Fine-tuning parameters71.0160.1186ConclusionIn this paper, we introduce our solution at IJCAI 2015 RepeatBuyer Prediction Competition.We develop sets of novel features to better solve the problem of repeat buyer prediction on E-commerce data. Wepropose to jointly learn user and merchant embeddings in ashared latent space, and use the cosine similarities as features.We design a set of repeat features to further mine the users’behavior patterns and leverage category and brand information.We propose a diversified ensemble model based on threeindividual models. We apply Cartesian product to obtaincombinations of different models and features, and train aridge regression model to generate the final predictions.Our solution took the 2nd place in stage 1 and 3rd place instage 2. Experiments show that embedding features, repeatfeatures and diversified ensemble contribute significantly tothe result.References[Bottou, 2010] Léon Bottou. Large-scale machine learning with stochastic gradient descent. In Proceedings ofCOMPSTAT’2010, pages 177–186. Springer, 2010.[Breese et al., 1998] John S Breese, David Heckerman, andCarl Kadie. Empirical analysis of predictive algorithms forcollaborative filtering. In Proceedings of the Fourteenthconference on Uncertainty in artificial intelligence, pages43–52. Morgan Kaufmann Publishers Inc., 1998.[Chen and He, 2015] Tianqi Chen and Tong He. xgboost:extreme gradient boosting. 2015.[Cox, 1958] David R Cox. The regression analysis of binarysequences. Journal of the Royal Statistical Society. SeriesB (Methodological), pages 215–242, 1958.[Fan et al., 2008] Rong-En Fan, Kai-Wei Chang, Cho-JuiHsieh, Xiang-Rui Wang, and Chih-Jen Lin. Liblinear: Alibrary for large linear classification. The Journal of Machine Learning Research, 9:1871–1874, 2008.[Friedman, 2001] Jerome H Friedman. Greedy function approximation: a gradient boosting machine. Annals ofstatistics, pages 1189–1232, 2001.[Hoerl and Kennard, 1970] Arthur E Hoerl and Robert WKennard.Ridge regression: Biased estimation fornonorthogonal problems. Technometrics, 12(1):55–67,1970.[Koren et al., 2009] Yehuda Koren, Robert Bell, and ChrisVolinsky. Matrix factorization techniques for recommender systems. Computer, (8):30–37, 2009.[Mikolov et al., 2013] Tomas Mikolov, Ilya Sutskever, KaiChen, Greg S Corrado, and Jeff Dean. Distributed representations of words and phrases and their compositionality. In Advances in neural information processing systems,pages 3111–3119, 2013.[Perozzi et al., 2014] Bryan Perozzi, Rami Al-Rfou, andSteven Skiena. Deepwalk: Online learning of social representations. In Proceedings of the 20th ACM SIGKDD international conference on Knowledge discovery and datamining, pages 701–710. ACM, 2014.[Řehu̇řek and Sojka, 2011] R Řehu̇řek and P Sojka.Gensim–python framework for vector space mo delling.NLP Centre, Faculty of Informatics, Masaryk University,Brno, Czech Republic, 2011.[Rendle, 2010] Steffen Rendle. Factorization machines. InData Mining (ICDM), 2010 IEEE 10th International Conference on, pages 995–1000. IEEE, 2010.[Rendle, 2012] Steffen Rendle. Factorization machines withlibfm. ACM Transactions on Intelligent Systems and Technology (TIST), 3(3):57, 2012.[Sarwar et al., 2001] Badrul Sarwar, George Karypis, JosephKonstan, and John Riedl. Item-based collaborative filtering recommendation algorithms. In Proceedings of the10th international conference on World Wide Web, pages285–295. ACM, 2001.
buying statistics to extract features. We leverage extra infor-mation like categories and brands to develop the new feature set. User Repeat Features In the given datasets, unlike merchants, the sets of users do not overlap between training and test. Therefore, we cannot use user IDs as features, though they may be informative. In-