Transcription
UW MEDICINEFY15 BudgetVALLEY MEDICAL CENTERFY 15 OPERATING AND CAPITALBUDGETSFF&A COMMITTEEMAY 15, 2014
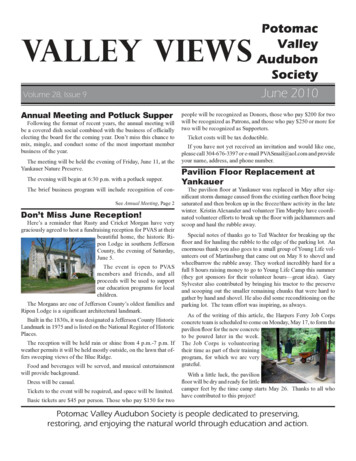
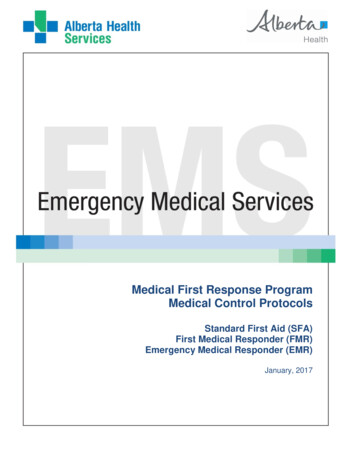
UW MEDICINE STRATEGIC PLANAccountable Care OrganizationDiabetes & ObesityStrategic Partnerships &ACO DevelopmentDigestive/GIPrimary & Secondary CareExpansionPalliative CareIntegrated MentalHealth/Primary Care3. Deliver ServiceExcellenceStrategic Service Expansion/Innovations CareEye InstitutePain CenterVascular CenterRegional Heart /AdvocacyOncology (SCCA)Trauma SystemSafety Net CareHealth Care Reform2. Build Relationships &Provider NetworkIntegration ofResearch InnovationEducationalInnovation ClinicalInnovationService ExcellencePatients Are FirstPillar Goals2New Programs/Innovations in Care1. Build Key Programs4. Deliver Quality, Safety, &Value Based OutcomesPatient Safety,Quality & Cost-EffectiveOutcomesPerformance Improvement5. Organizational Capability& Fiscal IntegrityLong Range Financial PlanWorkforce Development/HRIT AdvancementsTelemedicine
PREAMBLEFinancial ForecastFuture success is based on growth of clinics &outpatient services which will maintain inpatientutilization.Major changes will come as healthcare reform entersyear two: Demand for servicePayment reductionsShift from volume to quality & patient satisfactionMove to Triple Aim3
4
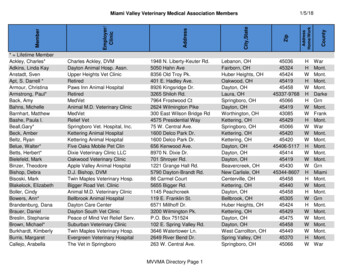
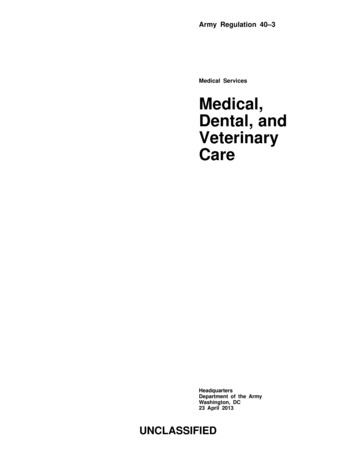
IMPACTS OF SHIFT FROM SELF PAY TO MEDICAIDUnderstanding the reimbursement impact of a shift in payer mix from onecategory to another. The Affordable Care Act (ACA) will change our traditional payor mix. Based on the reimbursement levels of the new exchange category contracts and thenumber of new Medicaid enrollees, gross and net revenues will change. This impact could be significant if the exchange population is large enough or if we areunable to negotiate to ensure that exchange-related contracts maintain a sured/ h NoInsuranceCoverageJoin theExchangeExistingInsuredCommercialPatientsShift toExchangePlans; Lossin MarketShareMedicare/StatePaymentsDecreaseDue toAdjustmentsin DSH,CPE,IME45
TABLE OF CONTENTS FY14 Results FY15 Challenges and Investing in the Future FY15 Operating Budget Assumptions Financial Plan Comparison Volumes, Revenues and Payer Mix Salary & Non-Salary Expenses Allocations Performance Improvement Initiatives Non-Operating Revenue and Expense FY15 Budget Results FY15 Capital Budget Risks Approvals6
FY14 RESULTS Net income from operations is projected to be 10.7 million at endof fiscal year compared to a budget of 9k. Operating margin is projected at 2.3% compared to a budget of 0%. Primary reasons operating margin has exceeded budget are: Outpatient volumes, including hospital ancillary and urgent and specialty clinicvolumes, have been greater than anticipated impacting net revenue byapproximately 1.7 million. Significant effort related to cost containment including implementation ofperformance improvements impacting net revenue and operating expenses byapproximately 7 million. Modifications to employee benefit expense impacting total operating expensesby approximately 2 million.7
CONTINUED CHALLENGES IN ECONOMICENVIRONMENT MOVING INTO FY15 Federal Issues State Issues Commercial Payer issues Pressure to reduce payment rates Interest in risk sharing Medicaid Expansion and Health Care Exchanges – effectiveJanuary 1, 2014 Need for increased community access (i.e. growth)8
FY15 – INVESTING IN OUR FUTUREStrategically, FY15 will be another year of positioning the medicalcenter and the entire UW Medicine system for the future. Included inthose plans are: Continued development of the UW Medicine Accountable CareNetwork, including organizational commitment to the “Triple Aim” Reduce the Cost of Care Enhance the Experience and Outcomes of Patients Improve the Health of the PopulationLeveraging Patients are First structure and goals– patientexperience, quality and fiscal responsibilityIT Services investments including a common IT front-end (EPICEMR), maximizing meaningful use incentive dollars and continuedpreparation for ICD-10 implementationStrategic clinical access investments and consistency with UWMedicine strategic planExecution on Performance Improvement Initiatives9
FY15 OPERATING BUDGET ASSUMPTIONS
FY15 BUDGETThe FY15 budget goal is a total margin of 1.01% or 5.2 million,with an operating margin of 0.7% or 3.6 million.The FY15 financial operating priorities include: Net revenue enhancement (revenue cycle) Overall expense reduction (cost per case mix adjusted discharge) Supply Chain initiatives Transformation of Care initiatives11
FINANCIAL PLAN COMPARISONFY15BudgetNet Patient Revenue GrowthFTEs per Adjusted Occupied BedFinancial Planfor FY157.9%1.5%6.646.11FTEs2,5832,491Salaries and Benefits as a % of Total Net Revenue58.9%60.5%Supply Expense as a % of Total Net Revenue13.7%13.2%Operating Margin0.7%0.5%Total Margin1.0%1.0% 9,110 9,482Operating Expense per CMI Adjusted Admission12
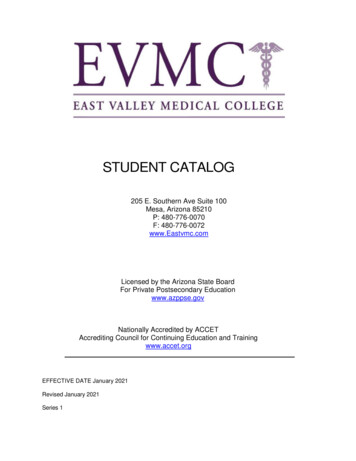
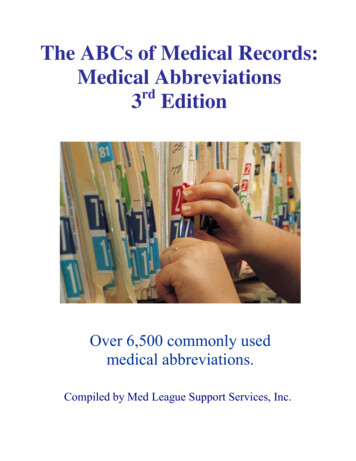
PROJECTED VOLUME GROWTHInpatient Surgical 4,2614,3004,200Year over yeargrowth 13FY14ProjectedFY15Budget Inpatient admissions are projected to grow 2.8% from FY14 projected admissions due primarily to slight growthexpected in general medicine/surgical areas. Inpatient surgical case volumes are projected to grow at 1.5% based on detailed work done to project volumes bysurgeon, including additional cases based on new surgeon recruitment, specifically in Vascular Surgery. The increase in admissions includes an overall assumption that continued expansion within the Clinic Network willproduce downstream hospital volume growth. Surgical growth assumptions include the full-year effect of several new surgeons brought on in FY14, specificallyUrology and Vascular Surgery, along with replacements in Gyn and Neurology.13
OUTPATIENT VOLUME Clinic Visits are projected to grow 10.1% from FY14 projected visits due primarily to the opening of the Maple ValleyPrimary and Urgent Care Clinics, along with expansion at North Benson Urgent Care and hiring of several newproviders in areas such as Obstetrics, ENT, General Surgery, Podiatry, and Family Medicine. Outpatient surgical cases are projected to grow at 18% based on detailed work done to project volumes by surgeon,including additional cases based on new surgeon recruitment, specifically in General, Vascular, Ears/Nose/Throatand Orthopedic Surgeries. Surgical growth assumptions also include the full-year effect of several new surgeons brought on in FY14,specifically Urology and Vascular Surgery, along with replacements in Gyn and Neurology14
NET REVENUE ASSUMPTIONS Constraints on reimbursement by all payers are creating challenges ingenerating sufficient financial margins An overall price increase of 4% has been incorporated into theassumptions Reimbursement impacts by payer have been included as follows: Medicare – Market basket increases, wage adjustments and pay forperformance projections were included and resulted in slight increases inMedicare reimbursement. Decreases for Disproportionate Share dollars(DSH) were also included. Medicaid – Effective July 1, 2014, Medicaid is expected to rebase both IPand OP payments. This assumption does not impact VMC on the inpatientfee-for-service side, and is unfavorable as it relates to outpatient. Alsoincluded is a 3% withholding for the HCA budget neutrality adjustment. Nochange for the Safety Net Assessment, Certified Public Expenditure (CPE)program, or DSH are assumed. Commercial – nominal increases based on contracts that are currently inplace as well as a small amount of realization of price increases.15
PAYER MIX AND MEDICAID EXPANSIONVMC has experienced an increase in the Medicaid payer mix beginning inJanuary, 2014, due to the newly expanded Medicaid programVMC is currently participating in a number of the exchange programs and ismonitoring the volumes related to this business as it evolves.There is currently an assumption in the FY15 budget that the payer mix will behigher for Medicaid and lower for self-pay, replicating January-March 2015actual payer mix. Management will continue to monitor payer mix changesmonthly.FY14 (YTD March)FY15 Budget0% -pay16
LABOR EXPENSE TRENDINGSalary & Benefits as % of Total Net RevenueFTE 4003.0057.8%58.9%60.0%280,00055.0%Dollars in (000's)6.64FTEs per Adjusted Occupied s per AOBFY15Budget200,00030.0%FY12FY13Salary and Benefits FY14ProjectedFY15BudgetSalary and Benefits as a % of Total Net Revenue The FY15 budget assumes a 7% increase in FTEs primarily related to expansion in the ClinicNetwork. Salaries and benefits were adjusted for anticipated union and merit increases (averagingapproximately 3%) in FY15, along with the effects of changes in the retirement and medical plans.17
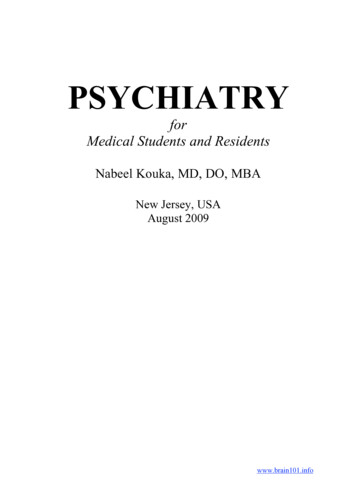
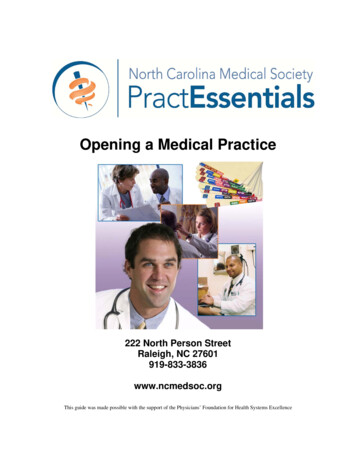
SUPPLY EXPENSESupply Expense TrendingSupplies/CMI Adjusted Admission ply ExpenseFY13Supply Exp as % of Net RevFY14Projected50th PercentileFY15Budget25th Percentile68,000Supply Expense (in 000s)Supply Expense (in 000s)68,00070,000Supply Expense as % of Total Net Revenue70,00072,000UHC Peer Group 25th percentile: 15.68%UHC Peer Group 50th percentile: 17.02%2,000UHC Peer Group 25th percentile - 1,183UHC Peer Group 75th percentile - 064,0001,00062,00080060,00060058,000Supplies/CMI Adjusted Admission72,00040056,00020054,000-FY12Supply ExpenseFY13FY15BudgetFY14ProjectedSupplies/CMI Adjusted Admission50th Percentile25th Percentile Drug expense inflation is budgeted at 5%, Medical Supplies at 3% and Other Expenses at 2%, prior toPerformance Improvement Initiatives. Supply expenses are also increasing in FY15 due to the expansion of the 340B pharmaceutical program, aswell as re-classifying blood products as a supply rather than a purchased service. Management also evaluates supply expense per CMI adjusted discharge as it takes into account otherimportant factors that influence results.18
ALLOCATIONS AND OTHER EXPENSESThere are a number of allocations and system related expenses that have beenincluded in the budget. Total allocations represent .6% (or 3.2 million) of totaloperating expenses for FY15. IT Services UW Medicine Central Budgets, which include Compliance, Marketing, Advancement,Credentialing and Executive leadership Financial Services, which include Accounting, Finance, Patient Financial Services, ICD-10,Cost Reporting, Governmental Programs, Contracting and Revenue Cycle Other allocations, which include Human Resources, Professional Liability Insurance, RiskManagement and the Transfer CenterFY15 Shared Services - VMC 3MOther21%CentralBudget13%Contact Center5%IT Services15%FinancialServices46%19
COST PER CMI ADJUSTED ADMISSIONOperating Expense per CMI Adjusted AdmissionFY14 MarchAnnualizedFY15BudgetFY15LRFP 456,177,000 505,086,000 470,611,000DENOMINATORCase Mix IndexNet AdmissionsOP Adjustment FactorAdjusted AdmissionsCMI Adjusted ing Exp/CMI Wtd Adj Admission 8,713 9,110 9,482NUMERATOROperating Expense20
PERFORMANCE IMPROVEMENT INITIATIVESIncluded in the FY15 Operating Budget are the following performanceimprovement initiatives (both new and carryover from FY 2014) Revenue cycle initiatives of 11.2 million for continued revenueenhancements, including further shift of self pay patients toMedicaid, continued impact of healthcare exchanges, andimproved charge capture, denials management, contractmanagement and point of service cash collections. Supply chain initiatives of 0.4 million focus on supply reductionsprimarily in surgical supplies. Transformation of care initiatives of 3.6 million focusing on 340BPharmacy Program Expansion and other operational opportunities.These initiatives, totaling 15.2 million, will be tracked, measuredand reported on a monthly basis throughout FY15.21
NON-OPERATING REVENUE AND EXPENSES Non-operating revenue and expenses include the following: Property Tax Revenue of approximately 17. 2 million Interest and amortization expense on outstanding debt issues of 18.1 million Investment income, including the Build America Bond subsidy,estimated at 3.2 million. Other net expense of 0.7 million – includes all medical officebuilding revenue and expense, and other non-operatingtransactions (property gain/loss).22
BOND COVENANTS VMC has two types of bond indebtedness: Limited Tax General Obligation bonds (LTGOs) Revenue bonds As the LTGOs are backed by property tax revenues, there areno specific financial coverage ratios required for any of thesedebt issues. Revenue bond financial coverage ratio: Net income available for debt service must be at least 1.25x themaximum annual debt service on outstanding revenue bonds. Coverage Level – FY13 – 2.21x Coverage Level – FY14 as of March 2015 – 6.57x Coverage Level – Budget FY15 – 5.42x23
FY14 PROJECTED VS. FY15 BUDGETMarch 2014 Projected Operating Income (Dollars in 000s) RevenueVolume Increases (Net Revenue Impact)Commercial Contract Changes & Price Increases (Net Revenue Impact)Net Revenue Performance ImprovementsOther Revenue ChangesPayor Mix DegradationTotal Revenue10,72414,06312,5888,1316,98441,766Salary & BenefitsBenefit and Salary InflationIncrease and/or Changes in FTEsPerformance ImprovementsTotal Salary & Benefits(15,942)(14,243)(30,185)Non-Salary ExpenseMedical Supplies and Drug ExpensesPurchased Services and OtherPerformance ImprovementsTotal Non-Salary Expense(6,928)(8,968)(3,228)(19,124)Capital ExpensesDepreciationTotal Capital Expenses2015 Budgeted Operating Margin400400 3,58124
FY15 OPERATING BUDGET SUMMARYFY12Audited(in 000s)Total Patient Revenue Total Deductions1,192,078 FY13AuditedFY14Projected1,255,937 1,391,621 FY15Budget% Change YTDActual 6,462)66.0%(839,613)66.9%(953,249)68.5%Net Patient Revenue405,616416,324438,372473,1617.9%Other RevenueTotal Net 06508,66724.5%8.9%ExpensesSalaries, Wages & BenefitsSupplies and OtherDepreciationTotal 01832,241505,08611.2%12.4%-1.2%10.7%Income from Operations (8,678) (17,827) 10,724 3,581-66.6%Operating Margin-2.0%-4.0%2.3%0.7%-69.3%Nonoperating Income (Expense)3,2958293441,574357.6%(16,998) 11,068 5,155-53.4%NET INCOME (5,383) 25
FY15 CAPITAL BUDGET26
KEY CAPITAL RATIOS Capital investment levels are evaluated based on comparison to keyindustry ratios and benchmarks, as well as margin targets Historical values for key ratios and benchmarks are as shown:Days Cash Cash / (Operating Expense – Depreciation) / 365Ratio of Capital Expenditures to Depreciation Expense27
CAPITAL BUDGET HISTORY VMC’scapital history reflects block funding for 3 major areas: Construction Equipment IT ServicesFive Year Capital History( in 000s)ConstructionEquipmentIT ServicesCore Capital 43,18715,006FY159,1003,7006,70019,50028
FY15 CAPITAL BUDGET OVERVIEWVMC proposes a 19.5 million corecapital budget for FY15.Significant projects include: Expansion of North BensonUrgent Care Clinic Renovations to certain Laband Outpatient Radiologyareas IT initiatives and upgradesto ancillary systems Equipment for newprograms/physicians andgrowth Equipment purchases onexpiring leases29
FY15 BUDGET PLAN RISKSVMCGlobal RisksVolume and Strategic GrowthImplementation of StrategicInitiativesAchievement of Budgeted Patient VolumesPayer Channeling and Rate CompressionManagement of ExpensesMedicaid ExpansionManagement of ExpensesImpacts of Healthcare Reform30
REQUEST FOR APPROVALS Management recommends approval of the FY15 operatingmargin of 3.6 million, which represents a 0.7% operatingmargin and 5.2 million or 1.0% total margin. Management recommends approval of the FY15 capitalbudget of 19.5 million.31
May 15, 2014 · UW MEDICINE FY15 Budget VALLEY MEDICAL CENTER FY 15 OPERATING AND CAPITAL BUDGETS . FF&A COMMITTEE . including hospital ancillary and urgent and specialty clinic volumes, have been greater than anticipated impacting net revenue by . along with replacements in Gyn and Neurology. 13 4,773 4,490 4,198 4,261 3,900 4,000 4,100 4,200 4,300 4,400 .