Transcription
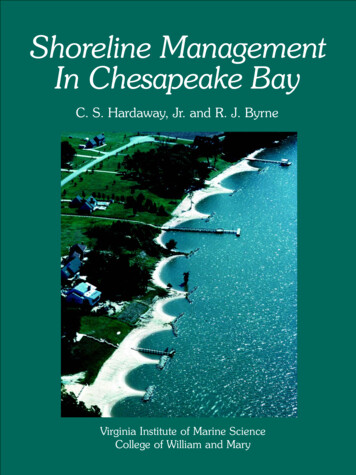
Shoreline ManagementIn Chesapeake BayC. S. Hardaway, Jr. and R. J. ByrneVirginia Institute of Marine ScienceCollege of William and Mary1
Cover Photo:Drummond Field,Installed 1985,James River,James City County,Virginia.This publication is available for 10.00 from:Sea Grant CommunicationsVirginia Institute of Marine ScienceP. O. Box 1346Gloucester Point, VA 23062Special Report in Applied Marine Science and Ocean Engineering Number 356Virginia Sea Grant Publication VSG-99-11October 1999Funding and support for this report were provided by.Virginia Institute of Marine ScienceVirginia Sea Grant College ProgramSea Grant Contract # NA56RG0141Virginia Coastal Resource Management ProgramNA470Z0287WILLIAM&MARY
Shoreline ManagementIn Chesapeake BayByC. Scott Hardaway, Jr.andRobert J. ByrneVirginia Institute of Marine ScienceCollege of William and MaryGloucester Point, Virginia 230621999
4
Table of ContentsPreface.7Shoreline Evolution .8Shoreline Processes .16Wave Climate .16Shoreline Erosion .20Reach Assessment .23Shoreline Management Strategies .24Bulkheads and Seawalls .24Revetments.27Groins .29Breakwaters and Sills .32Beach Nourishment .35Marsh Fringe .36Headland Control .37Other Elements to Consider .38Environmental .38Shoreline Management Goals & Applied Strategies .39Low Wave-Energy .41Medium Wave-Energy .44High Wave-Energy.46Summary .48Acknowledgments.49Other Sources of Information .50Agencies .50Publications .50References .51Glossary .535
6
PrefaceWhen most people consider buying a piece of bayfront property along the Chesapeake Bay,they imagine sunsets spent boating on the water. But there are also unsettling mornings aftera severe storm when one awakes to find a beach suddenly narrower. Or, perhaps the bulkhead thatonce permitted picnics on the grass at the water’s edge has failed and now lies in pieces.The Chesapeake Bay and its extensive shoreline is a dynamic place. Change is constant, but notalways consistent. Years can go by with little impact to a shoreline, but a major storm or change inland-use management can suddenly make a huge difference. Property owners, land-use planners,city, county, and state officials, resource managers, watermen, marina owners, and many others areall concerned with and involved in shoreline management along the Chesapeake Bay.This book addresses shoreline management from a comprehensive standpoint. It not only takesinto account shoreline erosion, but also explains the basic physical parameters behind shorelinechange. Furthermore, this book presents solutions to management problems with an eye to costeffectiveness, sound construction, coastal hazards, property loss, habitat preservation, and waterquality.This document describes and illustrates specific, practical responses to shoreline managementissues. We will begin with a look at the evolution of the Chesapeake Bay and its ongoing, long-termprocesses. We will proceed to a discussion of the daily, physical mechanisms that affect shorelinechange and the topics professionals address in evaluating sites. We will then discuss strategies formanaging shorelines, such as bulkheads, seawalls, revetments, groins, breakwaters, beachnourishment, and marsh fringes, as well as taking no action. Finally, we will give you a frameworkto apply these ideas in terms of the physical environment at the site and the applicable shorelinestrategies.In the past, shoreline erosion has often been addressed in a haphazard fashion without a basicunderstanding of how the physical environment, man-made constructions, and land-use patternsimpact each other. Yet the impact of these changes can be substantial. Land-use patterns havechanged substantially since colonial times.Over the years, lands along the rivers, creeks, and bays once predominantly woodland, havebeen converted to agricultural areas, with pockets of residential development ever increasing(Hardaway et al., 1992). As a consequence, the influx of nutrients, herbicides, and pesticides hasincreased and has also become a more direct influence on waterways. At the same time, marshfringes that once lined many shorelines have eroded, leaving uplands often unprotected from waveaction. While these physical changes have taken place, waterfront property values have steadilyincreased, and controlling shoreline erosion has become expensive. The need for shorelinemanagement becomes critical when human occupation and investments are threatened.7
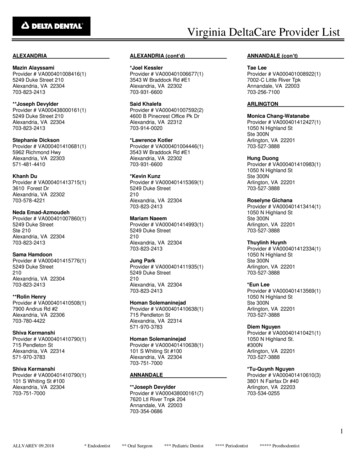
Shoreline EvolutionAncientChesapeake BayChannelsExmore440,000 BPEastville160,000 BPCape Charles20,000 BPModern ShippingChannelsFigure 1Map of theChesapeake Baytoday showingshifts in theSusquehannaRiver drainage. TheCape Charleschannel formedabout 20,000 yearsBP (beforepresent); theEastville channelformed about160,000 BP; andthe Exmorechannel formedabout 440,000 BP.ExmoreEastvilleCape Charles8
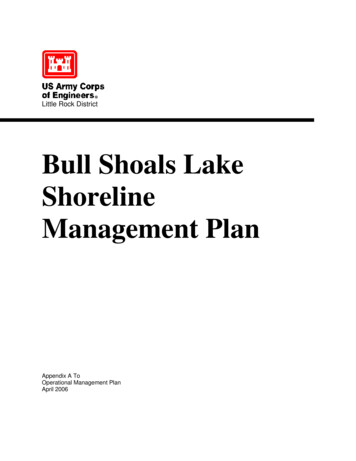
TFigure 2Broad marshes in foregroundgive way to fringing marshesdownstream where there is greaterfetch exposure. At the transitionpoint (T), shoreline processes gofrom tidally dominated to wavedominated (Ware River, Va).river channels, and theirparticularly noticeable after atributaries, are referred to assevere northeast storm or thedrowned river valleys (Figure 1).occasional hurricane. SuchBay’s shorelines starts with anRelative sea level continues tostorms induce a short-term,understanding of how today’srise in the Chesapeake Bay,super elevation of water level,shorelines reached their presentcurrently at about 1 foot perknown as storm surge, andstate.century. The currentstrong, powerful waves. DuringChesapeake Bay estuarinethese storms, the high waterago the ocean coast was aboutsystem, with more than 9,000level and aggressive waves often60 miles east of its presentmiles of tidal shoreline isreach high, upland banks whichlocation, and sea level wasconsidered geologically young.would be out of the range ofGeologic History &Long-term ProcessesManaging the ChesapeakeApproximately 15,000 yearsabout 300 feet lower. TheThe slow rise in sea level isnormal tides and waves. Thus,coastal plain was broad and low.one of two primary long-termshore recession, often calledThe estuarine system was aprocesses which causes theshore erosion, is caused by bothmeandering series of riversshoreline to recede; the other ispassive (long-term rise in seaworking their way to the coast.wave action.level and subsequent drowningAs sea level gradually rose overWaves mold the shape andof river valleys) and activemillennia, the rivers wereposition of the shore as they(storm-induced high sea levelinundated with water causingerode and transport sedimentsand large waves) forces.the shoreline to recede. Infrom one part of the shore togeologic terms, these ancientanother. Such reshaping is9
Shore Types & CoastalFeaturesThe major shore typesassociated with the oceanictransgression include marsh andupland banks with fronting sanddunes, beaches, and spits.Marshes occupy the fringes ofEroding Marsh Fringewatersheds and low regions infront of uplands (Figure 2).Marshes and their associatedpeat substrates are importantfeatures. Marshes grow verticallyFigure 3This marsh fringe along the York River (James City County, Va.) is erodingon the water side, but it is wide enough to protect the upland region fromwave attack.and laterally landward inresponse to sea level rise.Although the face of the marshmay erode in response to waveaction, the remaining marshfringe protects the upland areasfrom erosive forces (Figure 3).If the marsh fringe erodesfaster than it grows, then itFigure 4York River shoreline with fringe marsh absent due to erosion.The upland banks are directly exposed to the force of the waves.The result: eroding upland banks.becomes too thin to protect theupland region (Figure 4).Uplands which are exposed todirect wave action erode morequickly. Without the protectivemarsh fringe, the geology of theeroding banks becomes theprimary factor controlling theEroding Upland Bankheight and composition of thesebanks (Figure 5).Bank erosion is the processwhich provides additionalsediments to the estuarineOld Marsh Fringe Positionsystem, thus, helping to createnatural landforms such as10
Soil Horizonbeaches, dunes, shoals, andsand spits (Figure 6).Upper Sand LayerBank sediments typicallyconsist of fine-grained silt andGroundwater Seep Zoneclay as well as coarser sands andgravel. As a bank erodes, theseBasal Clay Layermaterials slump to the base orbeach. Wave action thenBeachwinnows out the finer sedimentssuspending them in the water,and reshapes the coarser,heavier sand on the shore. Theresultant beach deposit, a sandproduct derived from bankFigure 5Exposed and eroding upland banks along the Rappahannock River, Va.Note: Basal clay acts as a groundwater perch causingthe upper layer of sand to slump.erosion, absorbs the energy fromincoming waves until the depositis eroded during subsequentstorm events.Beaches are dynamicfeatures, constantly reshaped aswave conditions vary. Inaddition to sand movement inthe onshore-offshore direction,Figure 6Dune and beach system along the Chesapeake Bay, Mathews County, Va.Old stumps in the nearshore area are evidence of landwardmigration of dune and beach systems.sand is transported alongshore,Forestwhich is known as littoralDuneBeachtransport. Thus, bank erosion atone site provides sand toadjacent beaches and createsStumpsnearshore features such as tidalflats, offshore sand bars, andshoals. If the beach feature iswide enough, it can protectuplands banks from stormwaves.11
Suffolk ScarpFigure 7Ancient scarp features ofthe Virginia Coastal Plain.(After Peebles, 1984.)ahannockR.BayRapprYoreaveRikekJamSurry ScarpesChesapTerraceRiverSuffolkScarpterm used to refer to a steepslope; it can mean a series ofbeach ridges produced byhigher stands of sea level, orsimply a low, steep beach slopeNearshore features alsoFurther from the shoreline,caused by wave erosion. Inevolve with time, and theirand on a larger scale, some ofVirginia, the Suffolk Scarp,position is a function ofthe most significant coastalwhich runs the length of theshoreline erosion patterns,features are scarps. Scarp is theVirginia Coastal Plain along theintensity of wave action,sediment supply, and tidalcurrents. Nearshore depth is acritical parameter in attenuatingwave energy, and thus theerosive force of waves in a givenarea. Wave energy is a functionof wave height, and wave heightis significantly reduced whenwaves travel over shallow flatsand sand bars.Figure 8Major slump feature along NominiCliffs in Westmoreland County.12
ErosionSpitAccretion(SAV)Sand BarsFigure 9Erosion of sandy upland banks along the Eastern Shore provides significant sediment to create spits and offshoresand bars that protect the “mainland” from wave attack in addition to providing a haven for submerged aquaticvegetation.west side of Chesapeake Bayhigher (70 to 100 feet) as is the(Figure 7), was formed about 2case with Nomini Cliffs inareas include bayfront shorelinemillion years ago during theWestmoreland County (Figurein Somerset, Wicomico,Pleistocene epoch. An ancient8). East of the Suffolk Scarp,Dorchester, Talbot, and Queenbeach feature formed during aland elevations may be less thanAnne’s counties along thehigh stand in sea level, the5 feet above sea level. Here,Eastern Shore. Calvert Cliffs areSuffolk Scarp is a distinguishingextensive marshes occupy thehigh bank features along thefeature of Virginia’s presentlowland drainages and defineChesapeake Bay in Calvertcoastline.the areas prone to tidal flooding.County, Maryland.Much of Maryland’s lowlandWest of the Suffolk Scarp, theThese areas include much of theshoreline banks rise to heights ofbayfront shoreline in the cities ofcreated over thousands of years25 to 50 feet. Other ancientNorfolk, Hampton, andas sediments were successivelyshoreline scarps to the west, likePoquoson, as well as York,deposited at the tip of thethe Surry Scarp, cause the landGloucester, Mathews, andDelmarva Peninsula graduallyand shoreline banks to rise evenMiddlesex counties in Virginia.extending it south many miles.13The Eastern Shore was
The bay side of the Easterneroding sandy upland banks.Up to this point we haveShore has evolved in a mannerEroding upland necks of thetalked about shorelinessimilar to the western side of thesouthern Eastern Shore provideprimarily along the main stem ofbay. Large expanses of embayedlarge amounts of sediments tothe Chesapeake Bay, but thetidal marsh occur in and aroundadjacent downdrift shorelinessystem also includes manyPocomoke Sound (Va./Md.) andand supply sand for extensivesubestuaries known as tidalEastern Bay (Md.). Further southoffshore bar systems (Figure 9).rivers and creeks. These are analong the bayside shoreline inThese bars and spits provideintegral part of the bay’sVirginia, the land rises aroundhabitat for a wide expanse offlooded, dendritic watershed.Onancock Creek to exposesubmerged aquatic vegetationOf varying size, these tidal rivers(SAV) beds.and creeks impact littoralprocesses and shorelineevolution in that they form shoaldeposits due to flood and ebbcurrents. These shoals oftenStoneRevetment1975restrict navigation, and thusdredging and/or jetties areneeded to keep the channelsopen. Shorelines flanking creekStoneRevetment19921972375'1992Figure 10Shoreline evolution inNorthumberland County, Va.Groins1972Note: Groin field in foreground wasupland in early 1970s. Spiral shapedembayment formed between the groinfield built in 1972 and a revetmentinstalled in 1975 such that themaximum offset was 375 feet by 1992.Spur 1978(rebuilt in 1992)14
entrances are directly affected byAfter World War II, with theThe impact of shorelinethese measures—either by sandadvent of “leisure time,”protection installations on theaccretion or sand deprivation,residential development alongrecent shoreline evolutionwhich in turn affects shorelinethe shorelines of Chesapeakeprocess is two-fold. First of all,erosion in that area.Bay began to increase. Cottagethe eroding sediment banks thatcommunities were establishedonce provided sands foralong upland areas withbeaches, spits, and offshore barsbeachfronts. The increasedno longer supply their “natural”development added pressure toinput of sand. Secondly,upland banks that were alreadyprotected segments of shorelineprone to erosion. Unfortunatelycan remain essentially as hardthis erosion generally wentpoints or headland featuresunnoticed until homes andwhile adjacent unprotectedimprovements becameproperties continue to erode,threatened. If measures weresometimes at an accelerated rateused to protect shorelines, they(Figure 10). In order tousually consisted of inexpensiveunderstand the processes ofand unsightly means, such asshoreline change, we must alsodumping broken concrete, oldunderstand the hydrodynamiccars, or tree stumps. With time,processes—in other words, themore substantial coastalway water and waves work onstructures were installed, andany given shore.Impacts ofDevelopment onShoreline ErosionThe evolution of theChesapeake Bay shoreline hasalso been influenced byresidential and commercialdevelopment along the tidalshoreline. Commercial shorelinedevelopment in urban areasdates to post-colonial times, butup until World War II, most ofthese areas were used foragriculture or were simplymanaged as rural areas.these projects began to alter thegeomorphic patterns of theshoreline.15
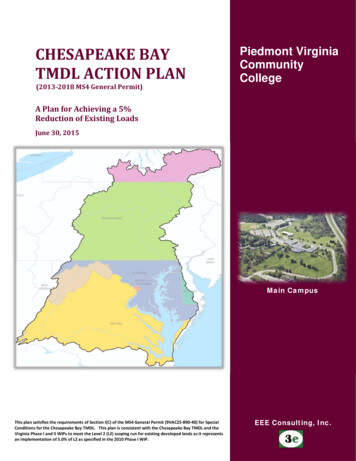
Shoreline ProcessesWave ClimateWave climate refers toafter a storm front passes.period is the time it takesaveraged wave conditions asHurricanes, with sustained windssuccessive waves to pass a fixedthey change throughout theof at least 74 mph, occur frompoint).year. As waves are generated bymid-summer to mid-fall.winds, wave climate reflects bothAlthough hurricanes generatesimple measure of relative waveseasonal winds as well as thosehigher winds and storm surgeenergy. Hardaway et al. (1984)caused by extreme storms.than northeast storms, theircategorized wave energy actingWave climate is a good measureduration generally is shorter.on shorelines into three generalof potential shoreline changeDuring storms, the rate ofbecause on a daily basiserosion at any location dependsshorelines erode minimally.upon the following conditionsAs previously mentioned,(Riggs et al., 1978):Fetch can be used as acategories based on averagefetch exposure:1. Low-energy shorelines haveaverage fetch exposures ofpronounced erosion often1. Storm frequencyless than 1 nautical mileoccurs during high-energy2. Storm type and directionand often are found alongstorms, such as northeasters and3. Storm intensity and durationtidal creeks and smallhurricanes, when high winds4. Storm surge, currents, andtributary rivers.blow across the bay and greatlywaves.increase wave conditions.The wave climate of atypically occur along theparticular shoreline along themain tributary estuaries;Chesapeake Bay systemaverage fetch exposures ofdepends upon several factors1 to 5 nautical miles.Seasonal wind patterns varyin the Chesapeake Bay region.From late fall to spring, thedominant wind directions arenorth and northwest. During thelate spring, the dominant windshifts to the southwest andcontinues so until the followingfall. Northeast storms, whichoccur from late fall to earlyspring, are associated witheastward moving, low pressureareas. Often, there is a period ofintense north to northwest wind2. Medium-energy shorelinesother than wind, including:3. High-energy shorelinesfetch, shore orientation, shoreoccur along the main stemtype, and nearshore bathymetry.of the bay and at the mouthsFetch is the distance of openof tributary estuaries;water over which wind can blowaverage fetch exposures ofand generate waves in an area.over 5 nautical miles.The greater the fetch, the greaterNote, as fetch exposures ofthe potential wave energy.more than 20 nautical miles areWave energy is measured bycommon along the bay stem, itwave height and wave periodis also true that Chesapeake Bay(refer to Glossary). (Wave16
is susceptible to a high degree ofTABLE 1shoreline erosion. Figure 11AVERAGE SHORELINE EROSION RATESTIDEWATER VIRGINIAillustrates how to estimateaverage fetch exposure.Generally the wind/waveYORK RIVERNORTH SIDEGloucester Co.King and Queen Co.EROSION RATES- 0.5 ft/yr- 0.3 ft/yrAVERAGE- 0.4 ft/yr- 0.4 ft/yrSOUTH SIDEYork Co.James City Co.New Kent Co.EROSION RATES- 0.9 ft/yr- 1.8 ft/yr- 0.9 ft/yrAVERAGE- 1.2 ft/yrwindow is 90o, measured 45o oneither side of the shore strike (aline drawn perpendicular to theorientation of the shore). Thereis often a long fetch componentup- or down-river that willJAMES RIVERsignificantly influence the waveNORTH SI DENewport NewsJames CityEROSION RATES- 0.8 ft/yr- 0.1 ft/yrAVERAGESOUTH SIDEIsle of Wight Co.Surry Co.EROSION RATES- 1.8 ft/yr- 1.2 ft/yrAVERAGE- 0.45 ft/yr- 1 .5 ft/yrclimate at a particular shore.Hardaway and Anderson(1980) noted that the southernsides of Virginia’s majortributary estuaries (James, York,and Rappahannock rivers) areRAPPAHANNOCK RIVEReroding at a rate more thanNORTH SIDELancaster Co.Richmond Co.EROSION RATES- 0.6 ft/yr- 0.6 ft/yrAVERAGESOUTH SIDEMiddlesex Co.Essex Co.EROSION RATES- 1.0 ft/yr- 1.2 ft/yrAVERAGEreason is that southern shores- 1.1 ft/yrare exposed to the northwest,- 0.6 ft/yrtwice that of the northern sidesof these rivers (Table 1). Thenorth, and northeast directionsCHESAPEAKE BAYWESTERN SHOREGloucester Co.HamptonLancaster Co.Mathews Co.Northumberland Co.York Co.EROSION RATES- 0.6 ft/yr- 1.0 ft/yr- 1.4 ft/yr- 0.8 ft/yr- 1.0 ft/yr- 1.5 ft/yrAVERAGEEASTERN SHOREAccomack Co.Northampton Co.Fisherman’s Is.EROSION RATES- 1.5 ft/yr- 0.7 ft/yr 11 ft/yrAVERAGESOUTHERN SHOREVirginia BeachNorfolkNansemondEROSION RATES- 1.7 ft/yr- 1.2 ft/yr- 1.2 ft/yrfrom which the most severeseasonal winds originate.Shore type and substratecomposition also affect the rate- 0.9 ft/yr- 1.0 ft/yr*AVERAGEof shoreline erosion. Uplandbanks, composed of light clay orwell-cemented sand or marl,resist erosion better than softclays or unconsolidated sands.Hardaway (1980) found thatlow, upland banks erode almost- 1.4 ft/yrtwice as fast as marsh shorelines*Does not factor in Fisherman’s Island.with similar fetch exposures andAfter Hardaway and Anderson, 1980.nearshore depths.17
IKEFigure 11Measured parameters include average fetch (AF F1 F2 F3 F4 F5/5), and longest fetch. Also shown is shorestrike from which the wind/wave window for fetch and shore orientation are established (After Hardaway et al.1992). Shore orientation in this case is about due north.Shallow nearshore regions,erosion. In the lowerAccording to Basco andsuch as tidal flats and sand bars,Chesapeake Bay, storm surgesShin (1993), during moderatereduce incoming wave energyfor 10-year, 25-year, 50-year,northeast storms (which occurbetter than deeper waters whichand 100-year recurrenceabout every two years) sustainedallow a greater portion of waveintervals are estimated at 4.5winds of 30 to 40 mph canenergy to reach the shore. Widefeet, 4.8 feet, 5.5 feet, and 6.1generate waves with heights ofbeds of submerged aquaticfeet above mean sea level5 to 7 feet in the Bay (highvegetation (SAV) reduce wave(Boon et al., 1978). Storm surgeenergy waves), 2 to 5 feet in theheight—thus wave energy—asestimates for other Bay regionsmain tributary estuariesthey approach a shoreline.are shown in Table 2. Table 3(medium energy), and about 1lists significant storm events infoot in small tidal creeks (lowmentioned, is a critical elementthe last 100 years and theirenergy).in assessing the impact of localassociated storm surgewave climate on shorelinemaximums.Storm surge, as has been18
TABLE 2.Height Frequency Levels of Total Tide at Selected Chesapeake Bay StationsWe s t e r n S h o r e S t a t i o n sE as t e rn S h o re S t at i o n sA n n u a l Fr e q u e n c yS t at i o n1010Yr.5050Yr.100Yr.A n n u a l Fr e q u e n c yS t at i o n500Yr.1010Yr.5050Yr.100Yr.500Yr.Havre De Grace, Md.5.39.611.514.6Betterton, Md.5.18.710.513.4Baltimore, Md.4.16.88.110.7Tolchester, Md.4.37.28.711.5Annapolis, Md.4.06.27.29.4Love Point, Md.4.36.47.49.7Chesapeake Beach, Md.3.55.26.17.9Matapeake, Md.4.26.27.29.2Cove Point, Md.3.44.55.26.6Cambridge, Md.3.95.15.97.5Solomon's Island, Md.3.44.85.57.0Hoopers Island, Md.3.54.75.36.6Cornfield Harbor, Md.3.24.24.65.8Chance, Md.4.25.45.86.8Windmill Point, Va.3.23.73.94.4Crisfield, Md.3.94.85.16.1Gloucester Point, Va.3.23.73.94.4Guard Shores, Va.4.25.66.37.8Gaskins Point, Va.3.54.04.24.6Eastville, Va.3.64.14.44.9Kiptopeke Beach, Va.4.14.85.26.2Heights in feet above NGVD.**National Geodetic Vertical DatumTABLE 3Significant Storm Surges in Chesapeake Bay During the 20th Century.DateEventLocation04 Aug 191524 Oct 192329 Sep 192419 Sep 1928HurricaneHurricaneHurricaneHurricane23 Aug 1933Hurricane16 Sep 193318 Sep 193605 Oct 194816 Oct 195413 Aug 195518 Aug 195513 Apr 195627 Sep 195606 Oct 195730 Jul 196012 Sep 196008 Mar 1962HurricaneHurricaneExtratropicalTropical Storm HazelHurricane ConnieHurricane DianeExtratropicalTropical Depression FlossyExtratropicalTropical Storm BrendaHurricane DonnaAsh Wednesday Storm23 Jun 197231 Oct 199110 Dec 1992Tropical Storm AgnesHalloween oreBaltimoreHampton RoadsBaltimoreHampton RoadsHampton RoadsHampton RoadsHampton RoadsBaltimoreBaltimoreBaltimoreHampton RoadsHampton RoadsHampton RoadsSolomon’s IslandHampton RoadsAnnapolisHampton RoadsBaltimoreHampton RoadsBaltimoreFrom U.S. Army Corps of Engineers, Norfolk District, Baltimore District, and NOAA.19Storm Surge .12.25.53.66.72.12.92.6
Shoreline ErosionDyerThe tidal shoreline of theCreChesapeake Bay extends forekabout 9,000 miles, and isroughly evenly divided betweenMaryland and Virginia. DuringRoute 600the period 1850-1950 assessments indicated a loss of about47,000 acres of land along thisCh es ap ea keB ayshoreline due to erosion(22,000 acres in Virginia;25,000 acres in Maryland)(Byrne and Anderson, 1978;Singewald and Slaughter, 1949;U.S. Army Corps of Engineers,1973). Most of this erosionoccurred along less than 1,000miles of the shoreline, along theMobjackB ay1852main stem of the Chesapeake1942Bay. Figure 12 shows how a bay1985shoreline in southeast MathewsCounty, Va., has evolved. The1852 shoreline includes themarsh islands in the ChesapeakeBay; notice the extent of NewNewpoint ComfortLighthousePoint Comfort at that time.Taking into account the rolethat fetch, storm surge, and other010002000factors play in long-term trends3000of shoreline erosion, there areFEETalso some shore types that areFigure 12Historic shoreline change in southeast Mathews County, Va.(VIMS Shoreline Studies, G. Thomas-Cartographer)20more susceptible to erosion thanothers.
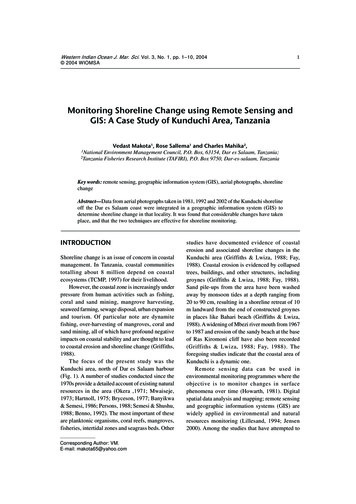
HIGH BANKHigh Fastland 10 ft. mlwShore ZoneStableUnstableBeach, Marsh, Beach/DuneLOW BANKLow FastlandNearshore 10 ft. mlwTidal Flats, Sand BarsShore ZoneNearshoreStableUnstable Beach, Marsh, Beach/Dune Tidal Flats, Sand BarsBeachBeach100 Yr.100 Yr.MHWMLWMHWMLWPleistocene SubstrateErosion SurfaceRecentSedimentationMarshMarsh100 Yr.MHWMLW100 0 Yr.100 Yr.MHWMLWMHWMLWFigure 13Six typical shoreline profiles around Chesapeake Bay. The stability of the bank face is dependent upon the widthand type of shore zone features. Wide beaches/dunes and marsh zones can offer significant wave protection evenduring storms. (Mean high water (MHW), mean low water (MLW), and 100-year storm surge elevation.)The tidal shorelines of thesusceptible to potential frequentbank, bank erosion andChesapeake Bay can beflooding, whereas high banksslumping from waveclassified into six basic typeswill not. On low banks, wavesundercutting could threaten(Figure 13) depending on themay attack landward, floodingstructures.height of the upland banks.the top of the bank and directlyA high bank, for ourThe six basic shore settingsthreatening propertyalso take into account differentpurposes, is defined as anyimprovements, such as housesshore zone features which varyupland elevation greater than 10and roads. Propertyin type and width. Thesefeet above mean low water andimprovements on high banksdifferences, in turn, determinea low bank is 10 feet or lesswill not be impacted directly bythe bank face stability and theabove mean low water. Thestorm surge or wave action.potential need to protect therationale for this is that lowHowever, if the improvementsbank from erosion.upland regions will beare near the edge of a high21
Wide fringing marshes,Various combinations ofimprovements generally is notbeaches and dunes reduce thethese six situations may occurfeasible. However, placing aeffects of wave action duringadjacent to each other.shore protection system that willstorms such that adjacent uplandMoreover, actions taken onwithstand the waves and stormbanks may only be impacted byadjacent shore segments maysurge as well as remain intactthe most severe events or not atimpact sand supply toafter a severe storm is quiteall (i.e., 100-year storm).neighboring shore segments.feasible. These factors must beNarrow shore zone featuresAlong low bank shorelines,considered in the design phaseallow waves to more frequentlywhere storm surges frequentlyof any shoreline managementimpact upland banks, thusflood the uplands, buildingstrategy. In choosing a strategy,causing chronic instability andshoreline protection structures toconsider also the long- andcontinual erosion.completely stop upland waveshort-term impacts of a “no-attack on propertyaction” management approach.Yorktown waterfront adjacent to Cornwallis’s Cave during a Northeaster, October 22, 1985.22
Reach AssessmentBefore any shoreline strategy3. Determine within the reachwhich this occurs, such asis planned, the site should bewhich sites supply sand andsurface runoff, erodingevaluated within the context ofthe volume of that supplysediments, and/or ground-the “reach.” A “reach” is definedfor incremental erosionwater discharge. Nutrientsas a segment of shoreline wheredistances. Often, within adon’t impact erosion, butthe erosion processes andreach, there are subreachesthey do impact waterresponses mutually interact.that interact with eachquality. Adding breakwa-For example,
Virginia Sea Grant College Program Sea Grant Contract # NA56RG0141 Virginia Coastal Resource Management Program NA470Z0287 Special Report in Applied Marine Science and Ocean Engineering Number 356 . The Chesapeake Bay and its extensive shoreline is a dynamic place. Change is constant, but not always consistent. Years can go by with little .