Transcription
Cat modelling guide 20085/12/0817:33Page 1A GUIDE TOCATASTROPHE MODELLINGIN ASSOCIATION WITH
Cat modelling guide 20085/12/0817:33Page 2CATASTROPHE MODELLING: A STEP-BY-STEP EXAMPLEThe basic framework for modelling perils is similar. Thisexample illustrates the steps a user would take to arrive atan estimation of modelled losses from hurricane risk to agiven location.1. User enters location data and building characteristics into model2. Model geocodes location to its geographic coordinates,identifying location’s distance to coast3. Stochastic event module defines event set for specifiedlocation and storm type4. Hazard module generates event information including wind speedand storm surge to determine hazard intensity5. Vulnerability module retrieves hazard intensity andgenerates average damage (ie, mean damage ratio) andassociated uncertainty factoring in building characteristics(eg, roof type, construction type)6. Based on the estimated mean damage ratio and uncertainty,financial module calculates losses based on building values andinsurance policy terms7. Financial loss is quantified for specified coverage(s) and line(s)of business based on the mean damage ratio and its variation.2The Review A Guide to Catastrophe Modelling 2008
Cat modelling guide 20085/12/0817:33Page 3CONTENTSA GUIDE TOCATASTROPHE MODELLINGA Guide toCatastrophe Modelling4 Editorialby Ruth Lythe, Deputy Editor of The Review.5 Introductionby Hemant Shah, President and CEO of RMS.CHAPTER 12008/09IN ASSOCIATION WITHThe Review is published 10 times a year by InformaUK Ltd, Telephone House 69-77 Paul Street, London,EC2A 4LQ, UKDistributed by MSC Mailers, Inc, 420South Ave, Middlesex, NJ 08846. Periodical PostagePaid at Middlesex, NJ 08846 POSTMASTER: Send USaddress corrections to Pronto Mailers Association, 444Lincoln Blvd, Middlesex NJ 08846.Informa also publishes Health Insurance,World Insurance Report and Insurance Day.Editor: Greg DobieEmail: greg.dobie@informa.comDeputy Editor: Ruth LytheEmail: ruth.lythe@informa.comSenior reporter: Sarah Ahmadsarah.ahmad@informa.comArt Editor: Nicki SitarasEmail: nicki.sitaras@informa.comAdvertising Manager: Paul Cliftonpaul.clifton@informa.comCommercial Director: Andrea Wardandrea.ward@informa.comImages: Unless otherwise indicatedall images copyright RMSPrinter: Paterson PrintingSubscription enquiries: Customer Services Department,Informa UK Ltd, Sheepen Place, Colchester. CO3 3LP.Tel: 44 (0)20 7017 5532 Fax: 44 (0)20 7017 4781Annual subscription to The Review: UK 488;Europe 598; US/rest of world : 804Neither the publisher nor the sponsor acceptany responsibility for any inaccuracies, errors or omissions contained in this publication. Interested partiesshould rely on their own enquiries. 2008 Informa UK Ltd. All rights reserved; nopart of this publication may be reproduced, storedin a retrieval system, or transmitted in any form orby any means, electrical, mechanical, photocopying, recording or otherwise without the prior written permission of the publisher.6 Catastrophe modelling fundamentalsCatastrophe models can trace their roots back to the1800s but today’s sophisticated techniques are helpingto manage 21st century risks. Patricia Grossi andCheryl TeHennepe explain.CHAPTER 210 Catastrophe modelling applicationsJosh Ellingson and Matthew Novak examine hurricanemodelling; Sahar Safaie and Chesley Williams look atmodelling earthquake risk; while Maria Lamelo explainsterrorism models.CHAPTER 312 Exposure data qualityHurricane Katrina propelled the importance of accurateexposure data to the top of the boardroom agenda, where itmust remain, say Ajay Lavakare and Kenna Mawk.CHAPTER 415 Risk mitigation and policyRe/insurers must embrace risk mitigation if they are to weatherthe host of challenges facing the industry in the long-term, sayCeline Herweijer, Nicola Patmore, Bob Ward and MichaelYoung.CHAPTER 518 Capital marketsThe potential of transferring cat risk to the capital markets is yetto be fully tapped, say John Stroughair and Ben Brookes.CHAPTER 621 New risk modelling frontiersThe cat modelling world is expanding its horizons tocover an even broader array of risks in the future, explainsRobert Muir-Wood.The Review A Guide to Catastrophe Modelling 20083
Cat modelling guide 20085/12/0817:33Page 4EDITORIALA shifting spectrumrom floods in Australian mines, to the devastation leftbehind by Hurricane Ike, 2008 was an active year forinsured catastrophe losses.Even with the close of the North Atlantic hurricane season,the toll of natural disasters across the world continues tosteadily mount.By all accounts, we should steel ourselves for more of the same in thefuture.Recent figures from one leading reinsurer put weather-related insuredlosses at a projected 40bn a year by 2010.Of course the impact of global warming must be factored into theequation, adding to the increasing numbers of climate-linked events andtheir intensity.Meanwhile, growing risks from terrorism, earthquakes and epidemicsmean that in the near future insured catastrophe losses may hit over 100bn in severe years.And if all that wasn’t enough to contend with, another peril has beenrecently making its presence truly felt in the global credit markets – that ofthe financial crisis.In a world of increasing uncertainty one thing is sure – bigger and morefrequently occurring catastrophes are set to test the mettle of modellingcompanies in the extreme.Over the past century, catastrophe modelling technology has progressedfrom little more than a collection of maps to the cutting edge application wesee today.But in the modern world, issues such as exposure data quality and riskmitigation have moved to the forefront, urgently requiring the attention ofboth re/insurers and policymakers.Today, risk managers must contend with a mind-boggling array of perilsfor which they must attempt to make the best possible preparations.Therefore, the art and methodology of modelling has never been sosharply under focus from all angles.In such an environment, this guide’s illuminating insight into the world ofmodels and explanation of how they can aid with an ever shifting spectrumof risk, is most timely.FRuth LytheDeputy EditorThe Review – Worldwide Reinsurance4The Review A Guide to Catastrophe Modelling 2008
Cat modelling guide 20085/12/0817:33Page 5INTRODUCTIONLearning lessonsfrom the unexpectedThe human and financial consequences of catastrophes – whetherthese are earthquakes, hurricanes or floods, disease pandemics orterrorist attacks – can be devastating. However, risks are rising, as populations grow along exposed coastlines and mega-cities rapidly expand,and a warmer climate affects the frequency of some extreme events, suchas wildfires and flash floods, as well as the intensity of hurricanes.Catastrophic risks are inherently challenging to model, due to the limitedknowledge about what determines the probability of extremeevents occurring, and the need to understand all the potentialThe more that users ofcatastrophe modelspathways to loss. But models provide a mechanism to integrateunderstand about howand synthesise all the relevant science, data, engineeringthey are developed andknowledge and even behaviour of claimants and insurers in thecalibrated, the betterenabled they are toaftermath of a catastrophe. They also provide an environmentmake informedand toolset in which all this knowledge can then be harnessed bydecisions on how tore/insurers, property owners and policymakers to make informedstress test their pricingand accumulationrisk management and mitigation decisions. While originallystrategiesfocused on managing risks in countries with establishedinsurance industries, catastrophe models are also being usedtoday to help create new risk transfer mechanisms in the developing world.Uncertainty lies at the heart of risk modelling, and demands an appreciation at allstages, including in the quality and completeness of the exposure data fed into themodels and in the interpretation of model results. The more that users of catastrophemodels understand about how they are developed and calibrated, and the quality ofthe data on insureds, the better enabled they are to make informed decisions on howto stress test their pricing and accumulation strategies.This guide aims to outline the foundations of catastrophe modelling by providingbackground information on how specific perils are modelled, as well as how theresulting loss metrics are used by re/insurers. It traces catastrophe modelling from itsresearch beginnings to its present status as a core business application, and coverskey issues related to best practice in the use of models within the world ofre/insurance. For those in the industry who are aware of cat models, but are notfamiliar with the concepts or applications, I hope this provides an introduction to howprobabilistic models can aid in making better risk management decisions for eventswe cannot predict but can prepare for.Hemant ShahPresident and CEORMSThe Review A Guide to Catastrophe Modelling 20085
Cat modelling guide 20085/12/08CHAPTER 117:33Page 6THE ESSENTIALSCatastrophe modellingfundamentalsCatastrophe models can trace their roots back to the 1800sbut today’s sophisticated techniques are helping to manage 21stcentury risks, explain Patricia Grossi and Cheryl TeHennepeORIGINS OF CATASTROPHEMODELLINGCatastrophe modelling has itsorigins both in the field ofproperty insurance and in thescience of natural hazards. Inthe 1800s, residential insurerscovering fire and lightning riskused pins on a wall-hung mapto visualise concentrations ofexposure. The common practiceof mapping ended in the 1960swhen it became toocumbersome and timeconsuming to execute.The origin of catastrophemodelling also lies in themodern science ofunderstanding the nature andimpact of natural hazards. Inparticular, the common practiceof measuring an earthquake’smagnitude or a hurricane’sintensity is one of the keyingredients in a catastrophemodel. A standard set ofmetrics for a given hazard mustbe established so that risks canbe assessed and managed. Thismeasurement began in the1800s as well, when the firstmodern seismograph,measuring earthquake groundmotion, was invented and6The reliability ofsuch modelsdepends heavily onan understanding ofthe underlyingphysicalmechanisms thatcontrol theoccurrence andbehaviour ofnatural hazardsmodern versions of theanemometer, measuring windspeed, gained widespreadusage.These two separatedevelopments – mapping riskand measuring hazard – cametogether in a definitive way inthe late 1980s throughcatastrophe modelling.Computer-based models formeasuring catastrophe losspotential were developed bylinking scientific studies ofnatural hazard measurementsand historical occurrences withadvances in informationtechnology and geographicinformation systems (GIS).While the birth ofprobabilistic catastrophe riskmodelling occurred in the late1980s, the use of suchsophisticated, technical meansof monitoring risks was notwidely accepted untilHurricane Andrew madelandfall in Southern Florida in1992. As a result of theunprecedented losses,insurance companiesstruggled to stay in businessand catastrophe riskmanagement was changedforever. It became clear that aprobabilistic approach to lossanalysis was the mostappropriate way to managecatastrophe risk. HurricaneAndrew illustrated that theactuarial approach tomanaging catastrophe riskwas insufficient; a moresophisticated modellingapproach was needed.Today, catastrophe modelsare prevalent throughout theinsurance industry, assistingre/insurers and otherstakeholders in managingtheir risk from both naturalperils and more recently, manmade catastrophes, across theglobe.The Review A Guide to Catastrophe Modelling 2008
Cat modelling guide 20085/12/0817:33Page 7THE ESSENTIALSSTOCHASTIC EVENT MODULE:DEFINING THE HAZARD PHENOMENAThe first stage of catastrophe modellingbegins with the generation of a stochasticevent set, which is a database of scenario events. Eachevent is defined by a specific strength or size, locationor path, and probability of occurring or event rate.Thousands of possible event scenarios are simulatedbased on realistic parameters and historical data toprobabilistically model what could happen over time.HAZARD MODULE: ASSESSINGTHE LEVEL OF HAZARDThe hazard component of catastrophemodels assesses the level of physicalhazard across a geographical area at risk. Forexample, an earthquake model estimates the level ofground motion across the region for each earthquakein the event set, considering the propagation of seismicenergy. For hurricanes, a model calculates the strengthof the winds around a storm, considering the region’sterrain and built environment.VULNERABILITY MODULE:QUANTIFYING THE PHYSICAL IMPACTOF HAZARD ON PROPERTIES AT RISKThe vulnerability component calculates theamount of expected damage to the properties at risk.Vulnerability functions are region-specific, and vary bya property’s susceptibility to damage from earthquakeground shaking or hurricane winds. Parametersdefining this susceptibility include a building’sconstruction material, its occupancy type, its year ofconstruction, and its height. In catastrophe models forinsurance applications, different vulnerability curves areused to estimate damage for a structure, its contents,and time element coverages such as businessinterruption loss or relocation expenses. Damage isquantified as a mean damage ratio, which is the ratioof the average anticipated loss to the replacementvalue of the building. This module also includes criticalestimates of uncertainty around expected damage (ie,standard deviations).Together, the stochastic event, hazard andvulnerability modules comprise what is traditionallyknown as a probabilistic risk analysis.FINANCIAL MODULE: MEASURING THEMONETARY LOSS FROM VARIOUSFINANCIAL PERSPECTIVESCatastrophe loss models can be thoughtof as one application of probabilistic risk analysis,characterised by their refinement of the financialanalysis module. This module translates physicaldamage into total monetary loss. Estimates of insuredlosses are then computed by applying policy conditions(eg, deductibles, limits) to the total loss estimates.MTHE STRUCTURE OF CATASTROPHE MODELSModels, by definition, provide a representationof complex physical phenomena. While it isgenerally agreed that a probabilistic approachis the most appropriate method to model thecomplexity inherent in catastrophes,probabilistic modelling itself is multifaceted. Itrequires simulating thousands ofrepresentative, or stochastic, catastrophicevents in time and space; compiling detaileddatabases of building inventories; estimatingphysical damage to various types of structuresand their contents; translating physicaldamage to monetary loss; and, finally,summing over entire portfolios of buildings.From the modeller’s perspective, the task is tosimulate, realistically and adequately, the mostimportant aspects of this very complex system.Risk managers need to familiarise themselveswith the underlying assumptions of the modelsand understand the implications andlimitations of their output in order to utilise theresults effectively.Catastrophe models require substantialamounts of data for model construction andvalidation. In addition, the reliability of suchmodels depends heavily on an understandingof the underlying physical mechanisms thatcontrol the occurrence and behaviour of naturalhazards. While no one individual would claimto have a complete understanding of all theintricacies of these physical systems, scientistsand engineers, aided by increasinglysophisticated instrumentation and computingcapabilities, have accumulated vast amounts ofinformation and knowledge in these areas. Byincorporating this information, thesophisticated theoretical and empirical modelscurrently being developed can reasonablysimulate these complex phenomena.The basic framework for modelling theimpacts of natural hazards on buildinginventories can be broken down into thefollowing four modules: Stochastic Event Module Hazard Module Vulnerability Module Financial Analysis ModuleCHAPTER 1The Review A Guide to Catastrophe Modelling 20087
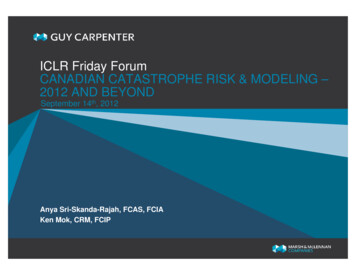
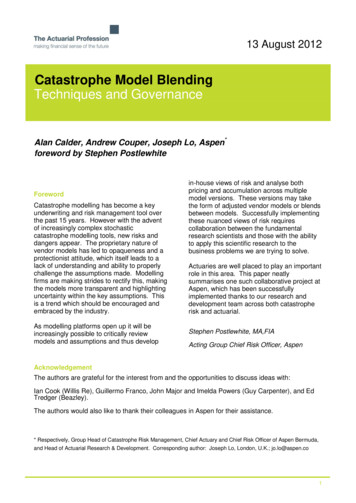
Cat modelling guide 20085/12/08CHAPTER 117:33Page 8THE ESSENTIALSMODELLED OUTPUT –THE KEY STATISTICSThe main output of aprobabilistic catastrophe modelis the exceedance probability(EP) curve, which illustrates theannual probability of exceedinga certain level of loss. Typically,EP curves are displayedgraphically, but they can alsobe summarised by key returnperiod loss levels. For example,a 0.4% annual probability ofexceedance corresponds to a250-year return period loss (ie,1/250 0.4%).One key risk metric derivedfrom an EP curve is the averageannual loss (AAL). AAL is anestimate of the annualpremium needed to coverlosses from the modelledperil(s) over time, assumingthat the exposure remainsconstant. It can be calculatedas the area under the EP curveor as the sum product of themean loss and the annuallikelihood of occurrence (ie, theevent rate) for each event inthe event set, and can be usedto evaluate the catastropheload portion of an insurancerating function. AAL is oftenreferred to as the purepremium or ‘burn cost’.In addition, the uncertaintyaround the AAL also plays arole in measuring risk. Forexample, the coefficient ofvariation (CV), defined as thestandard deviation divided bythe mean (AAL), gives anindication of the variabilityaround the AAL estimates. Thestatistic is a normalisedmeasurement and isappropriate for comparing thevolatility of one exposure toanother.As a simple example,consider the following two setsof numbers:Distribution A: 20, 25, 30Distribution B: 0, 25, 50Both distributions have anaverage value of 25.Distribution A has littlevariation from the averagevalue, while distribution B hasa wide variation from 0 totwice the average. Since theCV allows us to compare thevolatility of one distribution toanother, we should expect thatthe CV of distribution B will behigher than that of distributionA, which is true (CVDist-A 0.2 and CVDist-B 1.0).APPLYING RESULTSTO MANAGE RISKModelled loss results providevaluable insight into thepotential severity andfrequency of catastrophiclosses, and into the volatility ofthe analysed risks. Thequantification of thesecomponents can then be usedto assist companies with criticaldecisions around key issuessuch as portfolio management,individual risk assessment, andpricing. The following exampleshows how modelling outputcan be used to ascertain theANNUAL EXCEEDANCE PROBABILITY (EP)SUMMARY RESULTS OF AN EP ANALYSIS10.0%After running an EPanalysis, the summaryresults are as ETURN AMOUNTPERIOD( %100282.00%502010.00%10480LOSS ( M)8The Review A Guide to Catastrophe Modelling 2008
Cat modelling guide 20085/12/0817:33Page 9CHAPTER 1THE ESSENTIALScompatibility of a company’sportfolio with its risk appetiteand to compare the potentialvolatility of two risks.A fictitious commercialinsurance company called AtRiskProperty Insurance is exposed tohurricane risk in the state ofFlorida. AtRisk feels prepared toretain a loss up to 30m, whichis 15% of its policyholdersurplus. AtRisk realises that itcannot achieve 100% certaintyand remain in business;however, being a conservativeorganisation, it would like to feelconfident it will not exceed 30m from a single event in anygiven year 99.6% of the time.AtRisk reviews the 1-in-250year return period loss, which isthe level where it has a 0.4%chance of exceeding 40m in ayear, ie, a 99.6% chance of notexceeding 40m in a year.AtRisk is concerned that this lossis 10m higher than itspreviously stated target of 30m. Armed with thisinformation, it can now identifyoptions for moving closer to itsgoal, such as: Purchasing additionalreinsurance Reviewing policy structuresand data quality Diversifying so thatpremiums increase fasterthan losses Reviewing its risk appetite. Patricia Grossi is seniorresearch scientist, scienceand technology research.Cheryl TeHennepe,CCRA is vice president,client training at RMS.HOW MODELS CAN HELP TO MANAGE RISKMr Smith, an underwriter, is reaching his capacity limit in MiamiDade County. He has just received two submissions for new business.Writing either account will mean declining any future business unlesshe gets further approval. Mr Smith asks the modelling team toprovide him with hurricane loss estimates to help him determinewhich risk is more acceptable.Standard DeviationCVAccount APure Premium (AAL)24,000135,0005.6Account B30,00086,0002.9After considering a 15% expense load on the pure premium,Account A appears to carry a lower risk than Account B.Account A1.15* 24,000 27,600Account B1.15* 30,000 34,500However, Mr Smith is also concerned with managing the year-onyear hurricane results for his portfolio, and is therefore apprehensiveabout basing his decision solely on average annual loss. Using CV asthe comparative metric, he sees that Account A is almost twice asvolatile as Account B. In addition to the 15% expense load, Mr Smithadds 20% of the CV to build a ‘technical price’ so that both averageannual hurricane loss and volatility are considered in his analysis.Based on this new information, Mr. Smith decides to write Account B.Account A(1.15* 24,000) (20%* 135,000) 54,600Account B(1.15* 30,000) (20%* 86,000) 51,700This example provides a simple introduction to the ways in whichanalytical methods can help to identify and manage risk. Modelresults and the data underlying catastrophe models can helpcompanies with pricing, portfolio management, traditionalreinsurance purchasing, alternative risk transfer, insurance andreinsurance design, portfolio optimisation, rating agency analysesand many other core business decisions.The Review A Guide to Catastrophe Modelling 20089
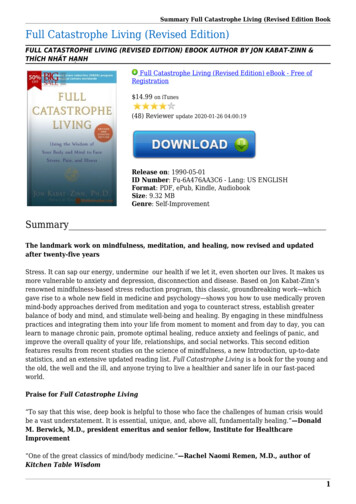
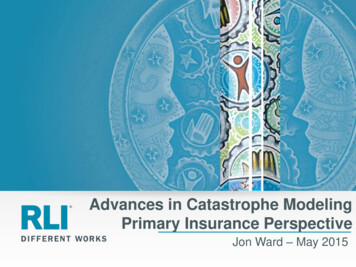
Cat modelling guide 2008CHAPTER 25/12/08Page 10CAT MODELLING APPLICATIONSMODELLING HURRICANE RISKMODELLING EARTHQUAKE RISKModels can simulate theentire life cycle of a hurricane,explain Josh Elllingson andMatthew NovakModels must take into accounta range of measurements to gaugean earthquake’s impact, saySahar Safaie and Chesley WilliamsA hurricane is a low-pressurecyclonic system with the lowestpressure at its centre, or eye, whereits intensity potential is a function ofthe underlying sea surfacetemperatures (SSTs) and winds aloft,with respect to speed and direction,eg, vertical wind shear.Hurricane catastrophe modelssimulate thousands of potentialhurricane tracks based onatmospheric parameters and science,as well as the historical record,creating event sets used toprobabilistically model possibleoutcomes over time from virtually anyevent. The storm tracks represent theentire lifecycle of a hurricane, frominitial development, to potentialtransition and eventual decay.To accurately capture the change,the model calculates wind speeds atat intervals ranging from minutes tohours depending on the forwardspeed of the hurricane.MODELLING WIND SPEEDAND STORM SURGETo determine the amount ofdamage caused by wind at alocation, the time-stepping processapplies the peak gust wind speedrecorded at that location.To model the peak wind gust in away that accurately reflects actualhurricanes, key parameters ofhurricanes must be captured in thedata: central pressure, the hurricanetrack or path, and the distance fromthe centre of the eye to the area ofmaximum winds, known as the1017:33Stochastic hurricane storm tracksdemonstrating the possible outcomeof Hurricane Ivan in 2004radius of maximum winds (Rmax).Rmax characterises storm ‘size,’and can vary from storm to storm.Rmax indicates where the highestwind speeds are and thus where themaximum damage is likely to occur.Models must also account fordamage from storm surge – quicklyrising ocean water levels that cancause widespread coastal flooding.ASSESSING DAMAGEThe track of the hurricane has asignificant impact on the damage itinflicts, with the greatest damageoccurring in areas closest to the eyeof the hurricane. A location’sdistance from the coast is also animportant factor, as storm surge canhave devastating effects.A building’s vulnerability tohurricane risk is highly dependenton its structural characteristics. Forexample, a wood-frame dwellinghas a higher risk of damageabilityfrom winds than a reinforcedconcrete building. Having detailedinformation on buildingcharacteristics improves the qualityof the loss estimate. Josh Ellingson CCRA is seniordirector, client training at RMS.Matthew Novak is senioraccount manager at RMS.There are two common parametersused to assess an earthquake’s effects:magnitude, a quantitative measure ofthe amount of energy released; andintensity, a qualitative assessment of anearthquake’s shaking effects at alocation measured using the ModifiedMercalli Intensity (MMI) scale. Whereasearthquake intensity decreases withdistance from the epicentre, themagnitude assigned to an earthquake islocation independent.Spectral Acceleration: Buildings ofdifferent heights respond differently to thesame ground motion because they havedifferent vibrational periodsSIMULATING EARTHQUAKE EVENTSThe stochastic earthquake event setcharacterises the observed orscientifically modelled probabilities ofearthquake size, frequency ofoccurrence and location.There are two basic elements used todefine an earthquake event set. The firstis a geographic definition of faultsource. The second assesses theprobability of an earthquake occurringon each fault source, and the associatedrates of earthquake occurrence forpotential event magnitudes. To assessearthquake hazard, the modelcalculates the amount of ground motionat a particular location for everystochastic event.The Review A Guide to Catastrophe Modelling 2008ddcbufsFTTlfracrbctrdvisnssdopmcstwc
Cat modelling guide 20085/12/0817:33Page 11CAT MODELLING APPLICATIONSKMODELLING TERRORISM RISKGround motion attenuation – thedecay of ground motion intensity withdistance from the event source – is alsoconsidered. The decay is characterisedby an empirical function called an attenuation relationship, which is affected byfactors including distance from thesource and the geological environment.nFROM GROUND MOTIONTO BUILDING DAMAGETo assess structural damage at asisostlocation, earthquake vulnerabilityfunctions are used to model therelationships between ground motionand the level of damage. Damagecalculations also utilise the accelerationresponse spectrum, which defines howbuildings with different constructioncharacteristics are expected to respondto a single ground motion. A building’sresponse to ground motion at a site isdirectly correlated to the naturalvibrational period of the building, whichis influenced by the height, the structuralsystem, and the building material.Thus, when assessing building vulnerability to earthquakes, a building’sstructural characteristics such as construction type, height, and constructiondate play a significant role in the qualityof the damage assessment. For example, an unreinforced masonry building ismuch more vulnerable than a reinforcedconcrete building. The building’s construction date is also a considerable factor as it identifies the building codewhich has been followed in design andconstruction. edSahar Safaie is productmanager for America’s naturalcatastrophe models at RMS.nCHAPTER 2Chesley Williams is seniorproject director, model development at RMS.Everything from modes of attackto counter terrorism measures areincorporated into terrorismmodels, explains Maria LomeloIntent, capability and opportunityinfluence the targeting strategy ofmajor terrorist groups. Modellersbegin by defining those specificareas and targets of greatest interestto terrorist organisations, and usethe application of game theory toquantify attack likelihoods.To prioritise potential targets, aterrorist group’s ability to maximisethe expected ‘utility’ of an attack isassessed by considering not only thepotential economic loss and numberof casualties, but also the target’ssymbolic or inspirational value.Increased security ‘hardens’potential targets, decreasing thelikelihood of attacks at thoselocations – but at the same timeincreasing the likelihood of attacksat less secure targets.A number of representative attackmodes ranging from conventionalweapons to worst-case chemical,biological, radiological and nuclearattacks are incorporated into themodel. Each type of attack has arelative likelihood of occurrencebased on its logistical burden score.ASSESSING THEPROBABILITY OF ATTACKThe likelihood of having multipleattacks make up a single terrorismevent is also factored into the model.Attack multiplicity distributions aredetermined based on historicalattack patterns, target type defenses,weapons availability, the chance ofdetection and expert opinion.The Review A Guide to Catastrophe Modelling 2008The likely number of attacks in ayear is parameterised throughassessments of the number ofattempted attacks and theinterdiction rates. Governmentresponse to an attack decreases thelikelihood of successive attack.Probabilistic assessment of relativeterrorism risk for ManhattanDETERMINING EXPECTED DAMAGEDetailed analyses considering theeffects of explosions, aircraft impact,fire, decontamination andspreading of chemical andbiological agents through apopulation are performed to modelthe impact of potential terroristattacks on building stock. Althoughvulnerability functions are derivedbased on building characteristics –terrorism risk is typically notmitigated through measures such asbuilding reinforcement. The globalnature of terrorism risk requires thatmitigation factors involve activitiessuch as increased security and othercounter-terrorism activities. Maria Lomelo is the directorof client services, emerging riskmodels at RMS.11
Cat modelling guide 20085/12/08CHAPTER 317:33Page 12MODELLING DATAExposure data qualityHurricane Katrina propelle
approach was needed. Today, catastrophe models are prevalent throughout the insurance industry, assisting re/insurers and other stakeholders in managing their risk from both natural perils and more recently, man-made catastrophes, across the globe. CHAPTER 1 THE ESSENTIALS 6 The Review A Guide to Catastrophe Modelling 2008 Catastrophe .