Transcription
Member Salary SurveyFinal Report 2012Prepared by:
TABLE OF CONTENTS1.0 STUDY BACKGROUND AND METHODOLOGY. 32.0 SURVEY RESULTS . 52.1. BASE SALARY . 5Salary. 5Salary by Membership Status . 6Salary by Membership Status: Comparison Between 2009 and 2012. 7Salary by Gender . 8Salary by Gender: Comparison Between 2009 and 2012 . 9Salary by Year of Graduation. 10Salary by Year of Graduation and Gender. 12Salary by Post-Graduate Studies. 13Salary by Discipline . 14Salary by Years of Experience . 17Salary by Job Position . 21Salary by Sector of Employment. 22Salary by Sector of Employment: Comparison Between 2009 and 2012 . 242.2 BENEFITS AND OTHER REMUNERATION . 26Vacation by Employment Sector . 26Overtime Compensation . 29Benefits . 302.3 OVERALL SATISFACTION WITH REMUNERATION . 32APPENDIX: QUESTIONNAIRE . 33
Member Salary Survey 201231.0 Study Background and MethodologyOn behalf of the Professional Engineers and Geoscientists of Newfoundland and Labrador(PEGNL), Engineers Nova Scotia, the Association of Professional Engineers and Geoscientists ofNew Brunswick (APEGNB), and Engineers PEI, during April and May of 2012, MQO Researchconducted the 2012 Member Salary Survey. This survey was conducted in response to requestsfor current statistics on engineering salaries in the Atlantic region. The last salary survey wasconducted in 2009. To identify differences between years, comparisons between 2009 and 2012results are made throughout the report by membership status, gender and sector of employment.To identify differences between 2009 and 2012 data, statistical tests of significance have beencompleted at the 95% confidence level. Essentially, when comparing two values obtained fromdifferent populations, a statistical test will guide us to be confident that any apparent difference1between the values is statistically real or significant. Throughout this report, significantdifferences between 2009 and 2012 are shaded within the tables. Where this occurs, we can saythat we are 95% confident that the difference between the values in question exists in thepopulation and is not simply due to uncontrollable sampling error. It is important to note that theterm ‘significant’ is used to denote statistically significant differences, and it is not synonymouswith ‘important’.For PEGNL, Engineers Nova Scotia, and APEGNB, a sample of resident members, includingProfessional Engineers (P.Eng) and Engineers-in-Training (EIT), was randomly selected toparticipate in the survey. Due to the small membership base for Engineers PEI, a census of2resident P.Eng and EIT members was conducted. To ensure the sample is representative of thepopulation, weights were designed for analysis by designation, discipline and gender at theoverall and provincial levels.A quantitative telephone survey was completed with a total of 1,413 members who are employedfull-time or at least 30 hours per week. However, 58 completed surveys were removed fromanalysis because the respondents did not report salary. In addition, to minimize the effect of3outliers on salary statistics, a formula was used to determine an upper cut-off for base salary.The upper cut-off salary was 215,000. This process resulted in the exclusion of 20 completed4surveys. The table below presents the final sample sizes and margins of error by province ofregistration. Margin of error, or the level of precision, refers to the range, above or below thesample-based value, in which the true population value is estimated to fall.Province of RegistrationAll AssociationsPEGNLEngineers NSAPEGNBEngineers PEI1Sample Size1335374428383150Margin of Error 1,435 2,758 2,761 2,312 3,042What may seem to be a difference between percentages may simply be the result of sampling error or themargin of error associated with the sample size, and not a real or significant difference in the population.2The census resulted in a response rate of 52% for Engineers PEI.3Upper cut off Upper quartile (3 x Inter-quartile range). Lower cut off Lower quartile – (3 x Interquartile range). Inter-quartile range Upper quartile – Lower Quartile. The lower cut off was negative inmagnitude and thus did not apply.42 222 2Margins of error were determined based on the formula: n (Z s )/(C Z s /N-1), where: n sample size;s standard deviation; C confidence interval or margin or error; Z 1.96 or 95% confidence level; andN population size.
Member Salary Survey 20124Explanatory Notes1. Salary refers to base salary excluding bonuses and overtime for full-time employees whowork 30 or more hours per week.2. The mean refers to the numerical average.3. The median refers to the midpoint of the distribution – 50% of salaries fell above themedian and 50% fell below it.4. Upper Quartile – 25% of salaries fell above this point and 75% were below it. LowerQuartile – 75% of salaries fell above this point and 25% were below it.5. Greater consideration should be given to the median than to the mean when samplesizes are small. Medians are less likely to be influenced by a few very low or very highsalaries.It is important to note that while the overall sample size provides an acceptable margin of error,the format of the survey resulted in low sample sizes throughout specific sections of the study.Findings should be interpreted with caution for instances where sample sizes are less than 30.
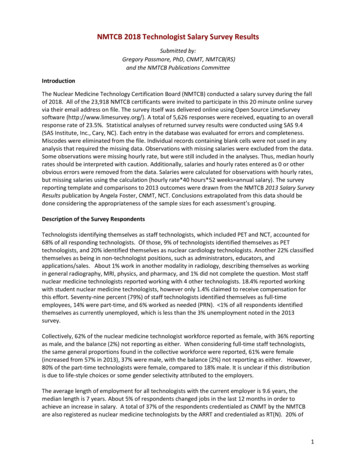
Member Salary Survey 201252.0 Survey Results2.1. BASE SALARYSalary5A-1: SalaryMeanMedian 120,000 100,000 97,941 93,000 94,415 92,000 83,734 80,000 80,000 78,176 78,308 60,000 40,000 20,000 0PEGNLAll AssociationsPEGNLEngineers NSAPEGNBEngineers PEI5Engineers NSAPEGNBMeanMedian 91,127 97,941 94,415 83,734 78,176 88,000 93,000 92,000 80,000 78,308Includes Professional Engineers and Engineers-in-Training.LowerQuartile 70,000 76,000 72,470 65,000 58,761Engineers PEIUpperQuartile 107,000 115,000 111,000 96,000 90,982
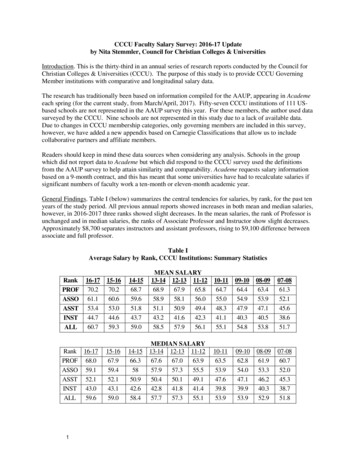
Member Salary Survey 20126Salary by Membership StatusA-2: Engineer-in-TrainingMeanMedian 120,000 100,000 80,000 71,137 65,225 60,761 54,697 60,000 60,000 54,647 54,000 50,695 40,000 20,000 0PEGNLEngineers NSAPEGNBEngineers PEIA-3: Professional EngineerMean 120,000 103,446 100,000Median 101,505 100,000 100,000 87,108 85,000 86,710 81,072 80,000 60,000 40,000 20,000 0PEGNLEngineers NSAPEGNBEngineers PEI
Member Salary Survey 20127Salary by Membership Status: Comparison Between 2009 and Engineer-in-TrainingAll AssociationsPEGNLEngineers NSAPEGNBEngineers 65,22554,00060,00050,69551,00060,000 48,94450,97846,338All AssociationsPEGNLEngineers NSAPEGNBEngineers ,958100,00094,00090,101Professional 000116,776100,00099,192Shading indicates significant differences between 2009 and 2012 for the mean salaries.
Member Salary Survey 20128Salary by Gender7A-4: FemaleMeanMedian 120,000 100,000 86,214 85,000 81,430 80,000 78,607 75,999 79,514 78,604 72,758 60,000 40,000 20,000 0PEGNLEngineers NSAPEGNBEngineers PEIA-5: MaleMeanMedian 120,000 100,108 100,000 95,895 96,261 95,000 84,963 83,000 80,000 78,671 78,066 60,000 40,000 20,000 0PEGNL7Engineers NSAPEGNBGender differences in salary may be attributable to differences in years of experience.Engineers PEI
Member Salary Survey 20129Salary by Gender: Comparison Between 2009 and FemaleAll AssociationsPEGNLEngineers NSAPEGNBEngineers ,806All AssociationsPEGNLEngineers NSAPEGNBEngineers Male8110,000118,764114,813100,00092,408Shading indicates significant differences between 2009 and 2012 for the mean salaries.
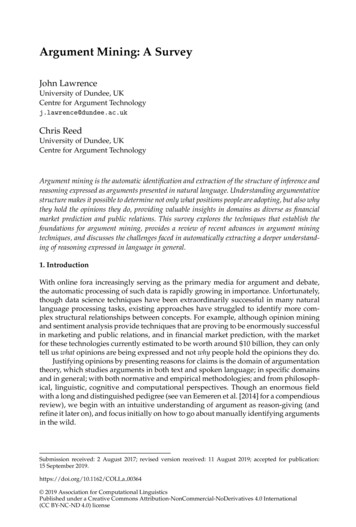
1969 or 52006200720082009201020112012Member Salary Survey 201210Salary by Year of GraduationA-6: Salary by Year of Graduation(All Associations) 140,000MeanMedian 120,000 100,000 80,000 60,000 40,000 20,000 0
Member Salary Survey 2012Graduation Year1969 or 52006200720082009201020112012# 3,15985,78068,00065,00062,97757,882-
Member Salary Survey 201212Salary by Year of Graduation and GenderA-6: Salary by Year of Graduation and Gender(All Associations)MaleFemale 140,000 120,000 100,000 80,000 60,000 40,000 20,0001969 or 52006200720082009201020112012 0
Member Salary Survey 201213Salary by Post-Graduate StudiesA-8: Salary by Post-Graduate StudiesMean SalaryPost-Graduate Degree 120,000No Post-Graduate Degree 106,037 100,000 98,601 97,815 91,258 91,745 87,266 81,157 76,573 80,000 60,000 40,000 20,000 0PEGNLEngineers NSAPEGNBEngineers PEISalary by Post-Graduate DegreeA-9: Salary by Post-Graduate Degree (All Associations) 105,000 103,441 100,000 94,974 95,000 93,544 89,230 90,000 85,000 80,000EngineeringMBAOtherNo Post-Graduate Degree
Member Salary Survey 201214Salary by Discipline9A-10: Salary by Discipline (All Assocations)MeanMedian 97,510 95,000Eletrical / Electronic 89,851 87,827Civil 90,824 88,000MechanicalIndustrial 93,559 85,000Mining / Metallurgical 93,741 88,000Naval Architecture 95,842 89,256Chemical 95,461 90,000 87,593 89,000Agricultural / Biological 79,153 75,920Other 09 20,000 40,000 60,000 80,000 100,000 120,000There were no respondents from PEI working in Naval Architecture therefore PEI is omitted from the graphfor this discipline.
Member Salary Survey 201215A-11: Salary by DisciplineMean SalaryEngineers PEIAPEGNBEngineers NSPEGNL 93,340 96,889 95,977 100,919Eletrical / Electr
Member Salary Survey 2012 8 Salary by Gender 7 7Gender differences in salary may be attributable to differences in years of experience. 86,214 81,430 75,999 72,758 85,000 78,607 78,604 79,514 0 20,000 40,000 60,000 80,000 100,000