Transcription
ARIZONA COMMUNITY COLLEGES2015 OUTCOMES REPORTArizonaCommunityColleges.org
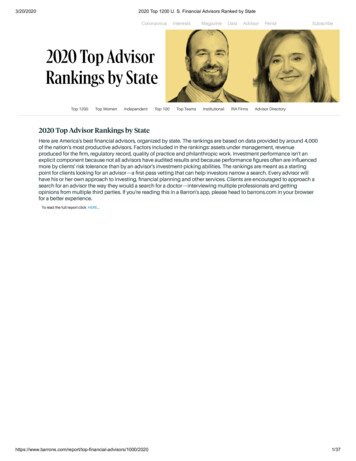
OUR VISIONArizona’s community colleges, through acollaborative effort with education, businessand community partners, will significantlyincrease the number of Arizonans whoachieve their postsecondary education andtraining goals, complete a degree orcertificate, and/or transfer to a university.
GOALS COMPLETION, RETENTION, ACCESSCOMPLETIONDegree/Certificate CompletionPercent of Transfers with AGEC and/or DegreePercent of Occupational Learners Earning CredentialsPercent of Learners Achieving a Successful Outcome2-34-56-78-9RETENTIONFall-to-Fall RetentionCourse Success10-1112-13ACCESSSuccess After Remediation14-15APPENDIXACCESS IndicatorsRETENTION IndicatorsCOMPLETION Indicators161718-19
ACHIEVING OUR GOALS“Strong economies are characterized by anabundance of well-paying jobs; and overwhelmingly,well-paying jobs are held by individuals who haveknowledge and skills obtained through educationbeyond high school.”¹By improving retention and completion rates, and bysafeguarding access for all learners, Arizona’scommunity colleges will help to generate a morerobust economy, support a growing workforce, andcreate better opportunities for future generations ofArizonans.
INTRODUCTIONIn 2011, Arizona’s community colleges embarkedupon a long-term Strategic Vision to significantlyincrease the number of Arizonans who achieve theirpostsecondary education and training goals,complete a degree or certificate, and/or transfer to auniversity.In order to measure progress toward the threemajor goals outlined in the Strategic Vision, thecolleges have implemented a rigorous selfassessment and accountability process centeredaround the annual collection and distribution ofdata related to 30 key indicators.Statewide data pertaining to these 30 indicators canbe found in the 2015 Strategic Vision StudentProgress and Outcomes Report, and online is document complements the larger report, andfor 7 core metrics illustrates how each of Arizona’s 10community college districts compares to the othersand to statewide averages. An appendix providescomparison data for all 30 indicators.It is important to note that Arizona’s communitycolleges differ substantially in terms of thepopulations served, education and training goals oflearners, and institutional priorities (such as transferor workforce preparation).Comparing student progress and outcomes acrossdistricts can be an extremely useful precursor to thesharing of best practices and successful programmodels across the state. However, each districtmust be assessed in light of its uniquecharacteristics, goals, and priorities, and mostimportantly, by its ability to demonstrateincremental improvements in student access,retention, and completion over time.As 2015 represents the fourth full year of StrategicVision data collection, the outcomes presented in thisdocument can be compared to those from previousyears, and trends in student progress and outcomesare starting to emerge. These trends will enableArizona’s community colleges to set reasonablebenchmarks for attainment related to core metrics.However, many external forces (such as the state ofArizona’s economy, the actions of other publicinstitutions of higher education, and the availability offunding for community colleges) also affect thesetrends, making long-term projections difficult.¹NCHEMS. (2007). The Emerging Policy Triangle: Economic Development, Workforce Development, and Education. Boulder, CO: Author.1
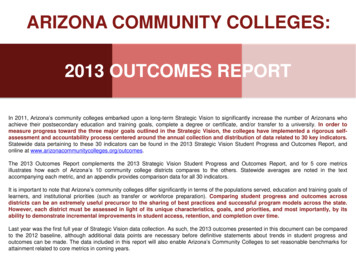
COMPLETION2DEGREE/CERTIFICATE COMPLETION
The figure on page 2 and those appearing elsewhere in this document illustrate student progress andoutcomes for Arizona Western College (AWC), Central Arizona College (CAC), Cochise College (CC),Coconino Community College (CCC), Eastern Arizona College (EAC), the ten colleges and two skillscenters in the Maricopa County Community College District (MCCCD), Mohave Community College(MCC), Northland Pioneer College (NPC), Pima Community College (PCC), and Yavapai College (YC).After six years, 32 percent of the statewide 2008 Credential-Seeking Cohort had completed a degree orcertificate. Graduation rates vary substantially among Arizona’s 10 community college districts and relate, inlarge part, to the percentage of learners at each district who transfer to a four-year university and/or gainemployment prior to earning a degree or certificate.The statewide rate—as well as the most recent graduation rates at 9 out of10 of Arizona’s community college districts—are equal to or higher than acomparative national rate (23 percent)² as the national number is notlimited to credential-seekers. However, because AACC’s VoluntaryFramework of Accountability (VFA) initiative is beginning to track andanalyze completion among credential-seeking sub-cohorts, more accuratenational comparisons should be available in future years.Credential-seeking cohorts are defined as full- and part-time learners whoearned at least 12 credit hours by the end of their second year. Tracking acredential-seeking cohort aligns Arizona’s data collection and accountabilitystrategies with those of national community college initiatives such as theVFA. Furthermore, analysis of graduation rates within this cohort provides amore accurate gauge of community college student success, as it takesinto account learners’ diverse education and training goals.“Where physicalcapital drivesindustrial economies,human capital driveseconomies of theinformation age.”Arizona ranks 5th inthe nation in annualcredentials anddegrees awarded attwo-year colleges. ³²U.S. Department of Education, National Center for Education Statistics. (2013). Digest of education statistics. Washington, DC: Author.³NCHEMS. (2007). The emerging policy triangle: Economic development, workforce development, and education. Boulder, CO: Author.3
COMPLETION4PERCENT OF TRANSFERS WITH AGECAND/OR DEGREE
Students who complete a common general education core and/or a degree prior totransfer are better prepared for upper-division work and earn bachelor’s degrees inless time and with fewer excess credits—both of which lead to cost savings forstudents and states.⁴The figure on page 4 depicts the percentage of each district’s transfer students between 2008-09 and 2013-14who completed the Arizona General Education Curriculum (AGEC) and/or a degree prior to transferring.Arizona’s tribal, public community colleges, and universities have agreed upon a common structure for theAGEC in order to ensure the comparability and seamless transfer of general education credits acrossinstitutions. The AGEC is comprised of 35-37 credit hours of coursework that, upon completion, will transfer toall tribal or public community colleges, as well as the three state universities, and meet lower division, generaleducation requirements.Although most community college students take courses included in the AGEC, some transfer prior tocompleting the full curriculum. While these “early transfers” are still viewed as successful completers, researchshows clear cost savings—for both students and the state—when transfers complete a common generaleducation core (such as the AGEC) and/or a degree prior to attending a university.⁴In order to improve the efficiency and cost-effectiveness of the transfer process in Arizona, the state’scommunity colleges are making a concerted effort to raise the proportion (currently 59 percent, statewide) ofin-state transfers who earn an AGEC and/or degree prior to transfer.⁴Kisker, C. B., & Wagoner, R. L. (2013). Implementing transfer associate degrees: Perspectives from the states. New directions for communitycolleges, no. 160. San Francisco: Jossey-Bass.5
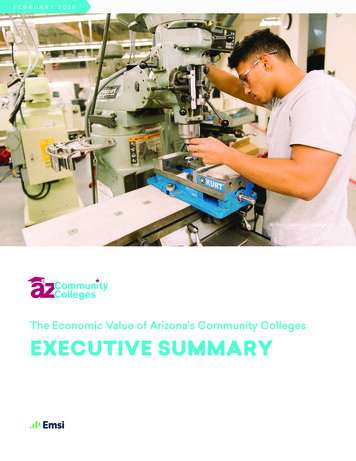
COMPLETION6PERCENT OF OCCUPATIONALLEARNERS EARNING CREDENTIALS
The figure on page 6 depicts the percent of learners in eachdistrict’s 2009-10, 2010-11, and 2011-12 OccupationalCompleters/Leavers Cohorts who took and passed a technical skillor end-of-program assessment aligned with industry-recognizedstandards up to one year after college exit. Statewide, 92 percentof the 2011-12 cohort passed the assessment and/or earned anindustry-recognized credential (degree, certificate, or award oflicensure). This level of performance exceeds the 2011-12 nationalaverage of 83 percent.⁵Every single one of Arizona’s 10 community college districtsboasted rates higher than the national average, with somecolleges showing near-perfect credentialing rates. Clearly,Arizona’s community colleges provide excellent occupationaltraining and preparation for industry-aligned assessments.Examples of occupational programs leading to industry-recognizedcredentials include, among others, aviation technology, buildingand construction, dental hygiene, education, emergency medicaltechnician, fashion, fire science, nursing, solar technologies, andveterinary technologies.Arizona’s communitycolleges collaborate withstate and local workforcedevelopment agencies, localbusinesses, and JointTechnical Education Districts(JTEDS) to design andprovide occupational andcontract training programsthat prepare learners forimmediate employment inhigh-demand areas.⁵Perkins Collaborative Resource Network. (2014). Core indicator report :1P1 technical skill attainment, 2011-12. Washington, DC: Author.7
COMPLETION8PERCENT OF LEARNERS ACHIEVINGA SUCCESSFUL OUTCOME
Aggregate outcomes measures provide “an improved way to reportundergraduate student progress and completion by including a greaterproportion of students as well as tracking students who enroll in multiplehigher education institutions. Usual measures of student progress andcompletion, including government-led efforts, usually underreport studentachievement because they do not account for an increasingly mobile studentpopulation.”⁶The figure on page 8 depicts the percent of learners in each district’s 2005-2008 Credential-Seeking Cohortsachieving a successful outcome after 6 years, defined as earning a degree or certificate, transferring toanother two- or four-year college or university, continued enrollment, and/or earning at least 30 credits beforeleaving the institution.Statewide, 81 percent of the 2008 Credential-Seeking Cohort achieved a successful outcome within six years,up from 77 percent for the 2005 cohort.This definition of a successful community college outcome is aligned with both the VFA initiative and thenational Student Achievement Measure (SAM) project. The latter was endorsed by six national associations(AACC, AASCU, ACE, AAU, APLGU, and NAICU) in summer 2013. Both VFA and SAM recognize thatlearners enter community colleges with diverse education and training goals, often attend part-time and formore than 6 years, and frequently earn credits from more than one institution en route to the university or to adegree or certificate.⁶Student Achievement Measure (SAM). (2014). Why is SAM important? Washington, DC: Author.9
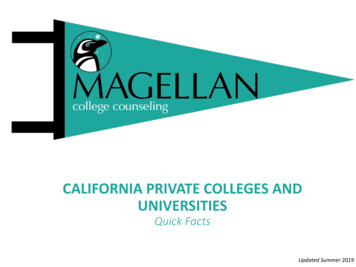
RETENTION10FALL-TO-FALL RETENTION
The figure on page 10 depicts fall-to-fall retention rates amongthe 2009-2012 Credential-Seeking Cohorts for each ofArizona’s 10 community college districts.Statewide, 77 percent of learners in all four Credential-SeekingCohorts (excluding those who successfully transferred and/orearned a degree or certificate) persisted at their district to thefollowing fall.The statewide rate—as well as the most recent retention ratesat 9 of Arizona’s 10 community college districts—aresomewhat higher than a comparative national rate (53percent),⁷ as the national number is not limited to credentialseekers. However, because the VFA is beginning to track andanalyze retention among credential-seeking cohorts, moreaccurate national comparisons should be available in futureyears.Credential-seeking cohorts are defined as full- and part-timelearners who earned at least 12 credit hours by the end of theirsecond year. Tracking a credential-seeking cohort alignsArizona’s data collection and accountability strategies withthose of national community college initiatives such as theVFA. Furthermore, analysis of retention outcomes within thiscohort provides a more accurate gauge of community collegestudent persistence, as it takes into account learners’ diverseeducation and training goals.First-year retention has adirect, straight-linecorrelation with six-yeargraduation rates.⁸ Ifstudents do not stay incollege, they will notgraduate from college.Arizona’s communitycolleges have adoptedmandatory orientations,advisement, placement,and/or student successcourses to ensure thatlearners start strong andhave personalizedacademic plans to keepthem on track toward theiracademic or occupationalgoals.⁷NCHEMS. (2010). Retention rates—First-time college freshmen returning their second year (two-year public institutions). Boulder, CO: Author.⁸Florida State University Student Success Team. (2013). Practical steps to improving retention and graduation rates. Tallahassee, FL: Author.11
RETENTION12COURSE SUCCESS
The figure on page 12 depicts developmental and college-levelcourse success rates among the 2009-2012 New Student Cohortsfor each of Arizona’s 10 community college districts.Over two years, 61 percent of student credit hours attempted indevelopmental courses by the statewide 2012 New Student Cohortwere successfully completed (with a grade of A, B, C, or Pass), aswere 76 percent of student credit hours attempted in college-levelcourses.These rates show some variability from year to year, which is likelya reflection of the interplay between a greater number of learnerspassing courses and a more robust economy, which may be luringstudents out of the classroom and into the workplace.Although national course success rates are not yet available, theseindicators are aligned with those included in the VFA initiative,which will allow for comparisons with national norms in years tocome.Course success rates are animportant barometer of acollege’s ability to retainstudents throughout a termand assist them in makingprogress toward theireducational or training goal.Arizona’s communitycolleges have implementednumerous academicmonitoring and “intrusive”advising services to identifyand assist at-risk students.13
ACCESS14SUCCESS AFTER REMEDIATION
States will need to pay attention to “reentry” students—those who dropped out of highschool and those who never completed a college credential. “It is this group of studentswho need higher levels of skills if the states and the country are to remain economicallycompetitive.”⁹Arizona leads the nation in enrollment of learners age 25-49 as a percentage of adults witha high school diploma but no college. Successful remediation programs allow Arizona toretrain its existing workforce and build a more vibrant economy.The figure on page 14 depicts the percentage of developmental math and English/reading learners in eachdistrict’s 2005-2008 New Student Cohorts who successfully completed a college-level course in math (35percent, statewide) or English (50 percent, statewide) within six years.While true comparisons with national norms will not be possible until the VFA begins publishing national datafor these and other indicators, a study conducted by scholars at Columbia University’s Community CollegeResearch Center¹⁰ showed that 20 percent of community college students referred to developmental math—and 37 percent of community college students referred to developmental English/reading—completed acollege-level course in the corresponding subject area within three years. These national success afterremediation rates are somewhat lower than Arizona’s rates, but are likely comparable, as the national studywas limited to three years.⁹NCHEMS. (2007). The emerging policy triangle: Economic development, workforce development, and education. Boulder, CO: Author.¹⁰Bailey, T., Jeong, D. W., & Cho, S. W. (2010). Referral, enrollment, and completion in developmental education sequences in communitycolleges. Economics of Education Review, 29, 255-270.15
APPENDIX: ACCESS INDICATORS2015 STUDENT PROGRESS AND OUTCOMES DATA (BY DISTRICT)Access Indicators1. 2013-14 full-time student equivalent (FTSE)enrollmentStatewideNationalAWCComparison ComparisonCACCCCCCEAC 8,4542,9191,825 17,9634,0022a. Enrollment of underserved populations(underserved %2b. Enrollment of underserved populations(age 25 )41%40%¹¹32%45%46%33%53%39%46%39%42%63%2c. Enrollment of underserved populations(Pell %3. Percent of 2013-14 credit hours earned viaalternative delivery methods and/or atalternative times or places63%-65%62%86%49%19%64%60%69%61%55%4. Community college-going rate37%26%¹²25%31%31%18%22%33%33%11%43%26%5. Overall college-going rate58%¹³66%¹²----------6. Succes after developmental math rate35%20%¹⁴51%33%35%31%56%39%21%13%26%39%7. Success after developmentalEnglish/reading rate50%37%¹⁴56%37%46%66%62%49%24%19%53%52%8. Cost of attendance as a percentage ofArizona (or county) median household income16%-22%10%11%18%17%15%29%27%6%18%¹¹U.S. Department of Education, National Center for Education Statistics. (2013). Digest of education statistics. Washington, DC: Author.¹²U.S. Department of Labor, Bureau of Labor Statistics. (2014). College enrollment and work activity of 2013 high school graduates. Washington,DC: Author.¹³Postsecondary Education Opportunity. (2013). Chance for college by age 19 by state, 1986 - 2012. Oskaloosa, IA: The Mortenson Seminar onPublic Policy Analysis and Opportunity for Postsecondary Education.¹⁴Bailey, T., Jeong, D. W., & Cho, S. W. (2010). Referral, enrollment, and completion in developmental education sequences in communitycolleges. Economics of Education Review, 29, 155-270.16
APPENDIX: RETENTION INDICATORS2015 STUDENT PROGRESS AND OUTCOMES DATA (BY DISTRICT, CONT.)Retention IndicatorsStatewideNationalAWCComparison ComparisonCACCCCCCEAC MCCCDMCCNPCPCCYC9. Developmental course success rate61%VFA72%47%65%64%57%67%45%61%52%57%10. College-level course success rate76%VFA76%79%82%77%80%75%73%74%75%82%11a. Percent of first college-level credit hourssuccessfully completed (English Comp. I)73%71%¹⁵70%60%76%74%61%75%72%75%62%69%11b. Percent of first college-level credit hourssuccessfully completed (English Comp. II)75%69%¹⁵74%59%79%72%67%75%83%82%70%75%11c. Percent of first college-level credit hourssuccessfully completed d. Percent of first college-level credit hourssuccessfully completed (College . Percent of full-time learnerscompleting 42 credits by the end of thesecond academic year45%VFA45%38%49%43%48%46%35%44%38%41%12b. Percent of part-time learnerscompleting 24 credits by the end of thesecond academic year51%VFA63%51%48%60%46%51%52%42%49%52%13. Fall-to-next-term retention rate90%VFA97%91%91%92%79%90%90%73%93%95%14. Fall-to-fall retention National Community College Benchmark Project. (2014). Report of national aggregate data. Overland Park, KS: Author.¹⁶NCHEMS. (2010). Retention rates—First-time college freshmen returning their second year (two-year public institutions). Boulder, CO: Author.17
APPENDIX: COMPLETION INDICATORS2015 STUDENT PROGRESS AND OUTCOMES DATA (BY DISTRICT, CONT.)Completion IndicatorsStatewideNationalAWCComparison ComparisonCACCCCCCEAC MCCCDMCCNPCPCCYC15. Percent of learners achieving statededucation or training goal--This indicator is in development. It will be incorporated into the Strategic Visiononce enough time has passed to link intention to completion data.16. Number of degrees and certificatesawarded in 541,46817. Graduation (degree/certificatecompletion) rate32%23%¹⁷39%37%34%20%31%32%24%23%30%38%18. Percent of learners who complete anAGEC within six years19%-23%8%19%16%17%20%8%7%21%26%19. Number of in-state university transfersin 2013-1410,507-3792592682221727,458166771,68228120. Percent of 2013-14 transfers with anAGEC and/or degree at time of transfer59%-71%70%75%53%75%57%69%53%60%62%21. In-state university transfer rate(2007-08 cohort)28%-25%22%19%29%16%29%15%15%31%23%22. Overall transfer rate (2008-09 . Percent of learners achieving asuccessful S. Department of Education, National Center for Education Statistics. (2013). Digest of education statistics. Washington, DC: Author.¹⁸ Center for the Study of Community Colleges. (2002). National transfer rates are up! Results of the 2001 Transfer Assembly Project. LosAngeles: Author.18
APPENDIX: COMPLETION INDICATORS2015 STUDENT PROGRESS AND OUTCOMES DATA (BY DISTRICT, CONT.)Completion Indicators (Cont.)StatewideNationalAWCComparison ComparisonCACCCCCCEAC MCCCDMCCNPCPCCYC24. Percent of 2010-11 full-time transfers toArizona public universities who earn abachelor's degree in four years68%-72%56%58%63%69%69%50%56%69%67%25. Percent of all 2010-11 transfers who earna bachelor's degree in four years42%60%¹⁹35%47%28%51%86%46%46%5%53%48%26. Percent of occupational programcompleters earning an industry-recognizedcredential within one . Percent of ABE/GED learners whoenter 9. Percent of ABE/GED completers enrolledin postsecondary education or training32%65%²¹26%47%29%80%-30%37%76%22%58%30a. Percent of adults in Arizona (or county)with some college or an associate degree34%29%²²32%37%39%34%37%33%37%36%35%40%30b. Percent of adults in Arizona (or county)with a bachelor's or higher degree27%29%²²14%18%23%31%14%30%12%14%30%24%27. Percent of occupational programcompleters either employed with a livablewage or enrolled in further educationThis indicator is in development.It will be incorporated into the Strategic Vision pending astatewide agreement for sharing wage data.¹⁹National Student Clearinghouse. (2012). Snapshot report: Transfer outcomes (four years after transfer). Herndon, VA: Author.²⁰Perkins Collaborative Resource Network. (2014). Core indicator report :1P1 technical skill attainment , 2011-12. Washington, DC: Author.²¹U.S. Department of Education, Office of Vocational and Adult Education. (2015). Core follow-up outcomes measures, 2013-2014. Washington,DC: Author.²²U.S. Bureau of the Census. (2015). Educational attainment: 2009-2013 American Community Survey 5-year estimates. Washington, DC:Author.19
sharing of best practices and successful program models across the state. However, each district . (AWC), Central Arizona College (CAC), Cochise College (CC), Coconino Community College (CCC), Eastern Arizona College (EAC), the ten colleges and two skills . fashion, fire science, nursing, solar technologies, and veterinary technologies .