Transcription
ASimple and scalable response prediction for display advertisingOLIVIER CHAPELLE, Criteo†EREN MANAVOGLU, MicrosoftROMER ROSALES, LinkedInClickthrough and conversation rates estimation are two core predictions tasks in display advertising. Wepresent in this paper a machine learning framework based on logistic regression that is specifically designedto tackle the specifics of display advertising. The resulting system has the following characteristics: it iseasy to implement and deploy; it is highly scalable (we have trained it on terabytes of data); and it providesmodels with state-of-the-art accuracy.Categories and Subject Descriptors: H.3.5 [Information Storage And Retrieval]: Online InformationServices; I.2.6 [Artificial Intelligence]: LearningGeneral Terms: Algorithms, ExperimentationsAdditional Key Words and Phrases: Display advertising, machine learning, click prediction, hashing, featureselection, distributed learningACM Reference Format:ACM Trans. Intell. Syst. Technol. V, N, Article A (January YYYY), 34 pages.DOI 10.1145/0000000.0000000 http://doi.acm.org/10.1145/0000000.00000001. INTRODUCTIONDisplay advertising is a form of online advertising where advertisers pay publishersfor placing graphical ads on their web pages. The traditional method of selling displayadvertising has been pre-negotiated long term contracts between the advertisers andthe publishers. In the last decade spot markets have emerged as a popular alternative due to the promise of increased liquidity for publishers, and increased reach withgranular audience targeting capabilities for the advertisers [Muthukrishnan 2009].Spot markets also offer the advertisers a wide range of payment options. If the goalof an advertising campaign is getting their message to the target audience (for instancein brand awareness campaigns) then paying per impression (CPM) with targeting constraints is normally the appropriate choice for the advertiser. However, many advertisers would prefer not to pay for an ad impression unless that impression leads the userto the advertiser’s website. Performance dependent payment models, such as cost-perclick (CPC) and cost-per-conversion (CPA), were introduced to address this concern.Under the cost-per-click model advertisers will only be charged if the users click ontheir ads. The cost-per-conversion option reduces the advertiser’s risk even further byallowing them to pay only if the user takes a predefined action on their website (suchas purchasing a product or subscribing to an email list). An auction that supports suchconditional payment options needs to convert advertiser bids to Expected price per im† Mostof this work has been done while the authors were at Yahoo! Labs.Permission to make digital or hard copies of part or all of this work for personal or classroom use is grantedwithout fee provided that copies are not made or distributed for profit or commercial advantage and thatcopies show this notice on the first page or initial screen of a display along with the full citation. Copyrightsfor components of this work owned by others than ACM must be honored. Abstracting with credit is permitted. To copy otherwise, to republish, to post on servers, to redistribute to lists, or to use any componentof this work in other works requires prior specific permission and/or a fee. Permissions may be requestedfrom Publications Dept., ACM, Inc., 2 Penn Plaza, Suite 701, New York, NY 10121-0701 USA, fax 1 (212)869-0481, or permissions@acm.org.c YYYY ACM 2157-6904/YYYY/01-ARTA 15.00DOI 10.1145/0000000.0000000 http://doi.acm.org/10.1145/0000000.0000000ACM Transactions on Intelligent Systems and Technology, Vol. V, No. N, Article A, Publication date: January YYYY.
A:2pression (eCPM). For CPM ads, eCPM is identical to the bid. The eCPM of a CPC orCPA ad, however, will depend on the probability that the impression will lead to aclick or a conversion event. Estimating these probabilities accurately is critical for anefficient marketplace [McAfee 2011].There has been significant work in the literature on modeling clicks in the contextof search and search advertising. Click and conversion prediction for display advertising presents a different set of challenges. In display advertising the auctioneer doesnot readily have access to the content of the ads. Ads might not even be hosted bythe auctioneers. Furthermore, the content of the ads might be generated dynamically,depending on the properties of the user. Similarly landing pages of the ads may notbe known to the auctioneer and/or they might contain dynamically generated content.While there have been some attempts to capture the content of the ad or the landing page recently [Cheng et al. 2012; Liu et al. 2012], this requires non-trivial effortand is not always possible. Content related, web graph, and anchor text informationare therefore absent in display advertising, leaving the auctioneer mostly with uniqueidentifiers for representation. Despite almost 10 billion ad impressions per day in ourdata set, hundreds of millions of unique user ids, millions of unique pages and millionsof unique ads, combined with the lack of easily generalizable features makes sparsitya significant problem.In this paper we propose a simple machine learning framework that can scale tobillions of samples and hundreds of millions of parameters, and that addresses theissues discussed above effectively with a small memory footprint. Our proposed framework uses Maximum Entropy [Nigam et al. 1999] (also known as Logistic Regression)because it is an easy to implement regression model that, as will be seen, can appropriately scale with respect to the number of features and can be parallelized efficiently.The Maximum Entropy model is advantageous also because incremental model updates are trivial and there exists an exploration strategy that can be incorporatedeasily. A two-phase feature selection algorithm is provided to increase automation andreduce the need for domain expertise: use a generalized mutual information method toselect the feature groups to be included in the model; and feature hashing to regulatethe size of the models.Large-scale experimental results on live traffic data show that our framework outperforms the state-of-the-art models used in display advertising [Agarwal et al. 2010].We believe these results and the simplicity of the proposed framework make a strongcase for its use as a baseline for response prediction in display advertising.The rest of the paper is organized as follows: In section 2 we discuss related work. Insection 3 we look at the differences between click and conversion rates with respect tofeatures and analyze the delay between clicks and conversions. Section 4 describes theMaximum Entropy model, the features and the hashing trick used in our framework.In this section we also show that smoothing and regularization are asymptoticallysimilar. We present results of the proposed modeling techniques in section 5. Section6 introduces a modified version of mutual information that is used to select featuregroups and provides experimental results. In section 7, motivated by our analysis, wepropose an algorithm for exploration. Section 8 describes an efficient map-reduce implementation for the proposed model. Finally, we summarize our results and concludein section 9.2. RELATED WORKLearning methods developed for response prediction in computational advertising often use regression or classification models in which all factors that can have an impacton user’s response are included explicitly as features or covariates.The features used in such models can be categorized as:ACM Transactions on Intelligent Systems and Technology, Vol. V, No. N, Article A, Publication date: January YYYY.
A:3context features such as the query in sponsored search or the publisher page in contentmatch;content features discussed in [Ciaramita et al. 2008; Hillard et al. 2010] for text adsand in [Cheng et al. 2012; Liu et al. 2012] for display ads;user features introduced by [Cheng and Cantú-Paz 2010];feedback features that are generated by aggregating historical data and described in[Chakrabarti et al. 2008; Hillard et al. 2010].Not all of these features are available in the context of display advertising, in whichadvertiser and publisher information is typically represented as unique identifiers. Insuch a space where each unique identifier is considered a feature, dimensionality becomes a major concern. Mutual information and similar filter methods [Guyon andElisseeff 2003] are frequently used over wrapper based methods in this domain. Arecent approach to handle dimensionality reduction is the use of feature hashing asdescribed in [Weinberger et al. 2009]. The idea behind hashing is to reduce the number of values a feature can take by projecting it to a lower dimensional space. Thisapproach has gained popularity in the context of large scale machine learning due toits simplicity and empirical efficacy.Logistic regression and decision trees are popular models used in the computationaladvertising literature. Applying decision trees to display advertising, however, has additional challenges due to having categorical features with very large cardinality andthe sparse nature of the data. Kota and Agarwal [2011] use gain ratio as the splittingcriterion with a threshold on positive responses as an additional stopping criterion toavoid having too many nodes with zero positives. Authors then perform autoregressiveGamma-Poisson smoothing, top-down, to fallback to parent nodes’ response rates. Decision trees are sometimes used in multi-layer approaches due to high computationalcost.Logistic regression is frequently preferred because it can be parallelized easily tohandle large scale problems. Agarwal et al. [2011] present a new framework to parallelize linear models which is shown to reduce training times by an order of magnitude.Graepel et al. [2010] propose the use of an online Bayesian probit regression model.This approach maintains a posterior distribution over model parameters instead ofpoint estimates. This posterior distribution is then used as the prior in the next update cycle. The authors also suggest sampling from the posterior distribution as ameans to do exploration (a method known as Thompson sampling), but do not provideany analysis or empirical results using this methodology. In our framework we employsimilar techniques within the logistic regression framework, and provide an analysisof the Thompson sampling method as well as simulation results.Predicting user response with sparse data has been the focus of several studies.However, most of this work was conducted on search advertising and therefore utilizedeither the query [Ashkan et al. 2009; Hillard et al. 2011] or the keywords advertisersbid on [Regelson and Fain 2006; Richardson et al. 2007]. More recently Agarwal et al.[2010] and Kota and Agarwal [2011] proposed using hierarchies present in the datato address this issue explicitly. This approach uses a baseline model trained on standard set of features to estimate baseline probabilities, and then learns a correctionfactor by exploiting the hierarchical nature of the publisher and advertiser relatedfeatures. The model uses the assumption that the correction factors for the full advertiser and publisher paths can be estimated employing a log-linear function of pairs ofnodes, where the pairwise state parameters are modeled as Poisson distributions. Itthen uses non-centered parametrization to take advantage of the hierarchical correlations in estimating these state parameters. This is required because many states willhave very few observations and no positive samples. The approach in [Menon et al.ACM Transactions on Intelligent Systems and Technology, Vol. V, No. N, Article A, Publication date: January YYYY.
A:42011] incorporated this hierarchical smoothing technique with matrix factorizationmethods used in collaborative filtering and reported additional gains. Our approach,instead, is to encode the relations between features, hierarchical or otherwise, directlyin the same model as additional conjunction features. In section 4.8 we show that usingTikhonov regularization with logistic regression implicitly achieves the effect of hierarchical smoothing. The framework proposed in this paper therefore uses conjunctionfeatures and regularization to exploit the relationship between features, and hashing to keep the model size tractable. We argue that our method requires less domainknowledge (for example we do not need to know the structure of ad campaigns or publisher pages to encode the relations), has better scaling properties, and is simpler toimplement.3. DATA AND FEATURESThis section provides some background information on the display advertising dataused in this paper. More details can be found in [Agarwal et al. 2010; Rosales et al.2012].3.1. Data and The Yahoo! Real Media ExchangeFor this work we collected live traffic logs from Yahoo!’s Right Media Exchange (RMX),one of the largest ad exchanges in the world, which serves around ten billion ad impressions every day. RMX follows a network-of-networks model where the connectionsbetween advertisers and publishers are facilitated by intermediaries called networks.Networks can have either only publishers or advertisers, or both. Every entity in theexchange (networks, publishers and advertisers) has a unique identifier (id).Publishers label their web-pages with site id’s. They can also tag different parts ofthe same page with a different section id. While the exchange does not enforce anyrules on the semantics of section id’s, publishers often use a different section id for different ad slots on the same page. A relationship between a network and an advertiseror a publisher is specified by a series of attributes such as pricing type, budget, andtargeting profile.3.2. Click-Through Rate and Conversion RateWe are interested in uncovering the fundamental properties of the click and post-clickconversion (PCC) events. In the context of this paper, click refers to the event thatoccurs when a user interacts with an ad by means of a mouse click (or equivalent).Post-click conversion, on the other hand, is an action that the user takes after visiting the landing page of the advertiser and is regarded as valuable by that advertiser.Typical examples of conversion actions include subscribing to an email list, making areservation or purchasing a product. The basic quantities to measure the propertiesof these two types of events are the click-through rate (CTR) and the conversion rate(CVR), respectively.3.3. Features/Covariates in Display AdvertisingIn this section we summarize the information sources utilized for modeling clickthrough and conversion rates.We consider four sets of features that are available in most online advertising systems: advertiser, publisher, user and time features. It is worth mentioning that theavailability of the user features varies by publisher. A representative list of featuresfor each group can be found in Table I. Some of the above features are continuousrather than categorical (user age for instance) and have been quantized appropriately.These features are obtained at the event level, that is every time an ad is shown ona page and every time a user clicks on an ad or converts, an event will be recorded.ACM Transactions on Intelligent Systems and Technology, Vol. V, No. N, Article A, Publication date: January YYYY.
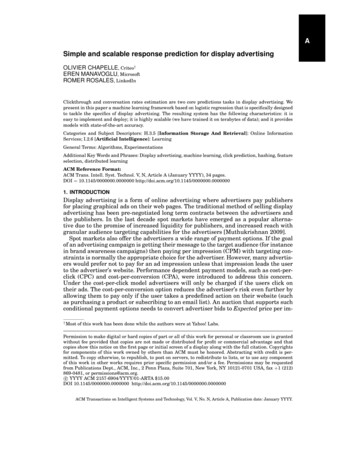
A:5Table I. Sample of features considered divided into featurefamilies.Feature familyAdvertiserPublisherUser (when avail.)TimeFeature membersadvertiser (id), advertiser network,campaign, creative, conversion id,ad group, ad size, creative type,offer type id (ad category)publisher (id), publisher network,site, section, url, page referrergender, age, region, network speed,accept cookies, geoserve time, click time3.4. Analysis of the Click Conversion DelayIn this paper, the conversion estimation task is defined as the probability that a userwill convert after they click on an ad (post-click conversion, PCC). A critical aspect inPCC modeling is identifying the click events that lead to conversion actions (such assubscribing to an email list, making a reservation or purchasing a product).In order to build a conversion model, we need to attribute the conversion event to thecorrect click event as this represents a positive PCC example (vs. a click event withoutany associated conversion event). A conversion event can happen minutes, hours oreven days after a click event. The proper attribution of the conversion event to the rightclick event, which can be done by properly matching the click and conversion eventattributes, is essential not only for PCC prediction but also for payment processing.In general several conversion events could be associated with the same click, as advertisers may show a sequence of conversion-generating pages to the user after a clickon the relevant ad. This association process faces certain practical limitations as thelonger the time elapsed between click and conversion the more logged events that needto be maintained and matched. In order to get a better picture of the click-conversionprocess and to answer the question of how much data needs to be utilized for matchingconversions with their corresponding click events, we analyzed the properties of thetime delay for conversion events.We calculated the percentage of conversion events with different attribution timeintervals as shown in Figure 1. From the graph, we can observe that a large majority (86.7%) of conversion events are triggered within 10 minutes of the click events.Approximately half of these conversion events (39.2%) occur within 1 minute of thecorresponding click event. If we look further, we observe that we can match 95.5% ofthe conversion events within one hour of the clicks. As we are interested in achievingthe largest possible recall within practical boundaries, we decided to consider variousdays of delay. Within two days of the click, 98.5% of the conversions can be recovered.These considerations are important for modeling, and in particular for buildingproper training/test sets. The use of too short a time window would generate inaccurate data sets, while the use of too large a time window is impractical due to the requirements in data storage and matching (click-conversion) could become prohibitive.Given the above experiments and data, we would be ignoring approximately 1.5% ofthe conversion events and as a consequence incorrectly labeling a click event as negative (no conversion) if the time frame set for post click conversion attribution is limitedto 2 days. This was believed to be sufficient given the practical cost of looking furtherin time; and thus, we utilize this limit throughout the paper.In contrast to conversions, a click can be relatively easily attributed to a particularad impression as there is a direct association between a click with the page where theACM Transactions on Intelligent Systems and Technology, Vol. V, No. N, Article A, Publication date: January YYYY.
A:6Distribution of Post Click Conversion Attribution Time Delay1.2Percentage of Data10.80.60.40.20 1m 10m 30m 1h 2h 12h 1d 2dallClick-Conversion Attribution Time DelayPercentageFig. 1. Distribution of click conversion attribution time delay.ad is displayed. The large majority of ad clicks (97%) occur within a minute of the adimpression.4. MODELINGThis section describes the various modeling techniques that are used to learn a response predictor from clicks or conversions logs.4.1. Logistic regressionThe model considered in this paper is Maximum Entropy [Nigam et al. 1999] (a.k.a.Logistic Regression [Menard 2001]).Given a training set (xi , yi ) with xi {0, 1}d a sparse binary feature vector in a ddimensional space, and yi { 1, 1} a binary target, the goal is to find a weight vector1w Rd . The predicted probability of an example x belonging to class 1 is:1Pr(y 1 x, w) .1 exp( w x)The logistic regression model is a linear model of the log odds ratio:logPr(y 1 x, w) w x.Pr(y 1 x, w)(1)The weight vector w is found by minimizing the negative log likelihood with an L2regularization term on the weight vector:minwnXλkwk2 log(1 exp( yi w xi )).2i 1(2)Equation (2) is a convex, unconstrained and differentiable optimization problem. Itcan be solved with any gradient based optimization technique. We use L-BFGS [Nocedal 1980], a state-of-the-art optimizer. A review of different optimization techniquesfor logistic regression can be found in [Minka 2003].4.2. Categorical variablesAll the features considered in this paper are categorical. Indeed most features areidentifiers (id of the advertiser, of the publisher, etc.). And real valued features can bemade categorical through discretization.1 Theintercept is one of the weight.ACM Transactions on Intelligent Systems and Technology, Vol. V, No. N, Article A, Publication date: January YYYY.
A:7The standard way of encoding categorical features is to use several binary features,known as the dummy coding in statistics or the 1-of-c encoding in machine learning.If the feature can take c values, c binary features are introduced, the ith one being theindicator function of the ith value. For instance, a feature taking the 2nd value out of 5possibles values is encoded as(0, 1, 0, 0, 0).If we have F features and the f -th feature can take cf values, this encoding will leadto a dimensionality ofd FXcf .f 14.3. Hashing trickThe issue with the dummy coding presented above is that the dimensionality d canget very large when there are variables of high cardinality. The hashing trick, madepopular by the Vowpal Wabbit learning software and first published in [Weinbergeret al. 2009], addresses this issue.The idea is to use a hash function to reduce the number of values a feature can take.We still make use of the dummy coding described in the previous section, but insteadof a c-dimensional code, we end up with a d-dimensional one, where d is the number ofbins used with hashing. If d c, this results in a compressed representation. In thatcase, collisions are bound to occur, but as explained later, this is not a major concern.When dealing with several features, there are two possible strategies:(1) Hash eachP feature f into a df -dimensional space and concatenate the codes, resulting indf dimensions.(2) Hash all features into the same space; a different hash function is used for eachfeature.We use the latter approach as it is easier to implement.2 A summary of the hashingtrick is given in algorithm 1. The values vf can be of any type; the hash function justacts on their internal representation. In algorithm 1, there is a hashing function hf forevery feature f . This can be implemented using a single hash function and having fas the seed or concatenating f to the value vf to be hashed.ALGORITHM 1: Hasing trickRequire: Values for the F features, v1 , . . . , vF .Require: Family of hash function hf , number of bins d.xi 0, 1 i d.for f 1 . . . F doi [hf (vf ) mod d] 1.xi xi 1end forreturn (x1 , . . . , xd ).There are some other ways of reducing the dimensionality of the model, such asdiscarding infrequent values, but they require more data processing and the use ofa dictionary. A very practical appeal of the hashing trick is its simplicity: it does notrequire any additional data processing or data storage and it is straightforward toimplement.2 Thisis also what is implemented in Vowpal Wabbit.ACM Transactions on Intelligent Systems and Technology, Vol. V, No. N, Article A, Publication date: January YYYY.
A:84.4. Collision analysisWe quantify in this section the log likelihood degradation due to two values collidinginto the same bin.Consider the scenario when the first value has been observed n1 times, all on negative examples and the second value n2 times, all on positive examples, and when thereis only one feature in the system (no fallback on other features). If there were no collision, the weight for the value would be (assuming no regularization) and the onefor the second value would be . This would lead to a log likelihood of zero on all theexamples where either value is present.When there is a collision, the negative log likelihood is:n1n2 n1 log n2 log.n1 n2n1 n2This is indeed the log likelihood achieved by the solution where all the weights are at0 except the one where there is a collision and which has a value log(n2 /n1 ).This log likelihood is large only when both n1 and n2 are large. This scenario can beconsidered a worst case one because:(1) The two values were extremely predictive; if these two values were not predictive,their collision would not harm the log likelihood (zero weight in all cases);(2) There was no redundancy in features: if the system includes redundant features, acollision on one value could be mitigated by another value.Regarding the last point, one could alleviate the collision issue by making use of multiple hash functions, in the same spirit as in the Bloom filter [Bloom 1970]. Howeverin practice this does not improve the results (see section 5.7).This section provides only a rudimentary analysis of collisions. Given the recentinterest in hashing for categorical variables, we expect and hope that a more thoroughand theoretical analysis of the effect of collisions within a learning system will bedeveloped in the years to come.4.5. ConjunctionsA linear model can only learn effects independently for each feature. For instance,imagine a model with two categorical features, advertiser and publisher. The modelwould learn that some advertisers and some publishers tend to have a higher CTRthan others, but it would not learn that the CTR of a bank of america ad is particularly high on finance.yahoo.com. For this, we need to introduce a new conjunctionfeature that is the cartesian product of advertiser and publisher.A conjunction between two categorical variables of cardinality c1 and c2 is just another categorical variable of cardinality c1 c2 . If c1 and c2 are large, the conjunctionfeature has high cardinality and the use of the hashing trick is even more crucial inthis case.Note that computing conjunctions between all features is equivalent to consideringa polynomial kernel of degree 2 [Schölkopf and Smola 2001] where the mapping iscomputed explicitly as in [Chang et al. 2010].Due to the large cardinality of the representation, there will most likely be pairs ofvariable values that are unseen in the training data. And these pairs, take (avertiser,publisher) for instance, are biased by the current serving scheme, as specific advertisers are selected for a given publisher. The hashing trick helps reduce the dimensionality of data, but might do a poor job on these unseen pairs of values due to collisions.This can be problematic, especially in an exploration setting where predictions on infrequent values are required. A possible solution is to represent the variable valuesusing a low-dimensional representation, for example through the use of matrix facACM Transactions on Intelligent Systems and Technology, Vol. V, No. N, Article A, Publication date: January YYYY.
A:9torization or a related approach [Menon et al. 2011]. This type of representation isnot studied in this paper. A promising future work direction would be to combine alow-dimensional representation with the hashing trick: the former would capture thegeneral trend in the data while the latter could be use to refine the model for thefrequent pairs observed in the training set.4.6. Multi-task learningWe show in this section how multi-task learning, as presented in [Evgeniou and Pontil2004], is equivalent to a single model with conjunctions as presented in this paper.Assume that we are given T learning tasks indexed by t {1, 2, ., T } and a trainingset (xt1 , y1t ), . . . , (xtnt , ynt t ) for each of these tasks. The tasks are supposed to be differentbut related. A task could for instance learning a prediction function in a given country.Evgeniou and Pontil [2004] adapted Support Vector Machines to multi-task learningby decomposing the weight vector for task t aswt w0 vt ,where w0 can be interpreted as a global classifier capturing what is common amongall the tasks and vt is a small vector modeling what is specific for that task.The joint optimization problem is then to minimize the following cost:ntT XXt 1 i 1TX (w0 vt ) xti λ0 kw0 k22 λ1kvt k22 ,(3)t 1where is a given loss function.Note that the relative value between λ0 and λ1 controls the strength of the connection between the tasks. In the extreme case, if λ0 , then w0 0 and all tasks aredecoupled; on the other hand, when λ1 , we obtain vt 0 and all the tasks sharethe same prediction function.Instead of building explicitly these classifiers, an equivalent way of obtaining thesame result is to optimize a single weight vector w : [w0 v1 . . . vT ] and introduceconjunction features between the task and all the other features. The following vector is thus implicitly constructed: x̃ti : [xti 0 . . . xti 0 ] . Both approaches are indeed tequivalent when λ λ0 λ1 since (w0 vt ) xi w x̃ti and λkwk22 λ0 kw0 k22 pPTλ1 t 1 kvt k22 . The case λ0 6 λ1 can be handled by putting a weight λ0 /λ1 on theconjunction features.3As already noted in [Weinberger et al. 2009], the use of conjunctions features isthus a powerful tool as it encompasses the multi-task learning framework. Its mainadvantage is that a specific multi-task solver is unnecessary: a single model is trainedwith a standard logistic regression solver.4.7. SubsamplingSince the training data is large (around 9B impressions daily), it would be computationally infeasible to consider all impressions.4 On the other hand, the training datais very imbalanced – the CTR is lower than 1%. For these reasons, we decided to subsample the negative cla
Display advertising is a form of online advertising where advertisers pay publishers for placing graphical ads on their web pages. The traditional method of selling display advertising has been pre-negotiated long term contracts between the advertisers and the publishers. In the last decade spot markets have emerged as a popular alterna-