Transcription
AHRQ Quality Indicators ToolkitINSTRUCTIONSReturn on Investment EstimationWhat is this tool? When your hospital invests in a new program, quality improvementintervention, or technology, management often wants to know what kind of financial return itwill achieve for that investment. A return on investment (ROI) analysis is a way to calculateyour net financial gains (or losses), taking into account all the resources invested and all theamounts gained through increased revenue, reduced costs, or both.This tool provides a step-by-step method for calculating the ROI for a new set of actionsimplemented to improve performance on one or more of the AHRQ Quality Indicators (QIs). Italso provides a case example of ROI calculated by a hospital for implementation ofcomputerized physician order entry (CPOE).Who are the target audiences? The key audiences are the hospital’s financial staff and qualitystaff, as well as statisticians, data analysts, and programmers, who will contribute to ROIcalculations.How can the tool help you? By using ROI, hospitals can better position themselves tomaximize the impact of their quality investments. ROI can be used as both a planning andevaluation tool.Using ROI as a planning tool. During the planning process before implementing improvementactions, projected ROI can be calculated to estimate how long it will take for an intervention tobreak even—that is, for the returns of the practice improvement to offset the upfront and ongoingimplementation costs. This analysis can be done using data from the literature.Using ROI as an evaluation tool. Actual ROI can be calculated after a practice improvement hasbeen implemented to assess its value and inform decisions on future improvement actions. Thisanalysis can be done using actual data from your hospital.How does this tool relate to others? The ROI tool is used as a planning tool to develop costand return information for use in setting priorities for improvements on the Patient SafetyIndicators (PSIs) and Inpatient Quality Indicators (IQIs), with the results of these analysesapplied in the Prioritization Matrix (Tool C.1). It also can be used as an evaluation tool alongwith the Project Evaluation and Debriefing tool (Tool D.8) to assess financial effects of theimprovements implemented.How does ROI differ from cost-effectiveness analysis (CEA)? CEA and ROI share somecommon features, but they differ in the effects that are addressed. Both ROI and CEA areexpressed as ratios, and they use the same amounts for improvement investment costs. ROIshows how much financial gain a hospital can obtain from each dollar it invests in the qualityimprovement program, while the results of a CEA indicate the costs to a hospital for each unit ofeffectiveness it achieves through quality improvement actions, such as the costs for each adverseevent avoided. These differences are reflected in the formulas used to calculate the ratios.ROI Financial gains / Improvement investment costsTool F.1
AHRQ Quality Indicators ToolkitCEA Improvement investment costs / EffectivenessRead the following for a step-by-step guide to performing ROI calculations.2Tool F.1
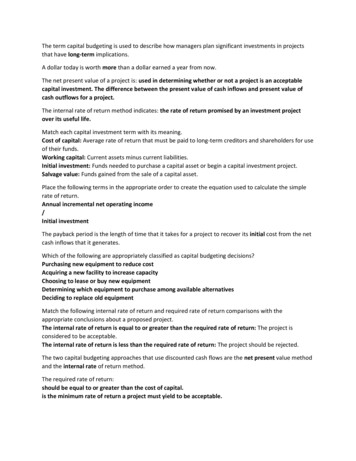
AHRQ Quality Indicators ToolkitCalculating and Interpreting Return on Investment (ROI)An ROI is calculated as the ratio of two financial estimates:ROI Net returns from improvement actions / Investment in improvement actionsWhere the numerator and denominator of this ratio are defined as follows: Net returns from improvement actions. The financial gains from the implementation ofthe improvement actions, which are generated by net changes in quality, efficiency, andutilization of services, or in payments for those services.Investment in improvement actions. The costs of developing and operating theimprovement actions.The step-by-step procedure described here can be used to perform ROI calculations to assessyour financial return on improvement actions that you either are planning or have implemented.The term “improvement actions” refers to any hospital program or initiative that aims to improvethe quality or safety of hospital inpatient care, which may include a focus on improvingperformance on the AHRQ QIs.Step 1. Determine the Basic ROI DesignBefore you start to calculate ROI for any given improvement actions, you need to make fourdesign decisions that will structure your approach to the analysis:1. Define the scope of services affected by the improvement actions. Some actions willbe limited to making improvements in one hospital unit (e.g., the emergency department),and others will have a broader scope (e.g., across all nursing units). Carefully define thescope of services to be included in the ROI calculation, and ensure that financialestimates are specifically related to that scope of services.2. Define the timeline for implementation of improvement actions. When implementingimprovement actions in your hospital, those actions will occur over a time period thatcould be as short as a few months or as long as years. The ROI analysis needs to capturewhen those actions change the hospital’s operating procedures over time, to be able toestimate both the implementation costs and the financial effects of improvement actions.If changes occur over years, you will need to adjust the estimates for inflation anddiscount future costs and revenues.3. Define the comparison group. To estimate the numerator (net return portion) for theROI ratio, you need to compare the hospital’s finances under two conditions—with theimprovement actions implemented and without them. Typically, this will be acomparison over time, with the “before” condition being the service processes beforeimprovement actions, and the “after” condition the service processes afterimplementation. Other possible comparisons are comparisons across units within thesame hospital, or across hospitals. If you use other units or hospitals as comparisons, besure to choose comparison groups that have similar characteristics to your service entityexcept that they did not implement the improvement actions.3Tool F.1
AHRQ Quality Indicators Toolkit4. Capture complete information on financial contributors. To obtain the most accurateROI estimate, you will need to identify and quantify as many of the financial contributorsas possible for both the numerator and denominator of the ROI formula. For a planningphase ROI, you will be working with your best estimates of improvement action costsand of the components of net returns. For a postimplementation ROI, you will haveactual data from your financial system on those contributors.Step 2. Calculate the Return on InvestmentTo calculate the ROI for the improvement actions, you will develop estimates for both thenumerator and denominator of the ROI ratio:Net returns from the improvement actions (the ROI ratio numerator)Investment in the improvement actions (the ROI ratio denominator)Worksheets are provided here for your use in developing these estimates. Worksheet 1 can beused to estimate the costs for your investment in the improvement actions, and Worksheet 2 canbe used to estimate the net returns from those actions.Considerations When Calculating Investment Costs. Instructions for completing Worksheet1 are provided at the top of the worksheet. You will use the same methods to prepare these coststhat you use for program budgeting or financial accounting for actual costs. The grand totalimplementation costs calculated in the worksheet is the estimate for the ROI denominator.The costs involved in implementing improvement actions may be incurred at different stages ofthe implementation process. Your hospital’s financial staff will need to track these costs at allstages of the program from its start to its end. Table 1 shows the categories of costs at eachstage of program planning, implementation, and maintenance (see descriptions of thesecomponents in Appendix I). These broad categories are meant as suggestions. Not all costsincluded will apply to all types of programs or quality improvement initiatives. In addition, youmay identify other relevant costs that should be included but are not shown here.Table 1. Categories of Costs Incurred at Different Stages of Implementing a Practice or QualityImprovement ProgramStages of the Improvement ActionsCost ionsystemsOutreach andcommunicationExternalconsultant costsPlanning andDevelopmentTrainingStartupOngoing Operation,Monitoring, ol F.1
AHRQ Quality Indicators ToolkitConsiderations for Calculating Net Return. Instructions for completing Worksheet 2 areprovided at the top of the worksheet. The grand total financial effects derived in the worksheet isthe estimate for the ROI numerator.The estimation of these financial effects is more complex—and more subtle—than estimating theimplementation costs. Implementation of improvement actions may have many positive effectson patients’ outcomes and health status. For example, improvement actions might reducehospital-associated infections, rates of pressure ulcers, or patient mortality. Although theseeffects do not have a direct monetary value, many of them may affect a hospital’s revenues andexpenses, which should be estimated in an ROI analysis. For example, reduction in adverseevents can lead to reduced length of stay, which may affect finances either positively ornegatively, depending on payment structures.You will need to capture the two types of financial effects of changes in the hospital’s revenuesand in its operating costs. For example, by reducing its infection rates, a hospital could eliminatethe costs it had been incurring to provide the extra care required to treat infections. It also couldenhance or protect its revenues, if insurers offered incentives for infection control or imposedpenalties for occurrences of infections.When calculating the hospital’s net return for the ROI, it is necessary to take into account thatthe effects on revenues and effects on costs work in opposite directions. From the hospital’sperspective, an increase in revenues is good, so a higher revenue due to improvement actionsshould be a positive number. On the other hand, a decrease in costs is good, so a lower cost dueto improvement actions is good. Therefore, when calculating net return, subtractions of theaction group and comparison group are performed in opposite directions. The instructions forthese calculations are provided on Worksheet 2.Calculating the ROI Ratio. Once you have estimated the implementation costs and the neteffects on revenues and costs, the actual calculation of the ROI ratio is easy. Simply divide theestimated total net returns by the total implementation costs:ROI Worksheet 2 Total (returns) / Worksheet 1 Total (investment)Calculating the Cost Savings. The two worksheets can also be used to calculate cost savings,another indicator of financial effects of the quality improvement program. The cost savings maybe of interest to hospital managers to answer a basic question: “How much did we save?” Thecost savings is the difference between returns and costs:Cost Savings Worksheet 2 Total (returns) Worksheet 1 Total (investment)Step 3. Interpret the ROI Ratio ObtainedThe resulting value for your ROI ratio can fall into one of three categories:1. ROI greater than 1: When an ROI is greater than 1, the returns generated byimprovement actions are greater than the costs for development and implementation. Inthis case, ROI is considered to be positive. For example, an ROI of 1.8 indicates that for5Tool F.1
AHRQ Quality Indicators Toolkitevery 1 you invested in the quality improvement program, 1.80 will be gained for thehospital.2. ROI less than 0: With an ROI of less than 0, the improvement actions yield a net lossfrom changes in quality and utilization. In this case, ROI is considered to be negative.For example, an ROI of -1.5 indicates that for every 1 invested, 1.50 will be lost by thehospital.3. ROI between 0 and 1: When ROI is between 0 and 1, the improvement actions yield apositive net return from changes in quality and utilization, but this return is too small tofully recover the action implementation cost. Therefore, an ROI in this range also isconsidered to be negative. For example, an ROI of 0.8 indicates that for every 1invested, 80 cents will be recouped by the hospital. In other words, the hospital loses 20cents for every 1 it spent on the quality program.6Tool F.1
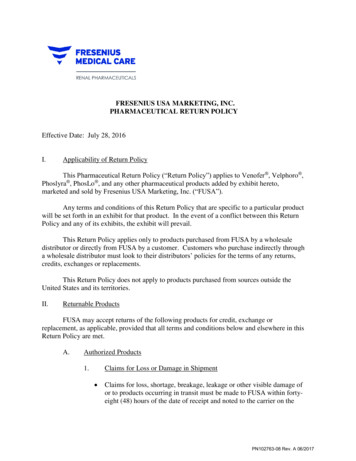
AHRQ Quality Indicators ToolkitWorksheet 1. Calculating the Costs for Implementing the Improvement Actions (ROIDenominator)Instructions for completing Worksheet 1 (Note: These are costs for implementation, NOT the subsequent changes in servicefinances.)1. Prepare these costs using the same methods used for program budgeting. When the ROI is calculated during planning for a set ofimprovement actions, it is in fact a budget for that set of actions. Use the same line items for calculating actual costs afterimplementation. Some costs might be drawn from your hospital financial statements; others you will need to calculate yourself.2. Enter the estimated costs for each line item (personnel, supplies, etc.) that is relevant to the improvement actions for eachimplementation stage (planning, training, etc.).3. Sum the costs across rows to obtain a total cost estimate for each line item.4. Sum the costs down the columns to obtain a total cost estimate for each improvement stage.5. Obtain the grand total costs by summing the line item total costs (the highlighted box). This is the denominator for the ROIcalculation.Implementation Costs by Stage of Improvement Action ImplementationCategory of ImplementationCostsPlanning andDevelopmentTrainingStartupOngoingOperation andMaintenanceShutdownTotal CostsPersonnelSuppliesEquipment and depreciationTrainingInformation systemsOutreach and communicationExternal consultant costsTotal Costs7Tool F.1
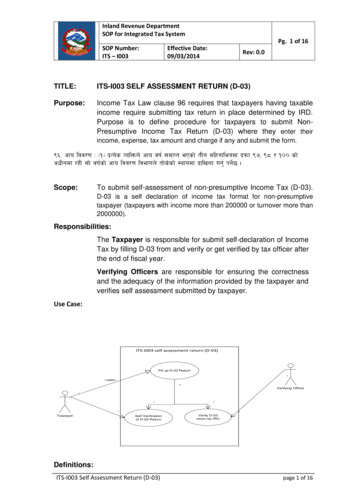
AHRQ Quality Indicators ToolkitWorksheet 2. Calculating the Net Returns for Implementing Improvement Actions (ROINumerator)Instructions for completing this worksheet: (Note: These are changes in service revenues and operating costs resulting fromimplementing the improvement actions.)1. Identify items for which the improvement actions will have financial effects and list them in first column. The top set lists effectson revenues; the bottom set lists effects on costs. The ones listed here are examples; you may use different sets of items.2. Estimate the costs for each item for the comparison group (e.g., before) and following implementation. If the comparison periodsinvolve more than one year, you may need to adjust some of the costs for inflation or discount future costs to reflect timepreference for money.3. Calculate net change in revenues B minus A (increase in revenue). Calculate net change in costs A minus B (decrease in cost).4. Sum the line item net changes to obtain the total net change (highlighted box). This is the numerator for the ROI calculation.(Real) Financial Effects of Improvement ActionsEffects t ChangeNOTES(Description of Effects Involved inRevenue or Cost Changes)(B minus A)Changes in Revenues:Admissions, readmissions, length of stayPayments from insurersNew services provided0Avoidance of penalties from insurers for“never events”Other effects on revenuesChanges in costs:Service operating costs: staffing, supplies,equipment, other due toAdmissions, readmissions, length of stayIntensity of careProductivity/efficiency changesAvoidance of liability litigationOther effects on costsTotal Costs(A minus B)8Tool F.1
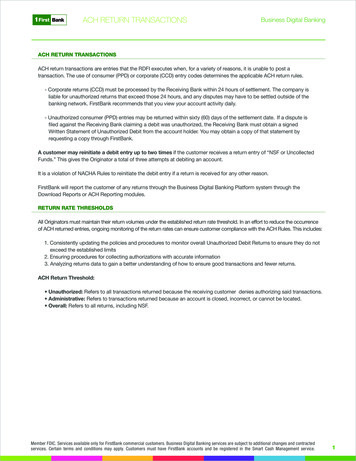
AHRQ Quality Indicators ToolkitCase Study for ROI CalculationAlthough they are not ROI studies, many studies have reported on costs or hospital chargesrelated to patient safety events (for example, Zhan and Miller using Healthcare Cost andUtilization Project data; Rivard, et al., using Veterans Affairs data; and Foster using MedPARdata). See details about these papers in the section “Other Information Sources To Assist WithCalculating ROI.”) Their results might be useful for ROI calculation. Few ROI analyses havebeen published in the health-services literature because they are not typically performed asresearch studies.One example was published, however, which is summarized here. Researchers at Brigham andWomen’s Hospital (BWH) conducted an ROI analysis to determine the financial impact ofimplementing a computerized physician order entry (CPOE) system that was developed withinthe hospital to improve patient safety.i See the table below for a summary of the informationthey used.Calculating investment in the program (denominator). Costs were determined for each stageof practice implementation from 1992 to 2002. First, the capital costs of developing andimplementing the CPOE system were estimated to be 3.7 million, based on internal documentsand interviews with the developers. Sixty percent of this cost was attributed to the first year ofthe study period (development costs) and 20 percent was attributed to each of the next 2 years(startup).Next, operational costs starting in year 2 of the study period were calculated. These costsincluded hardware (workstations and printers), software, network, leadership, and training. Theydid not include costs for the pharmacy system, medication administration system, or clinical datarepository. Operational costs ranged from 600,000 to 1.1 million per year. Development,implementation, and operation of the CPOE system cost 11.8 million over 11 years.Calculating returns from the program (numerator). To estimate the savings generated fromthe CPOE system, the research team retrospectively identified each way the practice savedmoney (for a detailed description of each element of the program and its method of cost savings,see Table 1 in Kaushal, et al., 2006). The benefits were determined using published literature,key informant interviews, and internal documents. For many components of the CPOE, thenumber of estimated adverse drug events (ADE) averted was multiplied by an average cost perADE.Other types of cost savings identified included decreased drug costs (decreased use and shiftfrom use of intravenous to oral medications, decreased laboratory tests, reduction in use ofinappropriate radiology tests, savings in nursing and physician time by improved workflow).Drugs and tests are valued using charge amounts and applying a 0.2 cost-to-charge ratio).Because different elements of the CPOE system were introduced at different times during thestudy, benefits were only calculated for those elements starting on the first day of the month afteriKaushal R, Jha AK, Franz C, et al. Return on investment for a computerized physician order entry system. J AmMed Inform Assoc 2006;13(3):261-6.9Tool F.1
AHRQ Quality Indicators Toolkitthe element was implemented. This process was repeated for every intervention and area of costsavings; they found that the system saved the hospital 28.5 million over the 11 years.Selecting the time horizon. The staff assessed the ROI of the CPOE system over a period of 10years to allow enough time to see a return. Because the time horizon was longer than 2 years,they needed to make adjustments for the following issues: Inflation: Dollar values for costs and benefits were converted to a constant dollar basis toadjust for inflation. They used the Bureau of Labor Statistics’ Producer Price Index timeseries for General Medical and Surgical Hospitals to standardize values to 2002 currency.Discounting: All costs and benefits were discounted at a 7 percent annual percentage rateas recommended by the U.S. Office of Management and Budget for economic analysesperformed for the Federal Government, representing a societal discount rate as opposedto a hospital-specific rate. Costs were discounted using a “beginning-of-period”convention and benefits were discounted using an “end-of-period” convention.Annualization: Annualized values were calculated by converting all the discounted costsand benefits into a series of equal annual payments.Interpreting the results. The analysis yielded a positive return on investment—the CPOEsystem saved the hospital about 2.2 million annually over the 11-year period. It took more than5 years for the system to have a net benefit.Information BWH Used To Conduct an ROI Analysis for CPOE ImplementationElement of AnalysisCosts (denominator)Returns (numerator)Discount rateConsumer Price IndexProspective ReimbursementRate (cost-to-charge ratio)Live date (returns)Measure(s) or Values 11.8 million total: 3.7 million in capital costs; 600,000 to 1.1 million peryear in operational costs 28.5 millionDescription or InclusionsWorkstations and printers, software,network, leadership, and trainingAverted adverse drug events; medicationcost savings; decreased laboratory testusage for redundant or unnecessary tests;improved workflow (staff and resourcesavings); decreased length of stay;streamlined workflow; improvedinformation access for patients at time ofdischarge; decreased radiologicalutilization7% annualized rateBureau of Labor Statistics’Producer Price Index timeseries for General Medicaland Surgical Hospitals tostandardize values to a 2002base year80%First day of the monthfollowing activation of theintervention or midpoint of10This is the date when they startedcounting the number of cost-saving eventsand calculating the associated costTool F.1
AHRQ Quality Indicators Toolkitthe year (July 1) when onlyannual data were availableLive date (start of calculating January 1, 1993operational costs)End dateDecember 31, 200211savings.This is the date when the practice beganto accrue operational costs.This date signifies the end of the studyperiod.Tool F.1
AHRQ Quality Indicators ToolkitAdditional Guidance for Effective ROI CalculationIn this section, several items offer additional suggestions for how to prepare for your ROIcalculation and how to work with some key measurement issues. See Appendix II forinformation about existing ROI calculators.Understanding the Point of View for ROI CalculationsWhen performing the ROI calculations described here, you will develop estimates that representthe perspective of the hospital—both the investments and net returns are those of the hospitalitself, as is the resulting ROI ratio. It is important to note that the implementation ofimprovement actions is likely to also have effects on other stakeholders with different points ofview. For example, reducing infections will affect costs to insurers from changes in paymentsmade to the hospital, which will depend on the nature of each insurer’s payment policy. At thestart of each ROI analysis, it will be useful to consider what the effects may be for otherstakeholders and to take possible responses on their part into account when designing theimprovement actions.Knowing Who Should Be Involved in Performing the ROIFour groups of hospital staff should be involved in estimating the ROI. At the beginning, ahospital’s quality improvement program needs to engage the hospital’s financial officers, whocan help track the investment/cost of the program. Second, clinical and other staff (e.g., qualityand patient safety staff at the hospital) running the quality improvement program should identifyquality indicators that will be affected by the program.Third, statisticians, data analysts, and programmers can help the clinical staff estimate changes inthe identified indicators using data available from the hospital and relevant information fromother sources (see details below). Fourth, some hospitals may need to hire consultants fortraining and statistical analysis related to quality improvement.Getting Ready To Conduct an ROI CalculationTo use this tool for calculating the ROI of an intervention, the hospital staff needs to know: Elements of the program (including practices, technology, process or product);Resources needed to implement the intervention;Target population;Measures of health care quality likely to be affected by the intervention; andMeasures of health care utilization likely to be affected by the intervention.Selecting the Time Horizon for ROI CalculationBecause a quality improvement program may continue for a number of years, ROI can becalculated for part of the program period (e.g., the first year of a 5-year program) or for the entireprogram (e.g., the entire 5 years of a 5-year program). The choice of the time horizon for theROI calculation will affect results of the calculation in two ways.First, the costs of a quality improvement program usually are incurred at the beginning of theprogram while the hospital has to wait for some time to see the return. So, if the ROI is12Tool F.1
AHRQ Quality Indicators Toolkitcalculated at the initial stage of the program, the results is likely to be negative. In comparison,if the ROI is calculated in the long run, the chance of having positive results will increase.Second, if the time horizon is only one year, the cost calculation may not need to consider theissues of inflation, discounting, and depreciation. In comparison, if the time horizon for an ROIanalysis is 2 years or longer, the analysis has to adjust for these issues, as described in the nextsection.Adjustments That Should Be Made for Future Costs and Savings Inflation refers to rises in the prices of goods and services over a period of time. The ROIcalculation can adjust for inflation by using constant dollars to measure the costs of aprogram over time.Discounting is simply the difference between the original amount in the present and thesame amount in the future. In other words, 100 next year is worth less than 100 thisyear. Thus, future money has to be discounted to be comparable to current money.Depreciation of equipment is the reduction in the value of an asset due to usage, passageof time, wear and tear, technological outdating or obsolescence, depletion, inadequacy, orother factors. Among the several methods for calculating depreciation, straight-linedepreciation is the simplest and most often used technique, which can be expressed asAnnual depreciation (Original cost minus salvage value) / Years of lifeWhere the salvage value is an estimate of the value of the asset at the time it will be soldor disposed of; it may be zero or even negative.Difference Between Costs and ChargesCosts represent the amount of resources the hospital needs to use to provide inpatient careservices while charges are the amount of money the hospital reports on the bill and expects thepatient and the insurer to pay. It is increasingly rare for the insurer to pay the full charges sinceMedicare, Medicaid, and many private insurers can obtain discounts of 50% or more.While charges appear on hospital discharge data, costs should be calculated for the ROI analysis.The charges can be translated into costs using the hospital’s cost-to-charge ratio, which is usuallyavailable at the hospital financial department. Because hospitals need to know their own costs toassess the performance of departments and the merits of specific programs, they typically reporta cost-to-charge ratio for the hospital as a whole and cost-to-charge ratios for individualdepartments. These ratios can be used to calculate the costs of the quality improvement program.Micro Costing Versus Gross CostingMicro and gross costing are the two commonly used methods for estimation of health care costs.In micro costing, a cost is derived for each element of an intervention: staff time, supplies andmedications, and so on. In comparison, gross costing uses mathematical models to determine themean cost of a day of inpatient care or an outpatient visit. With gross costing, there is no detailavailable on the cost of any component of the hospital stay or visit.13Tool F.1
AHRQ Quality Indicators ToolkitSome experts recommend that when detailed data are available, micro costing be used as themethod of choice. Other experts suggest that the choice between micro and gross costing becarefully considered and driven by the needs of the analysis and the precision of the estimates.Other Information Sources To Assist with Calculating ROIBooksDrummond M, O’Brien B, Stoddart G, et al. Methods for the economic evaluation of health careprogrammes. 2nd ed. New York, NY: Oxford University Press; 1997.Wage RatesThe U.S. Bureau of Labor Statistics provides information about wage rates of more than 800occupations in 50 States and the District of tm). The information is useful for calculatingpersonnel costs, such as doctors and nurses, which is part of the ROI analysis.Inflation RatesThe U.S. Bureau of Labor Statistics also provides information about inflation rates across theNation and over time (http://www.bls.gov/CPI/), including price index of medical utical PricesThe Red Book by Thomson Reuters provides comprehensive drug product and pricing tabase/).Literature Estimating Costs of Medical Errors and Adverse EventsBates DW, Spell N, Cullen DJ, et al. The cost of adverse drug events in hospitalized patients.JAMA 1997;277:307-11.Bishop CE, Gilden D, Blom J, et al. Medicare spending for injured elders: are there opportunitiesfor savings? Health Aff (Millwood). 2002 Nov-Dec;21(6):215-23.Chen LM, Rein MS, Bates DW. Costs of quality improvement: a survey of four acute carehospitals. Jt Comm J Qual Patient Saf 2009 Nov;35(11):544-50.Classen DC, Pestotnik SL, Evans RS, et al. Adverse drug events in hospitalized patients: excesslength of stay, extra costs and attributable mortality. JAMA 1997;277:301-6.A business case for patient safety. Managing the Margin 2006 Dec. Westchester, IL: HealthcareFinancial Management Association. Available at:http://www.solucient.com/articles/12 06 MTM.pdf.Kaushal R, Bates DW, Franz C, et al. Costs of ad
Define the scope of services affected by the improvement actions. Some actions will be limited to making improvements in one hospital unit (e.g., the emergency department), and others will have a broader scope (e.g., across all nursing units). Carefully define the scope of services to be included in the ROI calculation, and ensure that financial