Transcription
COUNTY ADULT PROBATION AND PAROLEANNUAL STATISTICAL REPORT2018
COMMONWEALTH OF PENNSYLVANIABOARD OF PROBATION AND PAROLECOUNTY ADULT PROBATION AND PAROLEANNUAL STATISTICAL REPORT2018Theodore W. JohnsonChairmanMaureen Barden, Esq.Board MemberLeo L. Dunn, Esq.Board MemberMark D. KochBoard MemberAnthony MoscatoBoard MemberLinda P. RosenbergBoard MemberKelly Evans, Deputy Secretary for ReentryThomas J. Dougherty, Parole ManagerDivision of Grants, Standards, and Court ServicesD. Lorraine Russell, Program AnalystBureau of Planning, Research, and Statistics1101 South Front Street, Suite 5900, Harrisburg, PA 17104-2545Telephone (717) 787-7461www.pbpp.pa.gov
MISSION STATEMENTThe Pennsylvania Board of Probation and Parole is committed to promoting publicsafety, utilizing sound decision making practices that include evidence-basedapproaches, employing effective methods to aid offenders in reentering societyand to reduce recidivism, addressing the needs of crime victims, and improvingcounty adult probation and parole services.INTRODUCTIONThe Pennsylvania Board of Probation and Parole is an independent State agency under the jurisdiction ofthe Governor of Pennsylvania. The Board’s authority is found in Title 61 P.C.S. §§6102 et seq. A 1965amendment (Act 501) significantly broadened the Board’s powers and duties to include the administrationof a Grant-In-Aid Program for the improvement of county adult probation and parole services, theestablishment of statewide probation and parole personnel and program standards, the provision of trainingfor county adult probation and parole personnel, and the collection, compilation, and publication of countyprobation and parole statistical information. Act 501 of 1965 also provides for an Advisory Committee onProbation to assist the Board in formulating and reviewing standards for probation personnel and programservices for the counties.The following County Adult Probation and Parole Statistical Report provides detailed information aboutcounty adult probation and parole offenders, personnel, and program services, which will serve as aresource for future program planning. All counts and rates are supplied by the counties and figures areshown as reported by the counties. For those responses that were found to be inconsistent, we updatedthe responses to “DK” for don’t know.Additionally, Venango and Potter Counties did not report values for the 2018 report and their figures shownare from 2014. Cumberland County did not report this year. Bedford County did not report and its figuresare from 2013.
TABLE OF CONTENTSPage2018 HIGHLIGHTS . 1-4OFFENDERTABLE 1CHART 1TABLE 2MAP2TABLE 3MAP3TABLE 4TABLE 5CHART 5TABLE 6CHART 6TABLE 7TABLE 7ACHART 7CHART 7ATABLE 8TABLE 9CHART 9TABLE 10TABLE 11TABLE 12TABLE 13MAP13TABLE 14TABLE 15MAP15TABLE 16CHART 16TABLE 17CHART 17CASELOAD INFORMATION . 5CASELOAD INFORMATION . 6CASELOAD SUPERVISION . 7AVERAGE ACTIVE CASELOAD . 8ABSCONDERS . 9ABSCONDERS – PERCENT OF TOTAL OFFENDERS . 10MILITARY VETERANS . 11OFFENSE GRADE . 12OFFENSE GRADE . 13GENDER OF OFFENDERS. 14GENDER OF OFFENDERS. 15RACE/ORIGIN OF OFFENDERS . 16ETHNICITY OF OFFENDERS . 17RACE/ORIGIN OF OFFENDERS . 18ETHNICITY OF OFFENDERS . 18CONTROLLING OFFENSE OF OFFENDERS . 19INVESTIGATIONS AND REPORTS . 20INVESTIGATIONS AND REPORTS . 21COMMUNITY–BASED OFFENDER SUPERVISION . 22OFFENDER RISK/NEEDS . 23EMPLOYMENT . 24SEXUAL OFFENDERS . 25INTENSIVE SUPERVISED SEXUAL OFFENDERS . 26ELECTRONIC/GLOBAL POSITIONING SYSTEM MONITORING . 27OFFENDER ADDITIONS/DISCHARGES . 28SUCCCESSFUL COMPLETIONS AS A PERCENT OF ALL DISCHARGES . 29TYPE OF DISCHARGE . 30TYPE OF DISCHARGE . 31REVOCATIONS . 32REVOCATIONS . 33
TABLETABLECHARTMAPTABLE1819191920REVOCATIONS WITH A DISPOSITION OF INCARCERATION . 34OFFENDER SUPERVISION COUNTS AND RATES . 35OFFENDER SUPERVISION COUNTS . 36COUNTY OFFENDERS PER 10,000 RESIDENTS . 37OFFENDER POPULATIONS ONE-YEAR COMPARISON . 38AGENCYTABLE 21TABLE 22TABLE 23TABLE 24PROFESSIONAL STAFF. 39POSITION CLASSIFICATION (AVERAGE SALARY AND GENDER) . 40SPECIALTY COURTS . 41PROGRAMS AND SERVICES . 42FY 2017-18 GRANT-IN-AID AND SUPERVISION 0AGRANT-IN-AID PROGRAM . 43GRANT-IN-AID & SUPERVISION FEE REIMBURSEMENT . 44GRANT-IN-AID & SUPERVISION FEE REIMBURSEMENT FOR ALL ELIGIBLE POSITIONS . 45SUPERVISION FEES . 46COUNTY CLASSIFICATION COMPARISONS . 47COUNTY CLASSIFICATION COMPARISONS (PBPP SERVICES TO COUNTIES) . 48SUPERVISION REFERRALS TO PBPP . 49TEN-YEAR DATA SUMMARY (2009 THROUGH 31B31C31D31E31F31GTEN-YEAR DATA SUMMARY . 50COUNTY ADULT PROBATION AND PAROLE STAFF . 51IN-COUNTY CASELOAD HISTORY . 52INVESTIGATIVE REPORTS . 53PBPP SERVICES TO COUNTIES . 54GRANT-IN-AID AND SUPERVISION FEES. 55GRANT-IN-AID SALARIES . 56GRANT-IN-AID POSITIONS . 57
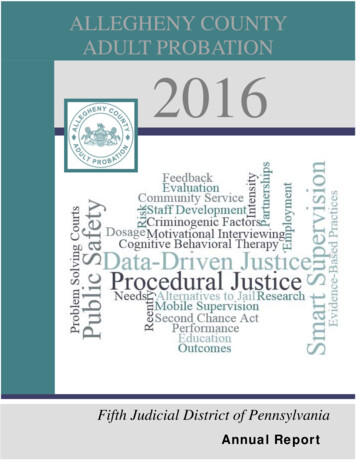
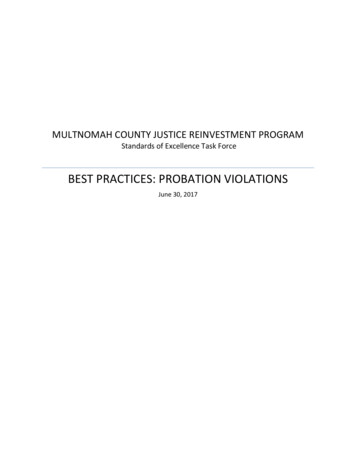
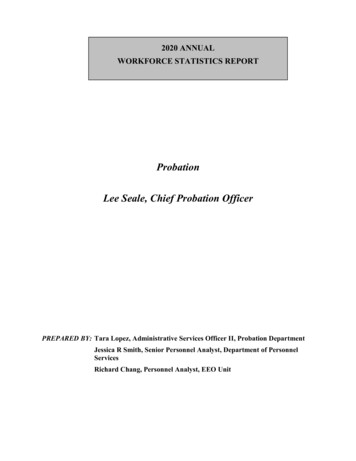
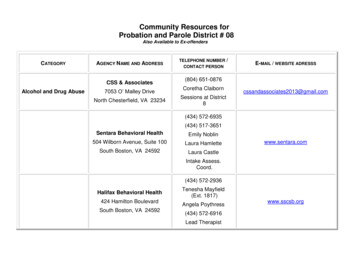
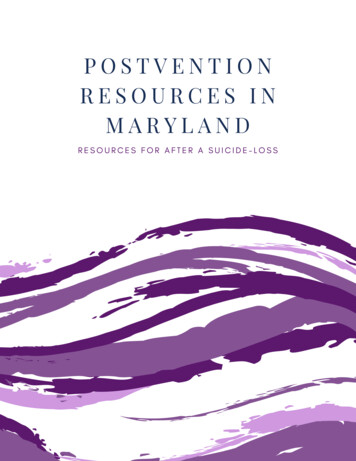
2018 HIGHLIGHTS – OFFENDERAs of December 31, 2018 (Unless otherwise stated, all comparisons are with December 31, 2017):(Note: Some figures may not add to 100% due to rounding.) The number of county adult offenders supervised in-county, 246,995, decreased by 1.3 percent, a decrease of3,141 offenders, while offenders supervised by the Pennsylvania Board of Probation and Parole (PBPP), 41,305,decreased by 1.8 percent, or 764 offenders. Offenders supervised by county adult probation and parole departments represented 86.3 percent of the totalnumber of adult offenders under supervision, while offenders supervised by PBPP, represented the remaining13.7 percent. The intermediate punishment offender population, 15,446, decreased by 5.8 percent, a decrease of 959offenders. The number of adult probation officers supervising a caseload, 1,730, decreased by 3.8 percent, a decrease of68 adult probation officers. The average total in-county caseload was 143 offenders per adult probation officer. The average active caseloadwas 105 offenders per adult probation officer. The average total caseload in any one county ranged from a lowof 23 offenders per probation officer (Sullivan County) to a high of 299 offenders per probation officer(Delaware County). Of the counties reporting data, 11.1 percent, or 27,361, of the county adult offenders were absconders, anincrease of 793 offenders from the previous year. Of the counties reporting data, 7,032 county adult offenders were military veterans. The county adult offenders had an offense grading for the most serious offense as follows: felony – 32.5percent; misdemeanor – 52.9 percent; other – 5.7 percent. Data was not available for the remainingoffenders. Of the 2018 county adult offenders under supervision, 65.6 percent were male, 23.2 percent were female and11.2 were not identified in the survey.Page 1
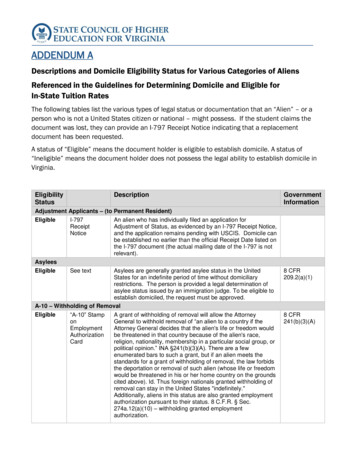
Of the county adult offenders under supervision, 59.2 percent were White and 27.6 percent were Black orAfrican American, 9.1 percent were not identified in the survey, while the remaining 4.1 percent fell into othercategories. 8.6 percent of the county adult offenders were of known Hispanic ethnicity. 2.0 percent of the county adult offenders were under supervision for sexual offenses, 11.4 percent for otherviolent offenses, 18.7 percent for property offenses, 18.5 percent for drug law violations, 18.6 percent forDriving Under the Influence (D.U.I.), 13.7 percent for other offenses, and 17.2 percent were not known. (Mostserious offense, regardless of conviction status) During 2018, a total of 138,938 investigations and reports were reported. This was a decrease of 5.8 percent,or 8,088 investigations and reports. Pre-parole investigations decreased by 5.3 percent, or 1,017, while presentence reports decreased by 5.0 percent, or 1,165. An actuarial instrument was used by 94.9 percent of the reporting adult probation departments to assess adultoffender risk/needs. 100.0 percent of those adult probation departments use the instruments to assigncaseloads and 94.6 percent conduct reassessments on a regular basis. Of the county adult probation and parole departments reporting data for offenders able to work, 63.9 percentwere employed. 2.3 percent of county adult offenders supervised were sexual offenders. Megan’s Law registration was requiredfor 67.4 percent of the sexual offender population. All 60 reporting counties, or 100 percent, use electronic monitoring (EM) and/or Global Positioning System(GPS). 12 counties use EM only, 12 counties use GPS only, and 36 counties use both. Of the offenders discharged in 2018, 74.8 percent, or 78,947 offenders, were successfully discharged and ofthose, 4,381 offenders had their supervision terminated early. Total revocations were 10.9 percent of total caseload; 3.9 percent for convicted violators and 6.3 percent fortechnical violators.Page 2
2018 HIGHLIGHTS – AGENCIES The total county adult probation and parole staff (professional and clerical/support) decreased by 2.1 percent, adecrease of 55 positions. The professional staff decreased by 43 positions and the clerical/support staffdecreased by 12 positions. For position classifications of PO 3 or higher (355 positions), males held 58.6 percent or 208 of these positions,with the remaining 41.4 percent or 147 positions held by females. Specialty Courts: Domestic Violence - 2; Driving Under the Influence - 20; Drug - 40; Mental Health - 20; ReEntry - 2; Veterans – 21; Job and Other – 14.FY 2017-18 HIGHLIGHTS – GRANT-IN-AID AND SUPERVISION FEES The FY 2017-18 Commonwealth Budget provided a Grant-In-Aid appropriation of 16,222,000 for theImprovement of Adult Probation Services.The appropriation provided 16,150,000 to partially fund thesalaries of 1,014 adult probation staff and 72,000 for the training of county adult probation and parolepersonnel. 1,014 incumbent continuing program county adult probation and parole professional staff, with 57,217,179 ineligible salaries, were funded at 32.1 percent of eligibility. An additional 1,153 county adult probation and parole professional staff, with 52,067,992 in eligible salaries,were not funded due to the unavailability of new program funds in FY 2017-18. 151 county adult probation and parole professional staff were ineligible for funding, as these positions representbase year positions (positions that were established prior to the inception of the Grant-In-Aid Program inJanuary 1966). Offender supervision fee revenue returned to the counties by the Board during FY 2017-18 totaled 18,567,254, an increase of 485,793 or 2.7 percent.Page 3
If the offender supervision fees returned to the counties each year by the Board and the Grant-In-Aid fundswere commingled and applied to the salaries of the 1,014 incumbent continuing program positions and all of the2,167 eligible positions, these positions would be funded 61.4 percent and 32.1 percent respectively. Total offender supervision fees collected by the counties in 2018 was 33,338,509. Of counties reporting inboth 2017 and 2018 this was an increase of 2,332,166 or 7.4 percent. During 2018, the monthly offender supervision fee assessment increased in eight counties and decreased inthree counties. The average monthly offender supervision fee assessed was 43 per month. Offender supervision fee assessments ranged from 25 per month to 75 per month. The five counties collecting the most in offender supervision fee revenue in 2018 included: Allegheny County at 3,505,941; Delaware County at 1,744,358,353; Montgomery County at 1,652,864; Lehigh County at 1,611,770; and Berks County at 1,538,784.Page 4
TABLE 1 - CASELOAD INFORMATION 2018COUNTYClasses 1 & 2PhiladelphiaAlleghenyClass 2ABucksDelawareMontgomeryClass terLehighLuzerneNorthamptonWestmorelandYorkClass uylkillWashingtonClass 45Page 5
TABLE 1 - CASELOAD INFORMATION 2018COUNTYClass gaWarrenWayneClass 7JuniataSnyderUnionWyomingClass TOTAL52,618PERCENTAGE21.3%DK - Data Not Available or 415,44626,8061,10731.5%6.3%10.9%0.4%ARD - Accelerated Rehabilitative 30,36427,361246,99512.3%11.1%PWV - Probation Without VerdictPage 5
5
CHART 1 - CASELOAD INFORMATION ,1070ParoleProbationIntermediate PunishmentARDPWVBailInactiveAbscondersPage 6
TABLE 2 - CASELOAD SUPERVISION 2018COUNTYClasses 1 & 2PhiladelphiaAlleghenyClass 2ABucksDelawareMontgomeryClass terLehighLuzerneNorthamptonWestmorelandYorkClass uylkillWashingtonClass 363188416406234Range of CaseloadsLowHighPage 7
TABLE 2 - CASELOAD SUPERVISION 2018COUNTYClass gaWarrenWayneClass 7JuniataSnyderUnionWyomingClass 61927399012012027331-21,730Range of CaseloadsLowHighPage 7
5
MAP 2 - AVERAGE ACTIVE PHIADELAWARE 150100-15075 100DK50 75 50Page 8
TABLE 3 - ABSCONDERS 2018COUNTYClasses 1 & 2PhiladelphiaAlleghenyClass 2ABucksDelawareMontgomeryClass terLehighLuzerneNorthamptonWestmorelandYorkClass uylkillWashingtonClass AbscondersTotalOffenders% of 2.8%11.7%Page 9
TABLE 3 - ABSCONDERS 2018COUNTYClass gaWarrenWayneClass 7JuniataSnyderUnionWyomingClass ENTAGE of ABSCONDERSDK - Data Not Available or UnknownTotalAbscondersTotalOffenders% of 53.3%ARD - Accelerated Rehabilitative DispositionPWV - Probation Without VerdictPage 9
5
MAP 3 - ABSCONDERS AS % OF TOTAL STERPHILADELPHIADELAWARE0% 0% - 4%4% - 7%7% - 10%DK10% to 22.9%Page 10
5
TABLE 4 - MILITARY VETERANS 32DK - Data Not Available or UnknownPage 11
TABLE 5 - OFFENSE GRADE 2018COUNTYClasses 1 & 2PhiladelphiaAlleghenyClass 2ABucksDelawareMontgomeryClass terLehighLuzerneNorthamptonWestmorelandYorkClass uylkillWashingtonClass lony%Misdemeanor%Other%Data .2%18.1%2,699-1,9522,6991,3371,9332,0851,545Page 12
TABLE 5 - OFFENSE GRADE 2018COUNTYFelony%Class 9%Tioga13125.2%Warren15830.5%Wayne10123.3%Class 9321.2%Class 29.6%PotterDKDKSullivan24.3%TOTAL and %80,24532.5%DK - Data Not Available or UnknownMisdemeanor%Other%Data 26246246,995Page 12
5
CHART 5 - OFFENSE GRADE 2018Misdemeanor,52.9%Felony, 32.5%Other, 5.7%Page 13
TABLE 6 - GENDER OF OFFENDERS 2018COUNTYClasses 1 & 2PhiladelphiaAlleghenyClass 2ABucksDelawareMontgomeryClass terLehighLuzerneNorthamptonWestmorelandYorkClass uylkillWashingtonClass le%Female%Data 30.9%27.8%2,699-1,9522,6991,3371,9332,0851,545Page 14
TABLE 6 - GENDER OF OFFENDERS 2018COUNTYMale%Class 75.4%Tioga37371.9%Warren36871.0%Wayne31673.0%Class 32874.9%Class K - Data Not Available or UnknownFemale%Data 0132519626246246,995Page 14
5
CHART 6 - GENDER OF OFFENDERS 2018Not Identified, 11.2%Female, 23.2%Male, 65.6%Page 15
TABLE 7 - RACE/ORIGIN OF OFFENDERS 2018COUNTYClasses 1 & 2PhiladelphiaAlleghenyClass 2ABucksDelawareMontgomeryClass terLehighLuzerneNorthamptonWestmorelandYorkClass uylkillWashingtonClass iteBlack orAfrican Amer.Amer.IndianAlaskaNativeAsian orPacificIslanderTwo orMoreRacesOtherNo
The FY 2017-18 Commonwealth Budget provided a GrantIn-Aid appropriation of 16,222,000 for the - Improvement of Adult Probation Services. The appropriation provided 16,150,000 to partially fund the salaries of 1,014 adult probation staff and 72,000 for the training of county adult probation and parole personnel.