Transcription
San Francisco CCA Implementation PlanThis Implementation Plan now provides that among suppliers, a bidding requirement shall beadded that the 360 rollout must be online according to a competitively bid rollout schedule that issufficiently rapid to pay back H Bonds within the term of the supply contract while also enablingthe supplier to operate profitably. As the aggregate electric demand of San Francisco residents,businesses and government varies between 650 MW and 900 MW at any time (and anticipatedCCA loads range from 290 MW to 800 MW), the 360 MW resource development grid upgradethat the City and County builds will deliver significant environmental and public health benefits,unprecedented since perhaps the construction of the City’s water and sewer system a centuryago, as well as benefits to regional PG&E grid reliability.In particular, as the principal cause of the state’s Energy Crisis was over-dependence on naturalgas combustion for electricity generation, the City and County’s 51% RPS and 360 MWportfolio rollout requirement will reduce dependence on this volatile, increasingly expensivecommodity.CCSF will also have to meet the CPUC’s Resource Adequacy Requirements (RAR)associated with serving its customers. These rules apply to all electricity suppliers (large utilities,Electricity Service Providers, and CCAs also referred to collectively as Load Serving Entities orLSEs) and require operating and planning reserves of 15-17% in excess of load. In addition,Load Serving Entities are required to demonstrate compliance for the year-ahead’s summer peakdemand. Also under consideration are additional resource adequacy rules for LSEs servingspecific resource constrained areas. San Francisco is currently considered a resource-constrainedarea by the California Independent System Operator, therefore any CCSF CCA might have todemonstrate specific in-city or at least Greater Bay Area electric resources to serve CCAcustomers. As San Francisco’s CCA program focuses resources on local renewable resources,these rules should have a positive impact on San Francisco’s CCA resource planning - andultimately also favorable, and greener, generation rates for CCA customers. The City’s chosensupplier will be required to provide for the CCA’s resource adequacy requirements as requiredby the CPUC Decision D.05-10-042.2.7.1Consequences for PG&E Energy Efficiency Partnership and OtherPrograms Under CPUCSan Francisco declares its intent to apply to become an administrator of all electric energyefficiency funds collected from CCA customers pursuant to PUC 381.1 (a), or otherwise requeststhat the Commission now adopt a Decision allowing CCAs to collect their own PGC funds at thesame minimum levels required of the utility (e.g. PG&E), exempting the participating CCAcustomers from paying into the PG&E PGC Fund, The San Francisco Department or theEnvironment has historically partnered with PG&E in implementing energy efficiency programsin the City and is currently in negotiations to continue this partnership through 2009. However,in D.05-01-055, the CPUC stated its intention to examine the question of the CCA role inSection 381 fund disbursement.April 17, 2007-38-
San Francisco CCA Implementation Plan“At the same time we recognize that ultimately CCAs are appropriately independentagencies that should have considerable deference to use Section 381 Funds” (D.03-07034), and have reserved broader issues about CCAs role and discretion for laterdetermination.”The CPUC indicated that it would consider redirecting CCA customer funds from PG&E PGCfund to the CCA if it wishes to administer them directly:“Stated another way, we may revisit the question of whether CCA customers should berelieved of their responsibility for energy efficiency PGC and procurement surcharges ifthe CCA elects to take over these functions. Nothing in this decision prevents us frommodifying the process for allocating PGC funds to CCAs in the future”To ensure the maximum amount of resources are committed to local energy efficiency programscombined with CCA portfolio integration capabilities regarding energy efficiency investmentsand local control of ratepayer funds, the PD, SFPUC and City Attorney shall engage the CPUCto reopen this issue. Upon a resolution of the Board of Supervisors, all PG&E Partnershipcontracts shall be terminated immediately2.7.2Major Consequences for PG&E 2007 - Procurement Contracts &Distribution Generation Interconnection and Distribution System UpgradesThe major consequences for PG&E resulting from this plan are that San Francisco is preparing to(1) make a binding commitment to provide commodity service to San Francisco procurementcustomers within the next year, (2) to request data and interconnection for hundreds of majorsolar photovoltaic and other renewable distributed generation north of the Jefferson MartinSubstation over the next three to five years, (3) install 107 Megawatts of energy efficiency andconservation measures within the City, and (4) install a 150 MW wind farm, potentially usingsome PG&E transmission capacity. The 360 MW renewable rollout will mean approximately211 MW of peak load removed from this location within five years, minus growth.First, PG&E will no longer have to plan for or procure for loads associated with participatingCCA customers in San Francisco. At CCSF’s request PG&E provided the departments with 12month energy consumption data and number of customers by rate class for the year 2003. CCSFestimates the following specific consequences for procurement based entirely on the dataprovided by PG&E.CCSF anticipates that PG&E will have to prepare to transfer customers to the San FranciscoCCA during 2007. As the CPUC’s proceeding to set PG&E’s CRS for 2007 is now ongoing, thePD and City Attorney shall begin negotiation relative to making a Binding Commitment toreceive customers from PG&E as early as March, 2007.April 17, 2007-39-
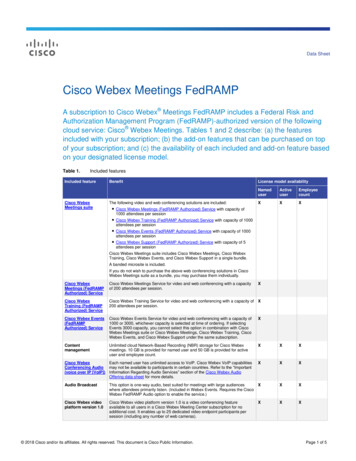
San Francisco CCA Implementation PlanThe potential amount of load and number of customer accounts that could be served by the CCAare shown below.20 Charts 1 and 2 below show the 2003 energy consumption and customeraccounts by customer class data. Although the Residential Class alone comprises nearly 91% ofall the potential CCA accounts in the City, it represents only 35% of total electricity sales. Bycontrast, Medium Commercial, Large Commercial and Large Commercial/Industrial accountscombined represent about 1.0% of the potential CCA’s accounts, versus 52% of electricity sales.Chart 1: 2003 Numbers of Accounts by Customer ClassResidentialSmall CommercialMedium CommercialResidential90.9%Large C/ISmallCommercial7.9%Large C/I0.2%MediumCommercial1.0%Chart 2: 2003 Energy Consumption by Customer ClassResidentialSmallCommercial12.7%Small CommercialMedium CommercialLarge C/IMediumCommercial17.7%Residential35.4%Large C/I34.2%20To develop a load forecast for the CCA’s potential customer base in 2006, CCSF utilizedPG&E’s system average growth rate of 1.65% as reported in its Long Term Procurement filing(R. 04-03-004) before the CPUC. Assuming that the number of customers will not varysignificantly for CCSF a 0.5% growth rate was applied to the account numbers for all customerclasses except Street Lighting and Traffic Controls, which may or may not be included in the CCA load.April 17, 2007-40-
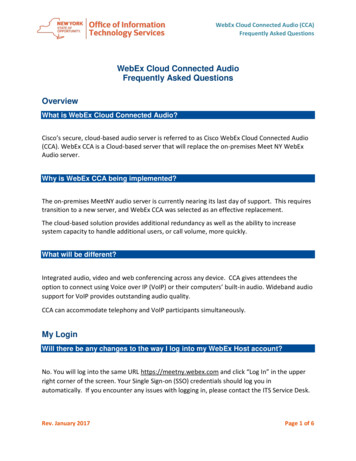
San Francisco CCA Implementation PlanChart 3 shows CCSF’s maximum, minimum, and average hourly energy usage for 2003. CCSFused PG&E’s system average load profiles also known as dynamic and static load profiles asposted on their website to shape monthly energy usage data provided by rate schedule. TheCCA’s demand peaked at 808 MW in hour 17 (5 PM) and reaches its lowest point in hour 5 (5AM). However, on average CCA’s peak load was between 500-600 MW at 12 through 6 PMand its minimum load was just over 300 MW at 4 and 5 AM.Chart 3: CCSF Daily Max, Min, and Avg. Energy Profile 2003M ax Daily LoadCCSF Daily Max, Min, & Avg Energy ProfileAvg Daily LoadM in Daily Load900Peak Hour: 808 MW800700Megawatts600500400300200Min Hour: 255 pril 17, 2007-41-
San Francisco CCA Implementation PlanPG&E should prepare, at CCSF’s cost, a special “CCA Interconnect” transaction to coordinateand schedule the CCA Supplier’s installation and interconnect of the 360 MW rollout of the 211MW peak shaving equipment under the SGIP and Million Solar Rooftops program. This programshould interconnect one to three hundred large photovoltaic installations for on--site use, overthe-fence transactions, and islanding of a single building or groups of buildings where customersare prepared to pay the premiums required for islanding – or where public benefits such asEmergency Medical Response justify H Bond investment, in which case CCA customers as awhole may pay for and receive islanding services where feasible.More detail on the timing and potential location CCSF’s anticipated 360 MW rollout will bedeveloped for the Program Basis Report, RFP, and finally within a successful contract with abidder, in particular the potential development sites, including a 150MW wind farm which mayor may not connect to PG&E transmission linesThe precise 360 rollout schedule will be established by the RFP and negotiation process, andfinalized with the award of contract to a CCA supplier by ordinance, pursuant to AB117 . Thesemay or may not be specified in CCSF’s Binding Commitment to the CPUC to take customers,and as part of its demonstration of Resource Adequacy, as appropriate. Determinations on thenumber of facilities and criteria for site selection and approval will be made in the Program BasisReport completed by the PD, which is defined in the BOC Staffing and Budget (Appendix B).Finally, PG&E should prepare a program of net metering for a limited number of sites, such assmaller sites on residential rooftops. As stated elsewhere, hosting solar photovoltaic facilitieswill involve a contractual agreement for lease, sale or services, including related energyefficiency services.In particular an early assessment of potential sites for the five to fifteen other DistributedGeneration facilities will be required in a blanket rollout permitting, site acquisition, andinterconnect schedule so as determine and potentially minimize the interconnection costs of suchsites starting in 2007 with physical interconnects needed for dozens of facilities physicallyconnected to the PG&E grid, or another grid, per year - starting in 2008. The rate of rollout hasnot yet been determined but is expected to require three to five year’s duration starting Fall 2007.CCSF will also remove 107 MW of load north of the Jefferson Martin substation, starting in2007 and concluding on the same 3-5 year approximate schedule, with the relative emphasis oneither energy efficiency or conservation projects, depending in part on CCSF’s ability toadminister or directly collect its own energy efficiency Public Goods Surcharge funds, as well asthe timing of the availability of those funds.Specifically, at least 211 MW of renewable energy, conservation measures and load reductionswill occur incrementally starting in Fall 2007 with SF CCA and SFCCA customer facilitiesrequiring physical interconnects on a weekly basis. San Francisco will pay for the incrementalcost of the preparation in order to install the 360 MW facility on a timely basis. As the CPUChas defined CCAs as captive utility customers for distribution services, the City needs PG&E’sfull cooperation in the coordination and planning of the CCA RPS portfolio compliance rolloutin order to comply with California’s RPS law and related CPUC RPS regulation. - PG&E canwork with CCSF early to facilitate and work with the City on – namely interconnection of a largeApril 17, 2007-42-
San Francisco CCA Implementation Plannumber –hundreds of solar installations as well as the interconnection of the 5-15 generators, incity, whose size could vary between 5MW and 10MW and whose fuel source is assumed to berenewable.2.7.3Customer Reliability Increase Potential Through Solar InstallationsSan Francisco’s 360 Megawatt rollout could offer blackout protection to CCA customers whoneed it for critical equipment, such as refrigeration systems at grocery stores – or HVAC andlighting in high rises.The reliability of electric service to customers can be buttressed with a variety of approachesfalling into two general categories: redundant sources and redundant paths to those sources.The interstate transmission system has embraced both of these approaches for many years,interconnecting adjacent distributions systems to share generating sources in times of systemstress with multiple interconnections. These multiple connections to multiple sources create the“network” we often refer to as the “grid.” Usually, this is a distinct architecture from the localdistributions system, which is most often organized as a hierarchy of single-path, or “radial,”lines to end-users.Electric power systems, both transmission and distribution, exist at multiple voltages, but intransmission systems almost all lines are interconnected and operated as a more-or-less integralwhole. Some areas are, of course, integrated with greater capacity and complexity than others.The more densely integrated portions are identified and operated as a single jurisdiction, or“control area,” with the boundaries of control areas and interfaces between them defined alongareas of weaker or more sparse interconnection.Most of the reliability problems in an electric power system, and almost all of the power qualityissues, arise from problems on the distribution system. The operation of circuit breakers, fuses,reclosers, and capacitor banks, the failure of lines, transformers, or insulators, or the improperoperation of customer premises can all introduce serious power reliability and power qualityissues that propagate throughout the distribution system.A way to increase power reliability is though the use of multiple power sources, so that theaverage distance between sources and loads is decreased, with fewer opportunities for faults that,in the aggregate, can be expected to occur with some predictable frequency per mile of line.With multiple power sources, the average number of faults on the electric system does notdecrease, but the average number of customers affected by each such fault will tend to decrease.This is the fundamental case of “utility” distributed generation.The extreme case of multiple power sources is to increase the number of power sources until ittends to approximate the number of loads—or, at least, the critical loads—and at the same timelocate those power sources optimally so that the average distance between power sources andApril 17, 2007-43-
San Francisco CCA Implementation Planloads (again, critical loads) tends to go to zero. This is the fundamental case of “on-site”distributed generation.This on-site power can be designed in a number of configurations: stand-alone off-line power,utility-interconnected with on-site back-up, on-site power with utility back-up, utility power andon-site power operated in parallel, and load-partitioning distribution centers (similar to circuitbreaker panels) in combination with any of the foregoing.Power reliability can also be increased by installing multiple paths between power stations,whether generating plants or substations, and loads. This allows power to continue to flow fromappropriate sources to critical loads even when one of those paths has been interrupted.Utilities often establish multiple distribution lines (often called “spot” networks), sometimesfrom different substations, to major downtown business facilities, public safety facilities likehospitals, and government (especially military) facilities. Central business districts also oftenhave networked distribution (often called “area networks”) with multiple primary distributionlines from multiple substations feeding multiple distribution transformers that feed multiplesecondary distribution lines. In this way, there can be two or more interconnections betweenevery combination of primary line in and secondary line out. Because of the reliability desiredand the potential cost of controlling such a complex array of equipment, area networks areusually electrically protected with special, highly optimized, circuit breaker-like devices, called“network protectors,” that only allow power to flow from the primary line, through thetransformers, to the secondary line, and never in the reverse direction. While this was anefficient way to protect such area networks in a period when no on-site power generation wasever encountered, these devices create very difficult environments for present-day placement ofon-site power.“Islanding,” or the separation of a portion of a utility company distribution line with two ormore customer premises from the remainder of the utility electric system, where the separatedline remains energized because at least one customer has active generation, has always been asource of concern among utility operators. As a “public” service, utility companies have someliability for the quality of the electric power delivered to customers’ premises. When adistribution line segment separates, but does not de-energize because one of the customers onthat line segment has active generation, the utility no longer has any control over the quality ofthe power delivered to other customers on that separated segment. Utility linemen sent to repairsuch separated lines, customers inspecting their services, or members of the general public maybe injured if they come in to contact with lines that they believe to be de-energized—but are not.Similarly, equipment may be damaged if served with voltages too low or too high from privategenerating equipment not monitored or controlled with the same precision as utility generation.Utility personnel almost universally react to the subject of “islanding” as a problem to bemitigated.The fundamental distinction—from an engineering viewpoint—between utility systemintentional islanding and simple premises on-line/off-line interconnection control, is thecomplexity of that automated decision-making, which is rooted in the number ofinterconnections to be managed simultaneously. Customer premises almost always have but aApril 17, 2007-44-
San Francisco CCA Implementation Plansingle connection to the utility grid, so the problem is relatively trivial. Utility line segments thatmight be subject to islanding almost always have at least two customer premises, twointerconnections to the remainder of the grid—and sometimes many more—and at least onegenerator, if not more. This problem tends to expand exponentially with the number ofconnections to manage, the number of separate loads to monitor for quality, and the number ofgenerators to control.Standards and equipment for "intentional islanding" are barely emerging, although they shouldbe available in 3-5 years – well within the long-term planning framework of San Francisco’sCCA program. As an "island" is, by definition, a piece of the utility distribution line (the "areaelectric power system", a public resource) that is separated from the rest of the utility grid, butenergized by the DG, the utility usually takes the lead in prohibiting such use of their facilities ina manner that they do not control.Portions of downtown San Francisco that have “secondary” distribution networks: a net ofconductors so power flows any way it needs to on the net. There are in the downtown area two ofthese networks running parallel; buildings in these areas are connected to one network, and thehigh voltage transmission line coming up from the south into the city are connected to the othernetwork. Multiple connections between these two grids help insure that no single failure createsa blackout in the downtown area.Everywhere else in San Francisco, islanding of individual premises may be feasible where thereis only one connection between premises and the distribution system. Therefore it may provebeneficial to the CCA in conjunction with its supplier to offer to assist CCA customers, as apremium service, the islanding opportunities.April 17, 2007-45-
San Francisco CCA Implementation Plan2.7.4Consequences for Physical In-City Load Reliability Impacts of SanFrancisco’s Community Choice Aggregation Implementation PlanSan Francisco’s need for capacity and power across the grid will be dramatically impacted by the360 MW rollout San Francisco expects to not only exceed the RPS law, but will provide newgreen Megawatts and Negawatts to remove a significant portion of the community’s aggregatedistribution, substation and transmission load.San Francisco will use revenue bonds and available CPUC and California Energy Commission(CEC) subsidies to finance the following required components of any qualifying supplier’s CCAPortfolio.2.7.4.1 107 MW Efficiency and Conservation Megawatt – 3 Year BuildSchedule ExpectedSan Francisco expects the following load reductions to be achieved within San Francisco’sjurisdictional boundaries by its chosen supplier:2008 29 MW2009 34 MW2010 44 MW2010 TOTAL: 107 MW Load Removed, Option for MoreThis three-year schedule is an estimate. The actual roll-out schedule will appear in the City’sResource Adequacy Demonstration as a Load Serving Entity.2.7.4.2 31 MW Solar Photovoltaic and Distributed Generation - 3 YearBuild Schedule ExpectedSan Francisco expects the following afternoon peak solar photovoltaic to be installed within itsjurisdictional boundaries over the period:2008 0 MW2009 10 MW Online2010 21 MW Online2010 TOTAL: 31 MW Online, Option of MoreThis three year schedule is an estimate. The actual roll-out schedule will appear in the City’sResource Adequacy Demonstration as a Load Serving Entity.April 17, 2007-46-
San Francisco CCA Implementation Plan2.7.4.3 72 Megawatts of Distributed Generation Such as Fuel Cells Expected3 year Build ScheduleDepending on the availability of CEC and CPUC subsidies, San Francisco expects to issuerevenue bonds to build five or fewer 15 MW or more renewable or hydrogen or hybrid powereddistributed generation facilities (Assuming 20% Admin).2008 15 MW2009 40 MW2010 17 MW2010 Total: 72 MW Online with option for moreThis three-year schedule is an estimate. The actual roll-out schedule will appear in the City’sResource Adequacy Demonstration as a Load Serving Entity.2.7.5Consequences for In-City or Out-of-City Physical Load Reliability Impacts: 150 MW Wind FarmCCSF expects the following capacity to be installed on Hetch Hetchy property or otherproperties in conjunction with the City’s Chosen supplier or another entity, as determined by theoutcome of its Request for Proposals to suppliers.:2008 0 MW2009 150 MW2010 TOTAL: 150 MW Online, Option of MoreThis three-year schedule is an estimate. The actual roll-out schedule will appear in the City’sResource Adequacy Demonstration as a Load Serving Entity.2.7.6Consequences for Ratepayer Risk2.7.6.1 Natural Gas RiskPerhaps the largest economic risk for electricity prices is the price of natural gas. The degree ofthis risk has been recently highlighted by dramatic increases in prices that were largelyunanticipated. On top of the price increases, natural gas prices have become increasingly volatile.This volatility has a direct impact on the cost of natural gas for electric generators. In order tohedge against future price increases, gas generators purchase natural gas commodity futures. Theprice of these futures contracts are based upon the anticipated future cost of natural gas, plus apremium for risk. Because volatility increases perceived risk, it also directly increases the cost ofnatural gas futures contracts. This, in turn, raises the cost of electricity. PG&E is particularlyvulnerable to this price risk, as 42 percent of its electricity supply comes from generators that usenatural gas as fuel.April 17, 2007-47-
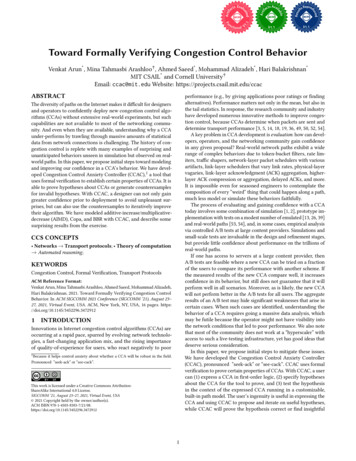
San Francisco CCA Implementation PlanA major goal of San Francisco's CCA will be to reduce long-term exposure to fossil fuel supplyand prices. This will be accomplished with several different tools. Building up City-ownedrenewable generation facilities will lock in the cost of a block of electricity that is largelyindependent of fuel costs. Long-term contract purchases of renewable electricity will supplementthe City-owned power supply. Long-term contracts can also lock in prices that are likely to besimilar to, or lower than, projected future cost of electricity generated using natural gas. A thirdtool will be energy efficiency and conservation, since cutting electricity consumption eliminatesrisk, while more efficient gas-fired generation will reduce the amount of natural gas fuel thatmust be purchased. This also cuts the generation cost of electricity. A further analysis of howrenewable resources such as wind power are a cost effective hedge on increasingly high andvolatile natural gas prices is discussed in Appendix K.2.7.6.2 Building Renewables: Scenarios for Achieving 51% RPS by 2017Whereas PG&E is subject to a 20% by 2017 RPS requirement under state law, CCSF adopts a51% RPS by 2017. San Francisco’s CCA plans on reducing its own, and thus California’s,reliance on fossil fuels by building new renewable generation and energy efficiencyinfrastructure. By building up 20 percent renewables by 2010, and 51 percent renewables by2017, the reliance on fossil fuel will fall far below the rest of the state. The following chartsillustrate an example of this shift might occur, depending on the supplier’s proposal. Under onescenario, the dirtiest power source, coal, could be eliminated, while natural gas and nuclearpower are cut back.[Exhibit II-10: Scenario Visual: CCA Compared (Source: Local Power) to PG&E 2012(Source PG&E)]By 2017, the CCA plans to shift to at least 51 percent renewables including solar photovoltaicsand energy efficiency. The following chart shows how the new portfolio might look, dependingon what sort of strategy a competitive supplier proposes to have dramatically transformed energyuse in San Francisco after 2017:April 17, 2007-48-
San Francisco CCA Implementation PlanCCA portfolio 2020, Source: Local Power, 2006Under this scenario, natural gas dependency has fallen in significance from PG&E’s 42 percentto 18 percent, a normal role for this fuel in the US. Unlike the US, San Francisco CCA does notrely upon any coal to supply its power. The CCA has also cut back on nuclear energy to a verysmall share that is mostly what has been mixed into the electric grid, and is obtained incidentallythrough market purchases.An assortment of renewables replaces the older, polluting fuels. Large hydroelectricity has beenscaled back since 2012 to lower exposure to large variation in output. Affordable wind power ismeeting 20 percent of the City’s needs, a level most experts consider maximum for a stableelectric grid. Geothermal, an abundant resource in California, is being tapped from the Countiesnorth of the Bay Area or from the high Sierras. These base-load geothermal plants provide thehighest reliability of any energy source, and use environmentally friendly closed-loop binarytechnology that eliminates toxic mineral emissions and helps preserve the resource.Solar energy is growing larger as nuclear power shrinks, up to two percent is photovoltaics andthe remainder solar thermal cogeneration. The biomass plants convert the large organic wasteresource in the Central Valley into energy, while reducing air pollution from agricultural burningand methane emissions from dairy and other animal farms. This creates significant mitigation forthe City’s greenhouse gas emissions. Some of the bio-fuel is converted into hydrogen or ethanolfor use as clean burning fuel in the City. Hydrogen is also being produced from renewable solarenergy systems, and micro-organic processing plants, as an energy storage system to improvereliability of the local electrical system and complement the intermittent energy production fromsome renewable sources.Critical to making the intermittent renewables work is immediately dispatchable hydroelectricpower. As the winds rise and fall, and the sun passes behind a hill or a cloud, signals areimmediately sent in real time to the large hydroelectric facilities to compensate for the variationin output from the renewable resources. While the hydroelectric plants stabilize the renewables,the renewables allow the precious water resources to be conserved when the wind and solarApril 17, 2007-49-
San Francisco CCA Implementation Planenergy systems are producing. The integration of the different pieces of the electrical systemhave been transformed to support a renewable energy system that is in many ways morecomplex, dynamic and interactive than the big base load war-horse generators that formerlyturned day and night without pause or variation to provide most of the power supply.The renewables provide the City with stable energy prices and a supply of clean energy. Thisbenefits not only the CCA ratepayers, but also those who remained with PG&E. CCA renewablecapacity frees up other renewable assets by reducing the strain on the grid and by handing backto PG&E the part of the renewable portfolio that the utility had procured or contracted for. Butother, more concrete, benefits are given both to the CCA and to all ratepayers in the region.2.7.6.3 System and Market Risk BenefitsA major part of the CCA’s clean energy infrastructure will be built in the City. Much of thiscapacity will be coordinated to remove the City’s peak load, but a significant fraction will alsoaddress the peak needs of Northern California. In particular, the photovoltaic component willproduce maximally during the summer peaks when the City is not at its primary peak.While much of California is consuming electricity for air conditioning the City is enjoyingrelatively mild summer temperatures. In this way
CCSF anticipates that PG&E will have to prepare to transfer customers to the San Francisco CCA during 2007. As the CPUC's proceeding to set PG&E's CRS for 2007 is now ongoing, the . classes except Street Lighting and Traffic Controls, which may or may not be included in the CCA load. San Francisco CCA Implementation Plan April 17, 2007 -41-