Transcription
CANCER INIOWA2021
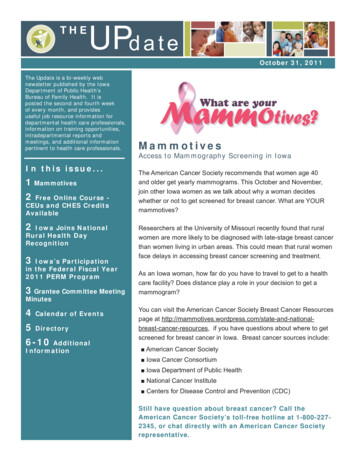
State Health Reg i str y o f I owa /I owa C a n c er R egis tr yTwo in five Iowans will be diagnosed with cancer in their lifetimes. Cancer is a major burden in Iowa and throughoutthe US. Reducing the nation’s cancer burden requires the cooperation of many people, including providers, patients,researchers, public health professionals, policy makers and advocates, among others. In efforts to reduce the burden ofcancer, it is imperative to have access to high quality data. Because of the critical need for data, cancer is a reportabledisease in all 50 states. In Iowa, cancer data are collected by the State Health Registry of Iowa, also known as the IowaCancer Registry (ICR).Since 1973, the ICR has been funded by the Surveillance, Epidemiology, and End Results (SEER) Program of theNational Cancer Institute (NCI), and is currently one of 21 US registries providing data. Iowa represents rural andMidwestern populations, and the ICR provides data representative of this population that is included in many NCIpublications, national estimates, and projections of cancer burden throughout the US.Maintaining the confidentiality of patient, provider, and hospital data located in the ICR is of paramount importance.It is the responsibility of the ICR to maintain a balance between the need to protect the collected data, while providingresearchers and others with access to the information necessary to conduct studies to help reduce the burden of cancer.To meet this responsibility, the ICR has policies and procedures related to research uses, reporting, and release of Iowacancer data to ensure its proper use and safeguard the confidentiality of patients, providers, and hospitals.The existence of the ICR allows for the study of the cancer experience of Iowans and focuses national attention andresearch dollars on this issue. The ICR is primarily funded through a contract with the NCI, with additional fundsprovided through the University of Iowa and the State of Iowa. The ICR and its high-quality database have attractedresearch projects and funds to Iowa from other federal agencies and foundations.With Cancer in Iowa 2021, the IowaCancer Registry makes a generalreport to the public on the statusof cancer. This report focuses on: New cases and cancer deathsby county and top 10 cancertypes by sex Estimates of the number ofcancer survivors A special section on cancerhealth disparities Uses of Iowa cancer data2Cancer in Iowa 2021
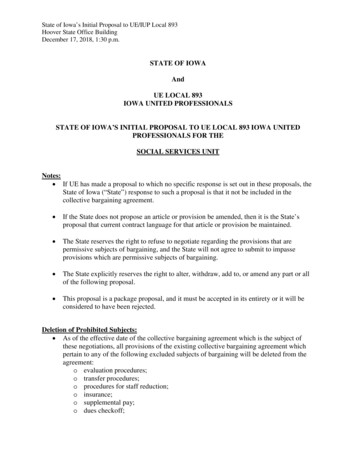
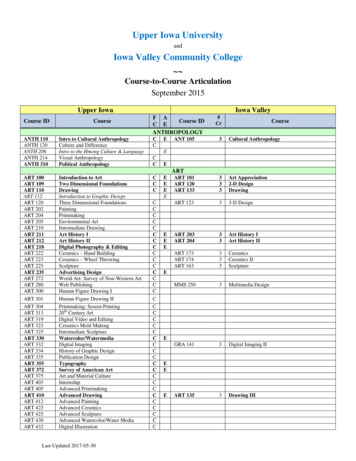
Es timates fo r New Can c er s fo r 2 02 1In 2021, an estimated 18,900 new, invasive cancers (and in situ bladder cancers) will be diagnosed among Iowa residents.Estimates of new cancers are given by county of residence with shading to indicate urban/rural status, and the top 10cancer types are listed by sex. Based on the 2013 Rural-Urban Continuum Codes, Iowa counties were classified as smallrural, large rural, and urban as shown in the figure YMOUTHBUENA 580JACKSONJONES175 1,330 140120260395DELAWARE13076580135STORYDALLASAUDUBON GUTHRIE85100BOONEGRUNDYHARDIN125BUCHANANBLACK 365WRIGHTHOWARD70CERRO H65115PALO LINTON315CEDARPOLKJASPER380 A210LUCAS60WAYNE40130MONROE60APPANOOSE240DAVIS105# W CANCERS IN FEMALESTYPEKEOKUK65HENRYLOUISA105 120 DES MOINES290VAN BUREN4550LEE265SMALL RURALLARGE RURALURBANNEW CANCERS IN MALES% OFTOTALTYPE# OFCANCERS% .6Lung1,30013.4Colon and rectum8008.7Colon and rectum8008.3Uterus6306.9Bladder6606.8Skin melanoma5005.4Skin melanoma5705.9Thyroid3503.8Kidney and renal pelvis4804.9Non-Hodgkin lymphoma3303.6Non-Hodgkin lymphoma4304.4Kidney and renal pelvis2702.9Leukemia4004.1Pancreas2702.9Oral cavity and pharynx3703.8Leukemia2602.8Pancreas3003.1All others1,93021.0All others1,94020.0TOTAL9,200TOTAL9,700Iowa Cancer Registry3
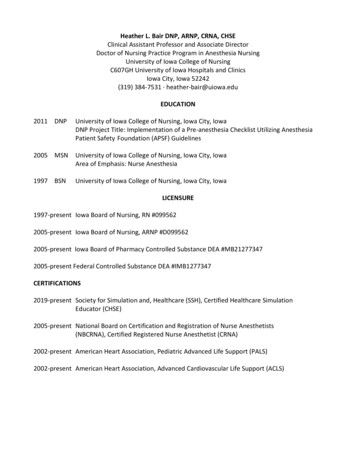
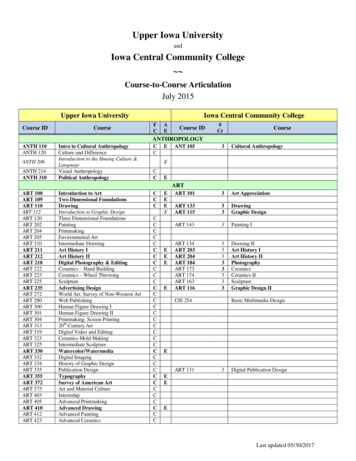
L iving wi th Ca nce rFollow-up activities track the vital status of more than 99 percent of cancer survivors diagnosed since 1973. Accordingto Iowa Cancer Registry incidence and survival data for 1973-2016, there are an estimated 154,410 cancer survivors(defined as people who are currently living with or previously having cancer), of whom 83,305 are females and 71,105 aremales. Survivorship by county of residence and urban/rural status and the top 10 cancer types by sex are shown O UENA VISTAPOCAHONTASWINNEBAGOWORTHHANCOCKCERRO GORDO570985590740 1,0001,405KOSSUTHHUMBOLDT725 5645FLOYD990730IDA4,810640 2,000455 NANDELAWAREDUBUQUEGRUNDYHARDIN6,510 1,050 9801,065 805875BOONE8151,165 1,030890 1,345BLACK 5,240JONESJACKSONMARSHALL1,105 1,2001,130 570 1,355 3,550 2,110 1,025 1,370 HIEKIOWAHARRISONAUDUBON GUTHRIEJOHNSON1,105 SCOTT795755 395 640 2,550 18,625 1,900 930 960 ATTAMIECASSADAIRMADISONWASHINGTON2,140780 410 765 2,280 1,640 1,030 615 OUISALEE400FEMALE SURVIVORS405 1,950SMALL RURALLARGE RURALURBANMALE SURVIVORS# OFSURVIVORS% OFTOTALTYPE# OFSURVIVORS% 8010.2Colon and rectum7,92011.2Colon and rectum7,9509.5Bladder5,8558.2Thyroid6,0507.3Skin melanoma5,6558.0Skin melanoma5,7456.9Non-Hodgkin lymphoma3,9355.5Non-Hodgkin lymphoma3,5354.2Kidney and renal pelvis3,6105.1Lung and bronchus3,2153.9Oral cavity and y and renal pelvis2,4052.9Lung and bronchus2,7953.9Ovary2,2052.6Testis2,6503.7All others7,1358.6All others4,4856.3TYPETOTAL4JEFFERSON390 1,865 815 1,030 DES MOINES2,300APPANOOSEDAVISVAN BUREN83,305Cancer in Iowa 2021TOTAL71,105
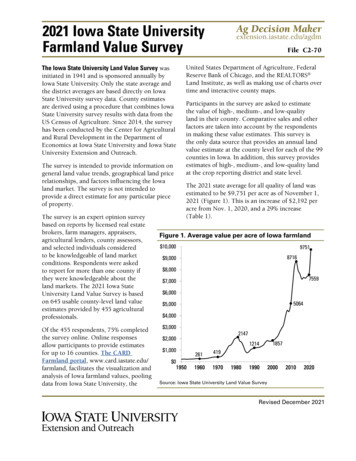
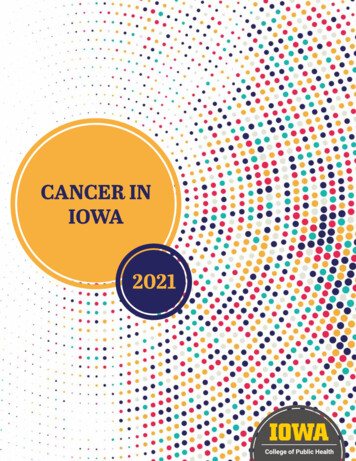
Es timates fo r Ca nce r Death s fo r 2 02 1Heart disease and cancer are the leading causes of death in Iowa and the US. In 2021, an estimated 6,400 Iowans willdie from cancer. These projections are based upon mortality data provided by the Iowa Department of Public Health.Estimates of cancer deaths are presented by county of residence with urban/rural status and the top 10 cancer types bysex are shown below.LYON30OSCEOLADICKINSONEMMETO’BRIENCLAYPALO KCERRO RROLL80GREENE50SHELBY35HAMILTON3030HARRISONBLACK N OLDTPOCAHONTASWINNEBAGO253530BUENA TUR20MAHASKA80LUCAS20WAYNE2055MONROEAPPANOOSE# OFDEATHS90DAVIS401550JEFFERSON35VAN BUREN3034085WASHINGTON25WAPELLO20CANCER DEATHS IN FEMALESTYPEKEOKUK25HENRYLOUISADES MOINES45 100SMALL RURALLARGE RURALLEE85URBANCANCER DEATHS IN MALES% OFTOTALTYPE# OFDEATHS% 37010.9Colon and rectum2809.3Colon and 1003.3Non-Hodgkin lymphoma1404.1Non-Hodgkin ltiple myeloma602.0Kidney and renal pelvis1203.577025.7All others85025.0All othersTOTAL3,000TOTAL3,400Iowa Cancer Registry5
Why It Is I m p o r tant to C o n s id er C a n c e r Di f ferenc e sby Race/Ethnici tyRace/ethnicity is a social construct, which means that it is something that exists because our society created theconstruct as a tool to group people. Race/ethnicity is not biological, meaning there is no gene or cluster of genescommon to only Black people or White people or Hispanic people. Race/ethnicity is therefore not in and of itself a riskfactor for cancer, though it is often listed as one. However, inequalities in socioeconomic status, including factorssuch as income, education level, occupation, and access to healthcare are important social factors that may differ byrace/ethnicity and therefore contribute to cancer health disparities. The socioeconomic status of individuals andneighborhoods can affect environmental (e.g., housing, exposure to hepatitis viruses), psychological (e.g., stress), andbehavioral (e.g., tobacco and alcohol use) factors that influence health. One recent study estimated that eliminatingsocioeconomic disparities could prevent 34% of cancer deaths among all US adults ages 25 to 74 (1).Even after accounting for socioeconomic status, institutional and structural racism play an important role in causinginequalities, and they can also directly influence health outcomes. For example, residential segregation (the physicalseparation of two or more groups) can make it harder for some racial/ethnic groups to engage in healthy behaviors,such as accessing healthy foods, spaces for physical activity, and health care. Inequalities in access to preventive care(e.g., smoking cessation), screening services (e.g., colonoscopy and mammography), and the quality of care receivedare important modifiable clinical factors that contribute to cancer health disparities. Quality is often measured basedon whether individuals receive guideline-recommended care and whether they are treated at a facility that has theexperience and infrastructure to care for cancer patients. Research has shownthat racial and ethnic minority patients often receive lower quality carecompared to White patients (2-3). Factors that contribute to theseKey Terms Useddifferences among minority populations include lower representationin This Section:in clinical trials/studies, mistrust in the healthcare system,Institutional & Structural Racismtreatment from less experienced providers/hospitals, and healthcare providers’ beliefs and biases. Also, health insurance statusInstitutional Racismis one of the most important factors determining access toPolicies, practices, and procedures thatquality cancer care. Individuals who lack health insurance havework better for White people than forpeople of color; sometimes unintentionallya higher risk of poor outcomes from cancer compared withor inadvertentlythose who are insured (4-8), and racial and ethnic minoritieshave lower rates of health insurance compared to the WhiteStructural Racismpopulation.A history and current reality of institutionalracism across all social, economic, andenvironmental institutions, combining tocreate a system that negatively impactscommunities of colorThere are some examples of racial/ethnic differences in cancerburden that researchers cannot yet fully explain. One exampleis prostate cancer. Black males are at higher risk of developingprostate cancer compared to other racial/ethnic groups and tendto have more aggressive disease. Another example is female breastcancer. Black women are more likely to be diagnosed with triple-negativebreast cancer, which is more biologically aggressive than other sub-types and has apoorer prognosis (9). Possible explanations may include different risk exposures, interactionsbetween genes and environmental exposures, and health care access and utilization, among others.It is critical for researchers to gain a clearer understanding of the drivers of these differences to develop interventionsthat can improve cancer-related health outcomes. The focus of this report is to describe cancer disparities in terms of thedifferences in rates of new cancer cases and cancer deaths between racial/ethnic groups in Iowa.6Cancer in Iowa 2021
C a ncer Di spari tie s i n I owaKey Terms Usedin This Section:Race & EthnicityKey Points Advancing age is the most important risk factorfor cancer. The incidence rate of cancer in aracial/ethnic group with a younger populationwill be lower than in a group with an olderpopulation. While the White population in Iowa has higherrates of cancer because it is older, Iowa’sBlack population bears the greater burden ofcancer when we account for their differing agedistribution. Iowa’s Black population has the highest cancerincidence rates of all racial/ethnic groupsfor those ages 50-79 years, whereas Iowa’sWhite population has the highest rate amongthose 80 and older. Cancer is striking the Blackpopulation at a much younger age comparedto the White population. Aside from suicide and liver disease, Iowa’sBlack population has the highest mortality ratein every single major cause of death, includingcancer. Consequently, the life expectancyof the Black population in Iowa is only 74.8years compared to 79.3 years for the Whitepopulation. Some of the largest differences in mortalitybetween Iowa’s Black and White populationsinclude prostate, lung, and liver cancers. Iowa’sBlack population also has higher colorectal andbreast cancer mortality rates compared to otherracial/ethnic groups. Black males and females have higher cancermortality rates compared to all otherracial/ethnic groups. Black males haveexperienced the greatest decrease incancer mortality over the past few decades. Cancer mortality rates are declining for eachracial/ethnic group, and the difference isnarrowing between Iowa’s Black and Whitepopulations.Racial/Ethnic GroupsSocially defined identity/communitygroups with shared historiesFor the purposes of this report,racial/ethnic groups include Non-HispanicWhite, Non-Hispanic Black, Non-HispanicAmerican Indian/Alaska Native,Non-Hispanic Asian/Pacific Islander,and Hispanic—any race.Iowa Cancer Registry7
As shown on the left side of Table 1, the Hispanic population is the largest racial/ethnic minority group in Iowarepresenting 6% of the population. Iowa’s Black population makes up almost 4% of the population and the Asian andPacific Islander population makes up almost 3%. These groups grew by 133%, 93%, and 122%, respectively, between2000 and 2018. Table 1 comparesthe number and percent of the IowaTable 1. Population of Iowa Residents and Iowa Cancer Cases byRace/Ethnicitypopulation by racial/ethnic group in2018 to the number of and percent of theState of IowaIowa Cancer2018Registry 2018population of Iowans who were diagnosedN%N%with cancer in 2018. The cancer dataTotal Population3,156,14518,166come from the Iowa Cancer Registry. ItNH White2,695,583 85.4 17,179 94.6is important to note that Iowa CancerNH Black113,562 3.6413 2.3Registry race and ethnicity data areHispanic, any race191,473 6.1239 1.3collected from the medical record,NH Asian/Pacific Islander82,588 2.6147 0.8which may be self-reported by a patientor noted by a patient’s provider. In theNH American Indian/Alaska Native9,710 0.327 0.1latter case, it may not accurately reflectOther4,000 0.17 0.0the individual’s racial/ethnic identityUnknown0 0.0154 0.8as the selection was left to a provider’sNH – Non-Hispanicinterpretation of the patient’s identity.Those who were recorded as being Hispanic were categorized as Hispanic regardless of any other race that was alsorecorded. Everyone else was categorized as being non-Hispanic (NH) White, Black, American Indian/Alaska Native, orAsian/Pacific Islander. Less than 1% of people diagnosed with cancer in 2018 were documented as identifying as morethan one race. These cases were classified as their non-White race/ethnicity per the standardized classification systemused across cancer registries. At times it was necessary to combine multiple groups together into an ‘Other’ category toavoid showing small numbers that could compromise privacy/confidentiality.The information in Table 1 suggests the percent of Iowa cancer cases who are White is larger than the percent of Iowaresidents who are White, whereas the opposite is true for all other racial/ethnic groups. As we will discuss more on thenext page, one major reason for this is because the White population in Iowa is older than all of the other populations,and cancer is more common among people of older ages. It is noteworthy that aside from suicide and liver disease, Iowa’sFigure 1.Age-Adjusted Mortality Rates by Cause of Death and Race/Ethnicity, Iowa, 2014-2018225NH WhiteRate per 100,000200NH BlackHispanic175Other1501251007550258Cancer in Iowa 2021eidicHomeIn umflu oen niazaLiverDC iseirr aho sesisHypertensionPndecibeDiaCause of artDiseaseer0
Black population has the highest mortality rate in every single major causeof death (Figure 1), including cancer. Consequently, the life expectancyKey Terms Usedof the Black population in Iowa is only 74.8 years compared to 79.3in This Section:years for the White population (10). This could mean that manyIncidence & MortalityBlack people die of some other cause before they ever developcancer or are unable to access cancer services to diagnoseIncidenceNumber of new cancers diagnosed during atheir cancer before they die of another cause. The Hispanicspecified time divided by the population at riskpopulation, on the other hand, has the lowest mortality ratefor developing cancerin several of the major causes of death, including cancer.Despite having greater challenges including high povertyIf a county in Iowa has 100 cases inrates, poor healthcare access, and high rates of obesity, thea population of 50,000 people, therate would be 100/50,000 or .002,Hispanic population in Iowa generally experiences betterexpressed as 200 per 100,000 peoplehealth and lives longer (life expectancy 81.8 years) than nonHispanic populations (10).MortalityNumber of cancer deaths that occurredduring a specified time dividedby the populationOne issue that must be considered when comparing cancer ratesbetween different racial/ethnic groups is that some groups tend tobe much older than others. According to the National Cancer Institute,advancing age is the most important risk factor for cancer. Thus, the incidencerate of cancer in a racial/ethnic group with a younger population will be lower than in a group with an older population.Figure 2 shows how the age/sex patterns differ by racial/ethnic group. The White population has a narrow base (fewerpeople in the younger age groups) and a wider top (more people in the older age groups) compared to the Black andHispanic populations. When compared to the US population (shown in bottom right corner), Iowa has more of itspeople in the older age groups as reflected most by the non-Hispanic White population.Age Distribution by Race/Ethnicity*, Iowa, 2018 5-year EstimatesBlackMaleFemale85 5-9 58 7 6 5 4 3 2 1 0 1 2 3 4 5 6 7 8Percent of Population85 5-9 5MaleFemale85 5-9 5MaleMaleFemale8 7 6 5 4 3 2 1 0 1 2 3 4 5 6 7 8Percent of PopulationUnited States, 2000 CensusAmerican Indian/Alaska NativeFemale98765 4 3 2 1 0 1 234 5 67 89Percent of Population85 5-9 58 7 6 5 4 3 2 1 0 1 2 3 4 5 6 7 8Percent of PopulationAgeAgeAsian/Pacific IslanderHispanicMaleAge85 5-9 5AgeAgeNon-Hispanic WhiteFemaleAgeFigure 2.98765 4 3 2 1 0 1 234 5 67 89Percent of Population85 5-9 5MaleFemale98765 4 3 2 1 0 1 234 5 67 89Percent of Population*American Community Survey data do not separate Hispanic and non-Hispanic forBlack, Asian/Pacific Islander, and American Indian/Alaska NativeIowa Cancer Registry9
Figure 4. Age-Adjusted Cancer Incidence Rates byRace/Ethnicity, All Sites, Male & Female, Iowa, 1994-2018700700600600500500Rate per 100,000Rate per 100,000Figure 3. Crude Cancer Incidence Rates byRace/Ethnicity, All Sites, Male & Female, Iowa, ars of DiagnosisNH WhiteNH BlackHispanic2009-20132004-20082014-2018Years of DiagnosisOtherNH WhiteHispanicNH BlackOtherRate per 100,000Figure 3 shows the actual cancer incidence rates for the racial/ethnic populations in the state of Iowa from 1994-2018.These rates are called “crude rates” because they are a true reflection of the population, and do not account for differencesin age distributions. The crude rates show that Iowa’s White population has a higher cancer rate compared to otherracial/ethnic groups, which is expected since they have a larger population in the older age groups. However, the purposeof this report is to compare differences in cancer rates between racial/ethnic groups among people of similar ages. Aprocess called age-adjustment was therefore used toallow populations with different age distributionsFigure 5. Cancer Incidence Rates by Race/Ethnicity andto be fairly compared. The age-adjusted incidenceAge at Diagnosis, All Sites, Male & Female, Iowa, 1994-2018rates in Figure 4 show a much different pattern than in2500Figure 3, with the Black population having the highestage-adjusted cancer incidence rate. The cancer incidence2000rates have been declining since the 1994-1998 time1500period in all groups with the exception of the Whitepopulation. The key takeaway from these graphs is that1000while the White population in Iowa has higher rates of500cancer because it is older, Iowa’s Black population bears0the greater burden of cancer when we account for their0-3950-5940-4960-6970-7980 differing age distribution.Age at Diagnosis (Years)10Cancer in Iowa 2021NH WhiteNH BlackHispanicOtherFigure 6. Age-Adjusted Mortality Rates for All MalignantCancers by Race/Ethnicity, Male & Female, Iowa, 1994-2018300Rate per 100,000Examination of cancer incidence rates by racial/ethnicgroup and age at diagnosis (Figure 5) displays moreconcerning differences. Rates of cancer incidence arefairly similar across racial/ethnic groups in the 0-39 and40-49 age ranges, but larger differences begin to emergethereafter. Iowa’s Black population had the highestcancer incidence rates of all racial/ethnic groups for the50-59, 60-69 and 70-79 year age ranges, whereas Iowa’sWhite population had the highest rate among those 80and older. This shows that cancer is striking the Blackpopulation at a much younger age compared to theWhite population. The Hispanic population, on the otherhand, has the lowest cancer incidence rates across all 0132014-2018Years of DiagnosisNH WhiteNH BlackHispanicOther
Figure 6 shows the Black population in Iowa had the highest overall age-adjusted cancer mortality (death) rate of anyracial/ethnic group since the 1994-1998 time period. The cancer mortality rates are declining for each group, and thedifference is narrowing between Iowa’s Black and White populations. Cancer mortality rates by racial/ethnic groupare shown separately for males and females in Figure 7. Per the standardized classification system used across cancerregistries, information about the patient’s sex assigned at birth is collected from the medical record and recorded asmale, female, or other. This information may be self-reported by a patient or noted by a patient’s provider based ontheir previous medical record. The Registry does not collect information on the gender identity of patients, and theway patients get classified could differ from the way they identify or from their sex assigned at birth, depending on whoreported the information. Black males have historically had much higher cancer mortality rates compared to all otherracial/ethnic groups, and much higher cancer mortality rates compared to Black females. Black males have experiencedFigure 7.Age-Adjusted Mortality Rates for All Malignant Cancers by Race/Ethnicity and Sex, Iowa, 1994-2018FEMALE450450400400350350300300Rate per 100,000Rate per 2003NH White2009-20132014-2018Years of DiagnosisYears of DiagnosisNH Black2004-2008HispanicOtherNH WhiteNH BlackHispanicOtherRate per 100,000the greatest decrease in cancer mortality from 1994-1998 to 2014-2018. Black females have also had the highestmortality across all time periods, but the difference between rates among Black and White females was smaller than itwas for males. Hispanic males and females had cancer mortality rates that were similar to White males and females in the1994-1998 time period, but then experienced much larger decreases over time and had substantially lower rates in the2014-2018 time period.Figure 8. Age-Adjusted Mortality Rates by Cancer Site andRace/Ethnicity, Iowa, 1994-2018Figure 8 shows mortality rates byracial/ethnic groups for several55of the top cancers in Iowa (lung,5045prostate, female breast, colorectum,liver, myeloma, and stomach).4035Some of the largest differences in30mortality between Iowa’s Black and25White populations include prostate,20lung, and liver cancers. Iowa’s Black15population also has higher colorectal10and breast cancer mortality rates5compared to other iverMyelomagroups. While the breast cancerBreastmortality rate is only slightly higherOtherNH WhiteNH BlackHispanicamong Black females compared toIowa Cancer Registry11
White females, it is important to consider that the breast cancer incidence rate is higher among White females. In otherwords, Black females get breast cancer less often than White females but die from it more often. Liver and stomachcancers are among the very few cancer sites for which the Hispanic population have higher mortality rates than thenon-Hispanic White population.This report serves as a first step in documenting the highly concerning racial/ethnic disparities in cancer in Iowa. We areplanning ongoing analyses to further describe these disparities so that policymakers, public health practitioners, healthcare providers, community and advocacy groups, researchers and the people of Iowa can carry out the hard work it willtake to eliminate these disparities. In the words of Rosa Parks, “To bring about change, you must not be afraid to take thefirst step. We will fail when we fail to try.”Please consider visitingthese websites in the futureto find updates on CancerDisparities in anceriowa.org/References1. Siegel RL, Jemal A, Wender RC, Gansler T, Ma J, Brawley OW. An assessment of progress in cancer control. CACancer J Clin 2018;68:329-392. Zavala, V.A., Bracci, P.M., Carethers, J.M. et al. Cancer health disparities in racial/ethnic minorities in the UnitedStates. Br J Cancer 124, 315–332 (2021). https://doi.org/10.1038/s41416-020-01038-63. Esnaola, N. F., & Ford, M. E. (2012). Racial differences and disparities in cancer care and outcomes: where’s therub?. Surgical oncology clinics of North America, 21(3), 417–viii. https://doi.org/10.1016/j.soc.2012.03.0124. Pan HY, Walker GV, Grant SR, Allen PK, Jiang J, Guadagnolo BA, et al. Insurance status and racial disparities incancer-specific mortality in the United States: a population-based analysis. Cancer Epidemiol Biomarkers Prev2017;26:869–755. Niu X, Roche LM, Pawlish KS, Henry KA. Cancer survival disparities by health insurance status. Cancer Med2013;2:403–116. Rong X, Yang W, Garzon-Muvdi T, Caplan JM, Hui X, Lim M, et al. Influence of insurance status on survival ofadults with glioblastoma multiforme: a population-based study. Cancer 2016;122:3157–657. Markt SC, Lago-Hernandez CA, Miller RE, Mahal BA, Bernard B, Albiges L, et al. Insurance status anddisparities in disease presentation, treatment, and outcomes for men with germ cell tumors. Cancer2016;122:3127–358. Pezzi TA, Schwartz DL, Mohamed ASR, Welsh JW, Komaki RU, Hahn SM, et al. Barriers to combined-modalitytherapy for limited-stage small cell lung cancer. JAMA Oncol 2018;4:e1745049. American Cancer Society. Breast cancer facts & figures 2019– 2020. Atlanta: American Cancer Society; 201910. https://en.wikipedia.org/wiki/Race and health in the United States#cite note-:12-1512Cancer in Iowa 2021
C ancer Pro f i l e Re p o r tsThe Iowa Cancer Registry can use thedata it collects to help communities andhospitals better understand the burden ofcancer in their population and allow themto plan for needed services.Table of patientdemographics in thegeographic area ofinterestIf you are interested ina community or hospitalcancer profile report,please contactMary Charlton atmary-charlton@uiowa.edu.Number of newcancer diagnoses inthe geographicarea of interest,and informationabout the servicesreceived (surgery,chemotherapy, orradiation)We are also ableto compile publiclyavailable data aboutcancer-related risk factorsand screeningpractices in thegeographicarea of interestcompared tothe State ofIowa and the USComparisonof stage atdiagnosisof selectedcancersbetweenpopulations inthe geographicarea of interestand the State ofIowaIowa Cancer Registry13
O nline Data Source sBelow are sources where individuals can generate cancer statistics themselves. A variety of statistics ca
disease in all 50 states. In Iowa, cancer data are collected by the State Health Registry of Iowa, also known as the Iowa Cancer Registry (ICR). Since 1973, the ICR has been funded by the Surveillance, Epidemiology, and End Results (SEER) Program of the National Cancer Institute (NCI), and is currently one of 21 US registries providing data.