Transcription
Understanding the Mirai BotnetManos Antonakakis, Georgia Institute of Technology; Tim April, Akamai; Michael Bailey,University of Illinois, Urbana-Champaign; Matt Bernhard, University of Michigan, Ann Arbor;Elie Bursztein, Google; Jaime Cochran, Cloudflare; Zakir Durumeric and J. Alex Halderman,University of Michigan, Ann Arbor; Luca Invernizzi, Google; Michalis Kallitsis, Merit Network,Inc.; Deepak Kumar, University of Illinois, Urbana-Champaign; Chaz Lever, Georgia Instituteof Technology; Zane Ma and Joshua Mason, University of Illinois, Urbana-Champaign;Damian Menscher, Google; Chad Seaman, Akamai; Nick Sullivan, Cloudflare;Kurt Thomas, Google; Yi Zhou, University of Illinois, ntonakakisThis paper is included in the Proceedings of the26th USENIX Security SymposiumAugust 16–18, 2017 Vancouver, BC, CanadaISBN 978-1-931971-40-9Open access to the Proceedings of the26th USENIX Security Symposiumis sponsored by USENIX
Understanding the Mirai BotnetManos Antonakakis Tim April‡ Michael Bailey† Matthew Bernhard/ Elie Bursztein Jaime Cochran. Zakir Durumeric/ J. Alex Halderman/ Luca Invernizzi Michalis Kallitsis§ Deepak Kumar† Chaz Lever Zane Ma† Joshua Mason†Damian Menscher Chad Seaman‡ Nick Sullivan. Kurt Thomas Yi Zhou†Technologies . Cloudflare Georgia Institute of Technology GoogleNetwork † University of Illinois Urbana-Champaign / University of Michigan‡ Akamai§ MeritAbstractThe Mirai botnet, composed primarily of embeddedand IoT devices, took the Internet by storm in late 2016when it overwhelmed several high-profile targets withmassive distributed denial-of-service (DDoS) attacks. Inthis paper, we provide a seven-month retrospective analysis of Mirai’s growth to a peak of 600k infections anda history of its DDoS victims. By combining a varietyof measurement perspectives, we analyze how the botnet emerged, what classes of devices were affected, andhow Mirai variants evolved and competed for vulnerablehosts. Our measurements serve as a lens into the fragileecosystem of IoT devices. We argue that Mirai may represent a sea change in the evolutionary development ofbotnets — the simplicity through which devices were infected and its precipitous growth, demonstrate that novicemalicious techniques can compromise enough low-enddevices to threaten even some of the best-defended targets.To address this risk, we recommend technical and nontechnical interventions, as well as propose future researchdirections.1IntroductionStarting in September 2016, a spree of massive distributeddenial-of-service (DDoS) attacks temporarily crippledKrebs on Security [46], OVH [43], and Dyn [36]. The initial attack on Krebs exceeded 600 Gbps in volume [46] —among the largest on record. Remarkably, this overwhelming traffic was sourced from hundreds of thousands ofsome of the Internet’s least powerful hosts — Internet ofThings (IoT) devices — under the control of a new botnetnamed Mirai.While other IoT botnets such as BASHLITE [86] andCarna [38] preceded Mirai, the latter was the first toemerge as a high-profile DDoS threat. What explainsMirai’s sudden rise and massive scale? A combination Denotesprimary, lead, or “first” authorUSENIX Associationof factors — efficient spreading based on Internet-widescanning, rampant use of insecure default passwords inIoT products, and the insight that keeping the botnet’sbehavior simple would allow it to infect many heterogeneous devices — all played a role. Indeed, Mirai hasspawned many variants that follow the same infectionstrategy, leading to speculation that “IoT botnets are thenew normal of DDoS attacks” [64].In this paper, we investigate the precipitous rise of Mirai and the fragile IoT ecosystem it has subverted. Wepresent longitudinal measurements of the botnet’s growth,composition, evolution, and DDoS activities from August 1, 2016 to February 28, 2017. We draw from adiverse set of vantage points including network telescopeprobes, Internet-wide banner scans, IoT honeypots, C2milkers, DNS traces, and logs provided by attack victims. These unique datasets enable us to conduct the firstcomprehensive analysis of Mirai and posit technical andnon-technical defenses that may stymie future attacks.We track the outbreak of Mirai and find the botnetinfected nearly 65,000 IoT devices in its first 20 hoursbefore reaching a steady state population of 200,000–300,000 infections. These bots fell into a narrow band ofgeographic regions and autonomous systems, with Brazil,Columbia, and Vietnam disproportionately accounting for41.5% of infections. We confirm that Mirai targeted avariety of IoT and embedded devices ranging from DVRs,IP cameras, routers, and printers, but find Mirai’s ultimatedevice composition was strongly influenced by the marketshares and design decisions of a handful of consumerelectronics manufacturers.By statically analyzing over 1,000 malware samples,we document the evolution of Mirai into dozens of variants propagated by multiple, competing botnet operators.These variants attempted to improve Mirai’s detectionavoidance techniques, add new IoT device targets, and introduce additional DNS resilience. We find that Mirai harnessed its evolving capabilities to launch over 15,000 attacks against not only high-profile targets (e.g., Krebs26th USENIX Security Symposium1093
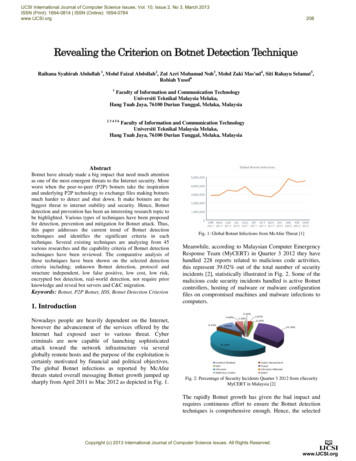
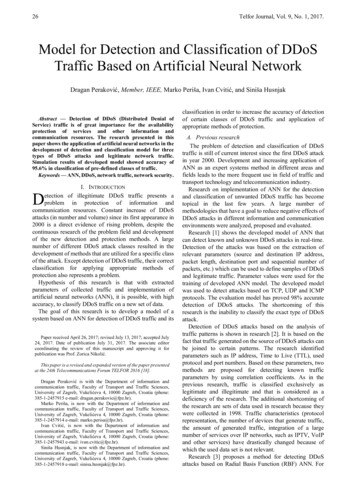
09/30/2016Source code released09/18/201610/21/2016OVH attacksbeginDyn attacksSept08/01/2016Mirai surfacesOct09/21/2016Krebs on Securitypeak attack11/26/2016Deutsche TelekomCWMP exploitNov10/31/2016Liberia Lonestarattacks beginDec02/23/2017Deutsche Telekomattacker arrestedJanFeb01/18/2017Mirai authoridentifiedFigure 1: Mirai Timeline — Major attacks (red), exploits (yellow), and events (black) related to the Mirai botnet.on Security, OVH, and Dyn), but also numerous gameservers, telecoms, anti-DDoS providers, and other seemingly unrelated sites. While DDoS was Mirai’s flavorof abuse, future strains of IoT malware could leverageaccess to compromised routers for ad fraud, cameras forextortion, network attached storage for bitcoin mining,or any number of applications. Mirai’s reach extendedacross borders and legal jurisdictions, and it infected devices with little infrastructure to effectively apply securitypatches. This made defending against it a daunting task.Finally, we look beyond Mirai to explore the securityposture of the IoT landscape. We find that the absence ofsecurity best practices — established in response to desktop worms and malware over the last two decades — hascreated an IoT substrate ripe for exploitation. However,this space also presents unique, nuanced challenges in therealm of automatic updates, end-of-life, and consumer notifications. Without improved defenses, IoT-based attacksare likely to remain a potent adversarial technique as botnet variants continue to evolve and discover new nichesto infect. In light of this, Mirai seems aptly named — it isJapanese for “the future.”2The Mirai BotnetMirai is a worm-like family of malware that infectedIoT devices and corralled them into a DDoS botnet. Weprovide a brief timeline of Mirai’s emergence and discussits structure and propagation.Timeline of eventsReports of Mirai appeared asearly as August 31, 2016 [89], though it was not untilmid-September, 2016 that Mirai grabbed headlines withmassive DDoS attacks targeting Krebs on Security [46]and OVH [74] (Figure 1). Several additional high-profileattacks later targeted DNS provider Dyn [36] andLonestar Cell, a Liberian telecom [45]. In early 2017, theactors surrounding Mirai came to light as the Mirai authorwas identified [49]. Throughout our study, we corroborateour measurement findings with these media reports andexpand on the public information surrounding Mirai.Another significant event in this timeline is the public109426th USENIX Security Symposiumrelease of Mirai’s source code on hackforums.net [4]. Werely on this code to develop our measurement methodology (Section 3). Furthermore, as we detail later (Section 5), this source code release led to the proliferationof Mirai variants with competing operators. One notablevariant added support for a router exploit through CPEWAN Management Protocol (CWMP), an HTTP-basedprotocol that enables auto-configuration and remote management of home routers, modems, and other customerpremises equipment (CPE) [15]. This exploit led to an outage at Deutsche Telekom late November 2016 [47], withthe suspected attacker later arrested in February 2017 [13].In this work, we track Mirai’s variants and examine howthey influenced Mirai’s propagation.Botnet structure & propagation We provide a summary of Mirai’s operation in Figure 2, as gleaned fromthe released source code. Mirai spread by first enteringa rapid scanning phase ( ) where it asynchronously and“statelessly” sent TCP SYN probes to pseudorandom IPv4addresses, excluding those in a hard-coded IP blacklist, onTelnet TCP ports 23 and 2323 (hereafter denoted TCP/23and TCP/2323). If Mirai identifies a potential victim, it entered into a brute-force login phase in which it attemptedto establish a Telnet connection using 10 username andpassword pairs selected randomly from a pre-configuredlist of 62 credentials. At the first successful login, Miraisent the victim IP and associated credentials to a hardcoded report server ( ).A separate loader program ( ) asynchronously infected these vulnerable devices by logging in, determiningthe underlying system environment, and finally, downloading and executing architecture-specific malware ( ).After a successful infection, Mirai attempted to concealits presence by deleting the downloaded binary and obfuscating its process name in a pseudorandom alphanumeric string. As a consequence, Mirai infections did notpersist across system reboots. In order to fortify itself,the malware additionally killed other processes boundto TCP/22 or TCP/23, as well as processes associatedwith competing infections, including other Mirai variants, .anime [25], and Qbot [72]. At this point, the botUSENIX Association
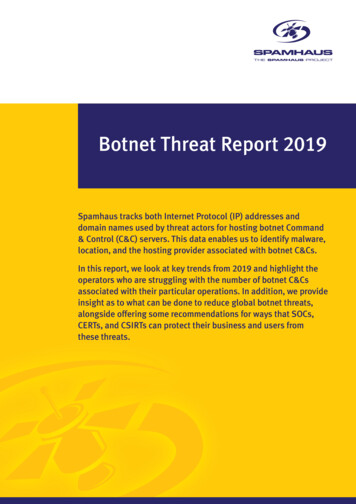
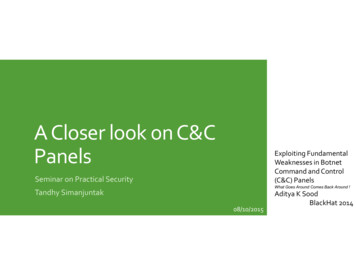
3.1AttackerSend commandInfrastructureCommand& vicesScanVictimBotsAttackDDoS TargetFigure 2: Mirai Operation — Mirai bots scan the IPv4 addressspace for devices that run telnet or SSH, and attempt to log in using a hardcoded dictionary of IoT credentials. Once successful,the bot sends the victim IP address and associated credentials toa report server, which asynchronously triggers a loader to infectthe device. Infected hosts scan for additional victims and acceptDDoS commands from a command and control (C2) server.listened for attack commands from the command and control server (C2) while simultaneously scanning for newvictims.Malware phylogeny While not directly related toour study, the Mirai family represents an evolution ofBASHLITE (otherwise known as LizardStresser, Torlus,Gafgyt), a DDoS malware family that infected Linuxdevices by brute forcing default credentials [86]. BASHLITE relied on six generic usernames and 14 generic passwords, while the released Mirai code used a dictionaryof 62 username/password pairs that largely subsumedBASHLITE’s set and added credentials specific to consumer routers and IoT devices. In contrast to BASHLITE,Mirai additionally employed a fast, stateless scanningmodule that allowed it to more efficiently identify vulnerable devices.3MethodologyOur study of Mirai leverages a variety of network vantagepoints: a large, passive network telescope, Internet-widescanning, active Telnet honeypots, logs of C2 attackcommands, passive DNS traffic, and logs from DDoSattack targets. In this section, we discuss our data sourcesand the role they play in our analysis. We provide ahigh-level summary in Table 1.USENIX AssociationNetwork TelescopeMirai’s indiscriminate, rapid scanning strategy lends itself to tracking the botnet’s propagation to new hosts. Wemonitored all network requests to a network telescope [9]composed of 4.7 million IP address operated by MeritNetwork over a seven month period from July 18, 2016to February 28, 2017. On average, the network telescopereceived 1.1 million packets from 269,000 IP addressesper minute during this period. To distinguish Mirai trafficfrom background radiation [94] and other scanning activity, we uniquely fingerprinted Mirai probes based onan artifact of Mirai’s stateless scanning whereby everyprobe has a TCP sequence number — normally a random32-bit integer — equal to the destination IP address. Thelikelihood of this occurring incidentally is 1/232 , and wewould expect to see roughly 86 packets demonstratingthis pattern in our entire dataset. In stark contrast, weobserved 116.2 billion Mirai probes from 55.4 million IPaddresses. Prior to the emergence of Mirai, we observedonly three IPs that perform scans with this fingerprint.Two of the IP addresses generated five packets; two onTCP/80 and three on TCP/1002. The third IP address belongs to Team Cymru [1], who conducts regular TCP/443scans.We caution that the raw count of IP addresses seenscanning over time is a poor metric of botnet size due toDHCP churn [87]. To account for this, we tracked the sizeof the botnet by considering the number of hosts actively“scanning” at the start of every hour. We detected scansusing the methodology presented by Durumeric et al. [23],in which we group packets from a single IP address ina temporal window into logical scans. We specificallyidentified scans that targeted the IPv4 address space at anestimated rate of at least five packets per second, expiringinactive scans after 20 minutes. We geolocated IPs usingMaxmind [61].3.2Active ScanningWhile Mirai is widely considered an IoT botnet, therehas been little comprehensive analysis of infected devicesover the botnet’s entire lifetime. In order to determine themanufacturer and model of devices infected with Mirai,we leveraged Censys [22], which actively scans the IPv4space and aggregates application layer data about hosts onthe Internet. We focused our analysis on scans of HTTPS,FTP, SSH, Telnet, and CWMP between July 19, 2016 andFebruary 28, 2017.A number of challenges make accurate device labelingdifficult. First, Mirai immediately disables common outward facing services (e.g., HTTP) upon infection, whichprevents infected devices from being scanned. Second,Censys scans often take more than 24 hours to complete,26th USENIX Security Symposium1095
RoleData SourceCollection SiteCollection PeriodData VolumeGrowth and sizeNetwork telescopeMerit Network, Inc.07/18/2016–02/28/2017370B packets, avg. 269K IPs/minDevice compositionActive scanningCensys07/19/2016–02/28/2017136 IPv4 scans, 5 protocolsOwnership & evolutionTelnet honeypotsTelnet honeypotsMalware repositoryDNS — activeDNS — passiveAWS EC2AkamaiVirusTotalGeorgia TechLarge U.S. /2016–02/28/2017141 binaries293 binaries594 binaries290M RRs/day209M RRs/dayAttack characterizationC2 milkersDDoS IP addressesDDoS IP addressesDDoS IP addressesAkamaiAkamaiGoogle 1610/21/201664.0K attack commands12.3K IP addresses158.8K IP addresses107.5K IP addressesTable 1: Data Sources — We utilized a multitude of data perspectives to empirically analyze the Mirai 45587,743(31.5%)TotalDevices IdentifiedTable 2: Devices Identified — We identified device type, model,and/or vendor for 31.5% of active scan banners. Protocol banners varied drastically in device identifiability, with HTTPScertificates being most descriptive, and SSH prompts being theleast.during which devices may churn to new IP addresses. Finally, Censys executes scans for different protocols ondifferent days, making it difficult to increase label specificity by combining banners from multiple services. Wenavigated these constraints by restricting our analysisto banners that were collected within twenty minutes ofscanning activity (the time period after which we expirea scan). This small window mitigates the risk of erroneously associating the banner data of uninfected deviceswith Mirai infections due to DHCP churn.Post-filtering, our dataset included 1.8 million bannersassociated with 1.2 million Mirai-infected IP addresses(Table 2). We had the most samples for CWMP, andthe least for SSH. We caution that devices with openservices that are not closed by Mirai (e.g., HTTPS andFTP) can appear repeatedly in Censys banner scans duringour measurement window (due to churn) and thus lead toover counting when compared across protocols. As such,we intentionally explored protocols in isolation from oneanother and limited ourselves to measurements that onlyconsider relative proportions rather than absolute countsof infected hosts.Finally, we processed each infected device’s banner toidentify the device manufacturer and model. We first applied the set of regular expressions used by Nmap service109626th USENIX Security Symposiumprobes to fingerprint devices [58]. Nmap successfullyhandled 98% of SSH banners and 81% of FTP banners,but matches only 7.8% of the Telnet banners. In order toincrease our coverage and also accommodate HTTPS andCWMP (which Nmap lacks probes for), we constructedour own regular expressions to map banners to devicemanufacturers and models. Unfortunately, we found thatin many cases, there was not enough data to identify amodel and manufacturer from FTP, Telnet, CWMP, andSSH banners and that Nmap fingerprints only providegeneric descriptions. In total, we identified device typeand/or model and manufacturer for 31.5% of banners(Table 2). We caution that this methodology is susceptible to misattribution in instances where port-forwardingand Universal Plug and Play (UPnP) are used to presentmultiple devices behind a single IP address, making thedistinction between middlebox and end-device difficult.3.3Telnet HoneypotsTo track the evolution of Mirai’s capabilities, we collectedbinaries installed on a set of Telnet honeypots that masqueraded as vulnerable IoT devices. Mechanically, wepresented a BusyBox shell [92] and IoT-consistent devicebanner. Our honeypots logged all incoming Telnet traffic and downloaded any binaries that attackers attemptedto install on the host via wget or tftp (the methods ofinfection found in Mirai’s original source). In order toavoid collateral damage, we blocked all other outgoingrequests (e.g., scanning and DoS traffic).We logged 80K connection attempts from 54K IP addresses between November 2, 2016 and February 28,2017, collecting a total 151 unique binaries. We filteredout executables unrelated to Mirai based on a YARA signature that matched any of the strings from the originalsource code release, leaving us with 141 Mirai binaries.We supplemented this data with 293 binaries observed byhoneypots operated by Akamai, which served a similarpurpose to ours, but were hosted on a different publicUSENIX Association
cloud provider. As a final source of samples, we included594 unique binaries from VirusTotal [90] that we scannedfor using the YARA rules mentioned above. In total, wecollected 1,028 unique Mirai samples.We analyzed the binaries for the three most common architectures — MIPS 32-bit, ARM 32-bit, and x86 32-bit —which account for 74% of our samples. We extractedthe set of logins and passwords, IP blacklists, and C2 domains from these binaries, identifying 67 C2 domains and48 distinct username/password dictionaries (containing atotal 371 unique passwords).3.4Passive & Active DNSFollowing the public release of Mirai’s source code, competing Mirai botnet variants came into operation. Wedisambiguated ownership and estimate the relative sizeof each Mirai strain by exploring passive and active DNSdata for the 67 C2 domains that we found by reverse engineering Mirai binaries. We also leveraged our DNS datato map the IP addresses present in attack commands tovictim domain names.From a large U.S. ISP, we obtained passive DNS dataconsisting of DNS queries generated by the ISP’s clientsand their corresponding responses. More specifically,we collected approximately 209 million resource records(RRs) — queried domain name, and associated RDATA —and their lookup volumes aggregated on a daily basis.For our active DNS dataset, we obtained 290 millionRRs per day from Thales, an active DNS monitoringsystem [44]. Both datasets cover the period of August 1,2016 to February 28, 2017.Using both passive and active DNS datasets, we performed DNS expansion to identify shared DNS infrastructure by linking related historic domain names (RHDN)and related historic IPs (RHIPs) [5]. This procedure began with the seed set of C2 domains and IPs extractedduring reverse engineering of our honeypotted binaries.For a given seed foo.com, we identified the IP addressesthat foo.com previously resolved to and added them toa growing set of domains and IPs. We additionally performed the reverse analysis, starting from an IP and finding any domain names that concurrently resolved it. Thus,even from a single domain name, we iteratively expandedthe set of related domain names and IP addresses to construct a graph reflecting the shared infrastructure usedby Mirai variants. In total, we identified 33 unique DNSclusters that we explore in detail in Section 5.3.5Attack CommandsTo track the DDoS attack commands issued by Miraioperators, Akamai ran a “milker” from September 27,2016–February 28, 2017 that connected to the C2 serversUSENIX Associationfound in the binaries uploaded to their honeypots. Theservice simulated a Mirai-infected device and communicated with the C2 server using a custom bot-to-C2 protocol, which was reverse engineered from malware samplesprior to source code release. In total, Akamai observed64K attack commands issued by 484 unique C2 servers(by IP address). We note that a naive analysis of attackcommands overestimates the volume of attacks and targets: individual C2 servers often repeat the same attackcommand in rapid succession, and multiple distinct C2servers frequently issued the same command. To accountfor this, we heuristically grouped attack commands alongtwo dimensions: by shared C2 infrastructure and by temporal similarity. We collapsed matching commands (i.e.,tuples of attack type, duration, targets, and command options) that occur within 90 seconds of each other, whichyielded 15,194 attacks from 146 unique IP clusters. Ourattack command coverage includes the Dyn attack [36]and Liberia attacks [45]. We did not observe attack commands for Krebs on Security and OVH, which occurredprior to the milker’s operation.3.6DDoS Attack TracesOur final data source consists of network traces and aggregate statistics from Akamai and Google Shield (theproviders for Krebs on Security) and Dyn. These attackscover two distinct periods in Mirai’s evolution. We usedthis data to corroborate the IP addresses observed in attacks versus those found scanning our passive networktelescope, as well as to understand the volume of traffic generated by Mirai1 . From Akamai, we obtained anaggregate history of all DDoS attacks targeting Krebson Security from 2012–2016, as well as a small sample of 12.3K IPs related to a Mirai attack on September21, 2016. For Google Shield, we shared a list of IP addresses observed by our network telescope and in turnreceived aggregate statistics on what fraction matchedany of 158.8K IP addresses involved in a 1-minute MiraiHTTP-flood attack on September 25, 2016. Finally, Dynprovided us with a set of 107.5K IP addresses associatedwith a Mirai attack on October 21, 2016.4Tracking Mirai’s SpreadAs a first step towards understanding Mirai, we analyzedhow the botnet bootstrapped its initial infections, whattypes of devices it targeted, and how it eventually infectedan estimated 600K hosts. To contextualize the propertiesof Mirai, we compare it against prior botnets and worms.1 We overlapped attack traces with every Mirai scanning IPs on ournetwork telescope. The overlap may have been inflated by non-Miraiattack IPs being assigned to Mirai devices over time through DHCPchurn.26th USENIX Security Symposium1097
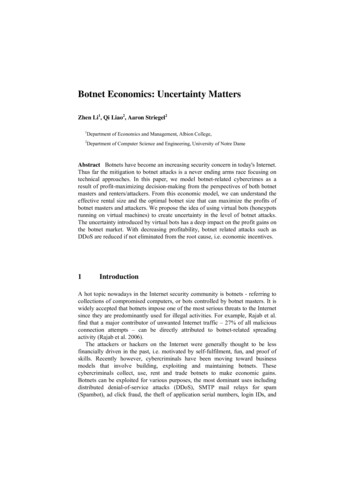
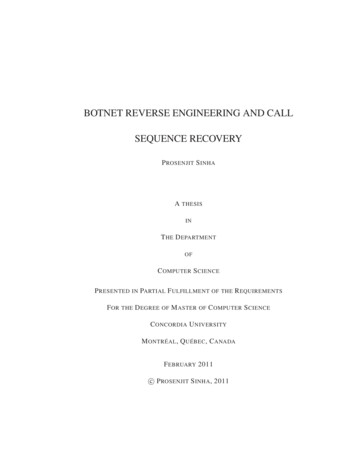
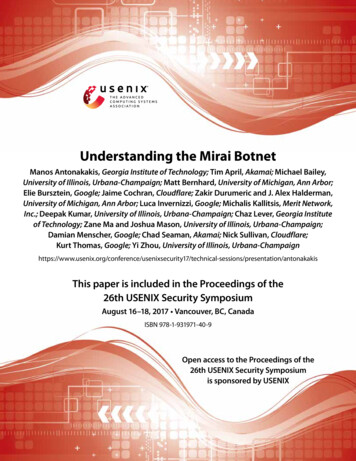
Figure 3: Temporal Mirai Infections — We estimate of the number of Mirai-infected devices over time by tracking the number ofhosts actively scanning with Mirai fingerprint at the start of every hour. Mirai started by scanning Telnet, and variants evolved totarget 11 additional protocols. The total population initially fluctuated between 200,000–300,000 devices before receding to 100,000devices, with a brief peak of 600,000 devices.4.2Figure 4: Bootstrap Scanning — Mirai scanning began on August 1, 2016 from a single IP address in a bulletproof hostingcenter. Mirai infection spread rapidly with a 76-minute doubling time and quickly matched the volume of non-Mirai Telnetscanning.4.1BootstrappingWe provide a timeline of Mirai’s first infections in Figure 4. A single preliminary Mirai scan occurred on August 1, 2016 from an IP address belonging to DataWagon,a U.S.-based bulletproof hosting provider [48]. Thisbootstrap scan lasted approximately two hours (01:42–03:59 UTC), and about 40 minutes later (04:37 UTC) theMirai botnet emerged. Within the first minute, 834 devices began scanning, and 11K hosts were infected withinthe first 10 minutes. Within 20 hours, Mirai infected64,500 devices. Mirai’s initial 75-minute doubling timeis outstripped by other worms such as Code Red (37minute doubling time [70]) and Blaster (9-minute doubling time [10]). Mirai’s comparatively modest initialgrowth may be due to the low bandwidth and computational resources of infected devices, a consequence of thelow-accuracy, brute-force login using a small number ofcredentials, or simply attributable to a bottleneck in loaderinfrastructure.109826th USENIX Security SymposiumSteady State SizeWe observed multiple phases in Mirai’s life: an initialsteady state of 200,000–300,000 infections in September2016; a peak of 600,000 infections at the end of November 2016; and a collapse to roughly 100,000 infections atthe end of our observation window in late February 2017(Figure 3). Even though hosts were initially compromisedvia a simple dictionary attack, Mirai was able to infecthundreds of thousands of devices. This is similar in scaleto historical botnets such as the prolific Srizbi spam botnet (400,000 bots [83]), which was responsible for morethan half of all global botnet spam [35], and the Carnabotnet (420,000 bots [38]), the first botnet of IoT devicescompromised using default credentials.While the original Mirai variant infected devices byattempting Telnet and SSH logins with a static set ofcredentials, later strains evolved to scan for other types ofvulnerabilities. Most notably, Mirai-fingerprinted scanstargeting TCP/7547, the standard port for CWMP, beganappearing in our dataset on November 26, 2016. Miraicompromised CWMP devices through an RCE exploitin a SOAP configuration endpoint [41]. The new attackvector led to a renewed spike of infections (Figure 3). Thedecay that followed may be explained best by DeutscheTelekom patching routers soon after the attack [21]. Thenon-immediate decay may have been due to the devicesrequiring a reboot for the patch to take effect.To better understand the decrease in Mirai bots froma steady state of 300,000 devices down to 100,000 devices, we examined the ASes in which raw populationdecreased most significantly between September 21, 2016and February 28, 2017. The ASes with the largest reduction in devices were: Telefónica Colombia ( 38,589 bots, 98.5%), VNPT Corp ( 16,791 bots, 90.2%), and ClaroS.A. ( 14,150 bots, 80.2%). This suggests potential action by certain network operators to mitigate Mirai. Whilea handful of ASes increased in prevalence over time, no-USENIX Association
tably Telefónica de Argentina ( 3,287 bots, 3,365.1%)and Ecuadorian telecom company CNT EP ( 1,447 bots,116.4%), the total increase ( 10,500 bots) across all ASesis eclipsed by the overall decrease ( 232,698 2%BrazilColombiaVietnamChinaS. KoreaRussiaTurkeyIndiaTaiwanArgentinaTable 3: Geographic Distribution — We compare countriesthat harbored the most infections on 09/21/2016 — when Krebson Security was attacked — with countries that hosted the mosttelnet devices on 07/19/2016 prior to Mirai’s onset. Mirai infections occurred disproportionately in South America and Southeast Asia, accounting for 50% of infections.4.3Global DistributionIn order to understand where Mirai infections were geographically concentrated, we calculated the geolocationof Mirai bots actively scanning at 00:00 UTC on September 21, 2016 (during the first Krebs on Security attackand Mirai’s peak steady state infection period). As shownin Figure 3, the bulk of Mirai infections stemmed fromdevices located in Brazil (15.0%), Columbia (14.0%), andVietnam (12.5%). Mirai also exhibited a concentrated network distribution — the top 10 ASes accounted for 44.3%of infections, and the top 100 accounted for 78.6% ofinfections (Table 4). Compared to the pre-Mirai globaldistribution of telnet hosts, Mirai consisted of a disproportionate number of devices concentrated in South AmericaAS%Telefónica Colombia 11.9%VNPT Corp.5.7%Claro S.A.5.4%China Telecom†4.0%Telefônica Brasil3.4%ASTürk TelekomChunghwa Telecom†FPT GroupKorea Telecom†Viettel Corporation%3.2%2.9%2.8%2.6%2.5%Table 4: AS Distribution — We list the 10 ASes with the largestnumber of infections on 09/21/2016, the day Krebs on Securitywas attacked and the initial peak infection. The top 10 ASesaccounted for 44.3% of infections, but only three of the top 10are wi
vices with little infrastructure to effectively apply security patches. This made defending against it a daunting task. Finally, we look beyond Mirai to explore the security posture of the IoT landscape. We find that the absence of security best practices—established in response to desk-top worms and malware over the last two decades—has