Transcription
White PaperApplication Delivery ManagementModernize ApplicationPerformance Testing
Table of ContentspageThe Age of Complexity. . . . . . . . . . . . . . . . . . . . . . . . . . . . . . . . . . . . . . . . . . . . . . . . . . . . . . . . . . . . . . . . . 1Breathe New Life into Application Performance Testing. . . . . . . . . . . . . . . . . . . . . . . . . . . . . . . 1Continuous Performance Testing: How to Make It Happen. . . . . . . . . . . . . . . . . . . . . . . . . . . 2Do You do DevOps?. . . . . . . . . . . . . . . . . . . . . . . . . . . . . . . . . . . . . . . . . . . . . . . . . . . . . . . . . . . . . . . . . . . . 4Testing New Technologies. . . . . . . . . . . . . . . . . . . . . . . . . . . . . . . . . . . . . . . . . . . . . . . . . . . . . . . . . . . . . . 6Rely On Open Source and Collaboration. . . . . . . . . . . . . . . . . . . . . . . . . . . . . . . . . . . . . . . . . . . . . . . 8Use Tools That Reduce Complexity. . . . . . . . . . . . . . . . . . . . . . . . . . . . . . . . . . . . . . . . . . . . . . . . . . . . 9Why You Need Software Lifecycle Virtualization. . . . . . . . . . . . . . . . . . . . . . . . . . . . . . . . . . . . . 11Find the Right Application Testing Platform. . . . . . . . . . . . . . . . . . . . . . . . . . . . . . . . . . . . . . . . . . 14
We are seeing a seismicshift in how software isdelivered. The increasingcomplexity from newsoftware architectures andnew platforms is simply toomuch for delivery teamsto manage. Systems areincreasingly software-reliantand interconnected—making design, analysis,and evaluation harderthan ever before.The Age of ComplexitySoftware evolution is a fact of life. Application architectures and platforms are rapidly evolving. Along withweb and mobile, software is becoming fully meshed into the fabric of daily life through the Internet of Things(IoT). This evolution has powered previously unthinkable innovations: for example, cell phones and wearables are now interconnected, and you can monitor your doorbell from a beach thousands of miles away.We are seeing a seismic shift in how software is delivered. The increasing complexity from new softwarearchitectures and new platforms is simply too much for delivery teams to manage. Systems are increasinglysoftware-reliant and interconnected—making design, analysis, and evaluation harder than ever before.While new capabilities are welcome, they require more thorough validation to verify that they function asexpected. Complexity means that undetected design flaws or defects may lead to hazardous conditionsthat go undiscovered and unresolved.Delivery teams today wrestle with apps built with: Shared services and APIs Widespread use of open-source code and tools Different protocols for IoT and mobile application deliveryThese teams need smarter testing solutions that cut through the noise. Typical testing labs simply can’tkeep pace with the proliferation of application and device types. With multiple browser variations and thegrowing diversity of mobile operating systems (and versions), plus the anticipated surge in IoT, no testeror physical test lab can keep up with ever-increasing user expectations in the face of accelerating releasecycles, mushrooming IT complexity, and massive scalability requirements. Throw in new initiatives such asdigital transformation, the transition to Agile methods, incorporation of Big Data and predictive analytics,and exploration of the Internet of Things (IoT)—and complexity increases exponentially.Breathe New Life into ApplicationPerformance TestingWe believe that an application-performance testing platform ready for this challenge needs the followingcapabilities: Easy integration with multiple tools/technologies and support for open APIs: Your testingplatform should integrate and enhance the value of widely used open-source development, testing,and DevOps tools, making it easy to combine with continuous integration (CI) and continuousdeployment (CD) frameworks such as Jenkins. Developers should also be able to use opensource scripting tools such as JMeter, and the Git version control system for managing scripts.www.microfocus.com1
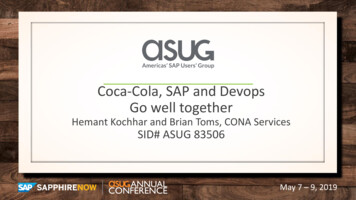
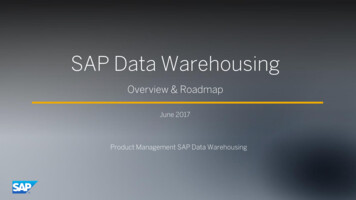
White PaperModernize Application Performance Testing A plan for handling diverse network conditions: Application performance and the user experienceare affected by network latency. Excessive network latency and/or packet loss don’t just makeyour app respond slower, they can cause the app to behave erratically or even fail outright. Yourtesting platform should be able to handle complex and demanding network conditions. Focus on the end-user experience: Your performance testing platform should help youfocus on load times and intuitive flows, while keeping the user’s perspective in mind. Thereare many ways to improve perceived load times compared to actual load times, such asoptimizing image sizes and rendering certain content to appear first, such as the top ofa page. These sorts of optimizations can make it appear that a site is loading quickly. Ability to use production analytics: Testers always have more tests than time.Production analytics solve this by providing views into how apps are actually beingused in the wild to focus testing. Your testing platform should enable you to useproduction analytics to gain insights into the real usage of your applications.This white paper explores the above challenges and analyzes how testers must change their methodologies to keep pace with technology and user expectations. It also provides a detailed overview of thelatest features of Micro Focus LoadRunner and Performance Center software—the industry-leadingperformance validation tools.Continuous Performance Testing:How to Make It HappenWithout question, continuous performance testing is critical to the success of your apps. If you don’ttest until the end of the cycle, you risk production issues, user complaints, poor reviews, and damage toyour brand. So in Agile/DevOps environments, performance testing must be integrated with the wholedevelopment process.Agile testingmethodologyPerformancetrend andbaselineFigure 1. Continuous testing leads to early detection of issues2Early detectionof performanceissues
When executing aperformance-testingscenario as part ofcontinuous integration andcontinuous testing process,the most important thingis to get a clear “pass/fail”indication of whether theapplication’s performancehas been hit as a resultof recent changes inthe code. You need thisinformation without doingany data processing, justreferring to the servicelevel agreements (SLAs).Continuous testing means running tests at each stage in the pipeline, giving the team feedback to improvequality and increase their velocity. Tests are triggered automatically by events such as code check-in. Thefaster defects are found, the faster they can be addressed. Continuous testing doesn’t happen by itself.Instead, it requires a significant shift for development teams to succeed.LoadRunner and Performance Center continue to introduce new features and integrations to incorporateload and performance testing into continuous integration and continuous testing practices.Unit Tests Execution with LoadRunnerWhen executing a performance-testing scenario as part of continuous integration and continuous testing process, the most important thing is to get a clear “pass/fail” indication of whether the application’sperformance has been hit as a result of recent changes in the code. You need this information withoutdoing any data processing, just referring to the service-level agreements (SLAs).In a few simple steps, you can protect your application from performance regressions: Create Vuser Scripts or LoadRunner Tests in Visual Studio or Eclipse:To support deep and effective integration of unit or functional tests,LoadRunner provides add-ins for Microsoft Visual Studio and Eclipse. Add LoadRunner APIs to unit tests in Visual Studio or Eclipse: Extending your test with all thepower of LoadRunner’s infrastructure is as easy as clicking on “Add LoadRunner API reference” in the“DevOps Vuser” menu. This is created when you install the add-in. After this simple action, you canuse LoadRunner functionality such as transactions, messaging, think time, and so on in your code. Execute unit tests using the LoadRunner Engine: To support the execution of unit testsas part of LoadRunner load test scenarios, the LoadRunner Controller has the abilityto open not only LoadRunner scripts but also system or unit tests. You can continuewith scenario creation just as you did before with regular LoadRunner scripts.Jenkins IntegrationThe Application Automation Tools plugin for the Jenkins continuous integration server provides a mecha-nism for executing LoadRunner Controller scenarios as part of a build script. This plugin allows you totrigger a test as a build step and present the results in the Jenkin’s user interface. You can only integratescenarios that have service level agreements (SLAs). This allows you to quickly determine whether thetest passed or failed and if performance was affected.Performance Center also features strengthened integration with Jenkins. For example, trending informa-tion (which allows you to compare performance test run data over time) can now be viewed directly withinJenkins, giving you the metrics you need sooner, without logging on to Performance Center.www.microfocus.com3
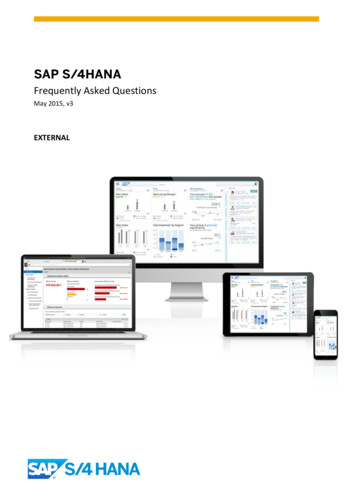
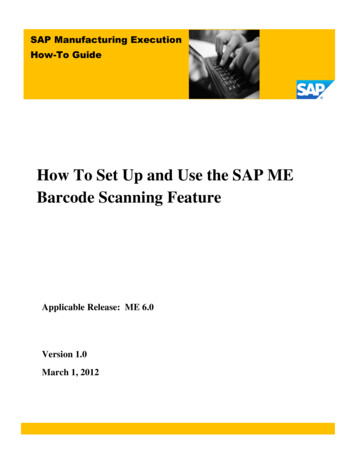
White PaperModernize Application Performance TestingDevOps attempts to removeartificial impedimentsto software delivery andempowers the deliveryteam to be responsibleand accountable for thesoftware they build and ship.Figure 2. Integration with JenkinsDo You do DevOps?Today’s organizations are increasingly adopting a DevOps approach, bringing the development team andthe operations team closer together to build high-quality software that can be released to production atany time. This approach succeeds only by keeping the source code free of defects—detecting problemsas soon as they are introduced so that they can be weeded out before they get close to the customer.DevOps attempts to remove artificial impediments to software delivery and empowers the delivery teamto be responsible and accountable for the software they build and ship.Performance Application Lifecycle (PAL)As performance engineers, we need to design a scenario that simulates real-user loads. So why don’t weuse information provided by the production environment? Feedback and measurement from productionis a good way to improve continuous assessment. For example, real users never use many features andfunctions, so maybe you don’t need to design a test to cover it. In most cases, developers don’t have theend-to-end visibility that they need, and often they turn to IT admins in search of relevant metrics anddata—but the result is generally inadequate.Performance Application Lifecycle (PAL) in Performance Center enables you to share performance information between development and operations to better plan your performance tests and applicationdeployment. PAL allows for complete end-to-end testing and DevOps feedback.Users can accurately compare performance test results with real production data benchmarks. Analysisof these results provides a framework to assist you in creating performance test scenarios that resemblerealistic environments as closely as possible. PAL enables you to use user traffic and system monitoringdata in production to design a performance test that closely resembles production behavior. You canimport production data from Microsoft IIS W3C Extended Log Format (IIS W3C), Apache, and Real UserMonitor (RUM).4
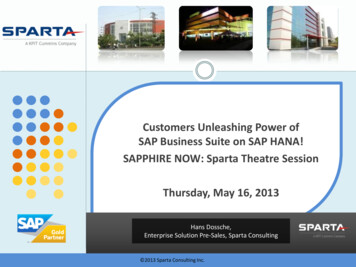
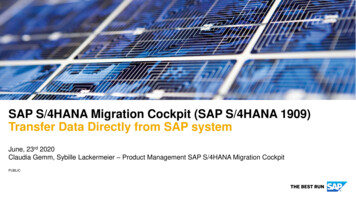
To meet this goal, yourmonitoring toolset shouldinclude capabilities formonitoring the real-userexperience, so you knowwhat’s actually happeningin the world of end users.The PAL flow includes the following main steps:Figure 3. PAL Steps1.Import: Import a data set from a production system. Different production monitoring systems2.Create: After uploading your data set to Performance Center, it analyzes the data and creates3.Run: Run your performance test.4.provide different data that may influence which information is available to the user.a PAL scenario with business flows. You can translate each business flow into a script.Compare: Compare performance test results with your productiondata. If necessary, re-adjust and re-run your test.Application Performance Management (APM) IntegrationWhen applications go into production, the path to high performance on an ongoing basis lies in the aggressive monitoring of the applications and the end-user experience, followed by the process of feedingperformance data back to your development teams. This proactive work is one of the keys to avoidingemerging performance issues with production applications. Throughout the monitoring process, the goalis to fully understand the end-user experience and rapidly diagnose any performance issues. To meet thisgoal, your monitoring toolset should include capabilities for monitoring the real-user experience, so youknow what’s actually happening in the world of end users.APM tools are used to monitoring and manage of performance and availability of software applications byreporting mainly the following metrics: End user experience (response time, for example) Server performance (CPU, memory, server response time, code hotspots, exceptions, and so on)LoadRunner and/or Performance Center will generate load, while the APM tools will mostly monitor serverbehavior. By using them in conjunction, teams can better identify performance drawbacks before actualusers find them. The adoption of APM tools provides DevOps benefits, such as: Fast feedback between development and operations Increased application resilience from early, proactive monitoring Lower operations costs Decreased time firefighting production issueswww.microfocus.com5
White PaperModernize Application Performance TestingPerformance Center REST APIRelying on an open API-driven integration layer is crucial for a DevOps team because it integrates andenhances the value of widely used open-source development, test and DevOps tools, through integrateddata, task and workflow. When it comes to designing web APIs, no other style is more popular than REST.REST (REpresentational State Transfer) has become the standard de-facto for designing powerful APIsthat run over HTTP. The Performance Center REST API enables you to write applications to create andrun load tests without using the Performance Center user interface. Performance Center 12.55 includesREST API functionality for: Get list of runs—cross projects Delete runs—cross projects Get runs statistics Define SLA And many moreTesting New TechnologiesHow do you make continuous performance and load testing practical in an age of accelerating develop-ment cycles and ever-increasing user expectations? For application teams, the mentality must changefrom simple “record/playback” testing that occurs late in the product cycle to a more robust engineeringapproach that starts early in the cycle and occurs continuously.Protocol-Level ScriptingNew technologies are emerging daily and are changing the way people and business customers con-sume content, so we continue working to align protocols to these latest technologies. LoadRunner andPerformance Center software now support HTTP/2, the latest version of the HTTP network protocol usedby the web. The goal of designing HTTP/2 was to create a faster network protocol while preserving theHTTP methods format. Tests show that web pages are loaded two to four times faster when they areserved with HTTP/2.Since websites are offering more media streaming than ever before, LoadRunner and Performance Centerbring full support for audio and video streaming testing (HTML5 and HLS). This enables new capabilitiesfor recording and replaying web HTTP/HTML and mobile scripts as well as new streaming metrics to helpidentify potential performance bottlenecks.Because LoadRunner and Performance Center support more than 50 technologies and platform, youcan easily test a huge range of applications including web, mobile, Ajax, Flex, HTML5, .NET, Java, GWT,Silverlight, SOAP, Citrix, ERP and more. LoadRunner supports the latest application technologies as wellas legacy ones.6New technologies areemerging daily and arechanging the way peopleand business customersconsume content, so wecontinue working to alignprotocols to these latesttechnologies. LoadRunnerand Performance Centersoftware now supportHTTP/2, the latest versionof the HTTP networkprotocol used by the web.
UI-Level ScriptingThe complexity of new technologies, the lack of commonly recognized and accepted standards, andthe sheer multitude of emerging frameworks and toolkits make it difficult for companies to build Web 2.0testing strategies and select appropriate automation solutions. TruClient, introduced in version 11.00, isan innovative, browser-based virtual user generator (VuGen) that supports simple Web as well as modernJavaScript-based applications. TruClient Coded (technical preview) is the new functionality introduced inversion 12.55 to convert TruClient scripts in code. It makes it easy to code load testing into your mobileand web apps, so testing can occur earlier, more often, and with much less effort over the entire development lifecycle.Benefits: Ability to create complex scripts Faster-processing user interface Flexibility: DevOps and Agile teams can test their way, using their familiar tools, on their schedule Less memory consumptionFigure 4. TruClient Codedwww.microfocus.com7
White PaperModernize Application Performance TestingInnovations We’re Delivering: IoT ReadyThe Internet of Things is an ecosystem where objects are connected together to exchange data. Thesystem’s complexity doesn’t matter. The important aspect is that an object is identified by its capabilityto connect to the network and exchange information.MQTT (MQ Telemetry Transport) protocol is a Machine to Machine (M2M) message-based protocol widelyused in Internet of things. It is extremely lightweight and for this reason, it is adopted across the IoT ecosystem. The protocol uses a publish-subscriber paradigm in contrast to HTTP based on request/responseparadigm. It uses binary messages to exchange information with a low overhead.For these reasons, we’ve implemented a new MQTT protocol in LR/PC 12.55. When using this new pro-tocol, a user can emulate MQTT clients (sensors, actuators, switches and so on) and design and executeperformance testing.Figure 5. MQTT protocolRely On Open Source and CollaborationDevOps teams depend on robust communication and collaboration to avoid introducing technical debt.Sharing and communication are crucial if a team is attempting to accelerate delivery and improve qualitythrough continuous testing. Teams need awareness of issues and status changes in order to work in con-cert—as opposed to creating rework and overhead for each other. This is especially true as each memberof the team plays their specific role and works toward the overall goal.8The Internet of Things is anecosystem where objectsare connected togetherto exchange data. Thesystem’s complexity doesn’tmatter. The importantaspect is that an object isidentified by its capabilityto connect to the networkand exchange information.
One of the most importantimprovements to supportthe collaboration betweenAgile teams is the VuGenintegration with Git. One ofthe leading source controlmanagement solutions.Git Integration: Improved Team Collaboration for Agile TeamsOne of the most important improvements to support the collaboration between Agile teams is the VuGenintegration with Git. One of the leading source control management solutions. Git is a version control sys-tem that is used for software development and other version control tasks. As a distributed revision controlsystem, it is aimed at speed, data integrity, and support for distributed, non-linear workflows.VuGen integrates with Git Hub, allowing you to upload scripts from a Git repository and perform commonactions such as Pull, Push and Track. You can also view history and manage your changes.JMeter scripting tool support (Beta)Starting with version 12.55, you can run your JMeter scripts in LoadRunner and Performance Center andintegrate JMeter with additional script types in any performance test. This means DevOps teams can easilyupload existing scripts created with a familiar tool (and obviously save time).Figure 6. JMeter scriptingUse Tools That Reduce ComplexityOur testing and operational environments are becoming increasingly complicated. Tools can help movepast this complexity and perform root cause analysis quicker. Anomaly detection is key to identifyinganomalies and performance problems, as well as finding root causes using real-time metrics.www.microfocus.com9
White PaperModernize Application Performance TestingQuickly Isolate ProblemsAnomaly detection enables you to quickly, intuitively, and effectively identify abnormal application behav-ior in performance tests. With version 12.55, you can now use anomaly detection built into PerformanceCenter to accomplish those tasks. Engineers can use insights derived from the anomaly detection tospeed their diagnosis and investigation into system performance—and even see the precise triggersthat caused the anomalies.Figure 7. Anomaly detectionDiagnose Design ProblemsWhile browsing a customer app in a web browser, there are occasionally requests to servers that the userdoesn’t necessarily like to include in the script, such as Google statistics, ads, third-party data, and so on.In LoadRunner and Performance Center version 12.55, VuGen introduces the new Recording SummaryReport, which allows the user to: View general information on the recording session View detailed information on hosts, content types, and headers Conveniently manage traffic filtering (available in the Recording Options)Information shown in the report allows the user to potentially make decisions regarding application design,by observing the number of requests, size of data sent and received, type of data, and so on.10Anomaly detection enablesyou to quickly, intuitively, andeffectively identify abnormalapplication behavior inperformance tests. Withversion 12.55, you can nowuse anomaly detection builtinto Performance Center toaccomplish those tasks.
Virtualization is critical toan organization’s ability toconfigure and test againstmany likely issues thatcustomers will encounterduring the course of anapplication’s lifecycle. Theadvantage of virtualizationlies in constructing acomplete environment thatencompasses development,testing and operations,virtual services, virtualnetworks, and virtual data.Figure 8. Recording Summary ReportThis feature can help with troubleshooting issues (for example related to correlations found and replaced),leaving you the time to customize your scripts more efficiently. In addition, using the report makes removingthese unwanted requests from the script much easier and faster.Why You Need Software Lifecycle VirtualizationVirtualization is critical to an organization’s ability to configure and test against many likely issues thatcustomers will encounter during the course of an application’s lifecycle. The advantage of virtualization liesin constructing a complete environment that encompasses development, testing and operations, virtualservices, virtual networks, and virtual data.If you can use network and service virtualization in your app development process, you will be more efficientand cost-effective, which means you will have a better chance at achieving key: beating the competition,reducing production incidents, and lowering costs.We build in Service and Network Virtualization for continuous development and testing across teams evenwhen services are not ready yet or constrained and where global network behavior creates obstacles toquality and performance.www.microfocus.com11
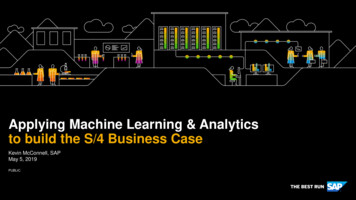
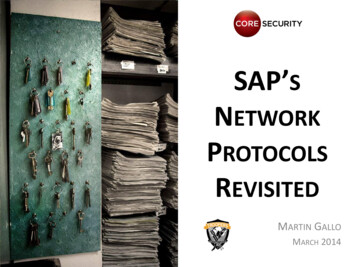
White PaperModernize Application Performance TestingService Virtualization IntegrationOften, an application under test depends on services such as API calls to other systems, whether externalor internal. Because the development and testing teams don’t control these outside services, the teamsbecome dependent on availability of services to complete testing. There are many testing scenarioswhere a tester expects repeatable and reliable responses from a given service, but without control, thiscan be a challenge.Simply said, external services can quickly become major bottlenecks for development and testing teams.To overcome this constraint, development teams can simulate or virtualize services so they can reducedependencies and regain control. This allows them to test as much as they want—particularly load testing—without fear of affecting the performance of the real services.To facilitate performance testing of business processes that contain services that are not available,LoadRunner and Performance Center integrate with Service Virtualization. This enables your team to testan application’s interaction with a variety of unique conditions, such as how the system behaves if a service is offline, or if it takes a long time to respond, or if its response is not what was expected (for example,an exception). Service Virtualization gives teams flexibility and complete control over test environments.Network Virtualization IntegrationAny application that relies on a network must be able to react and provide feedback to the user, even whenthe network is slow, erratic, or even unavailable. Network conditions, such as latency, bandwidth, packetloss, and jitter, must be taken into account when developing and testing software.6050Seconds4031.828.13021.319.22010Local in NYLondon to NYTokyo to NY5.10.2 0.5 0.70.50LaunchManage Policy Sign in AttemptFigure 9. Network Impact on user experience—remote locationsNetwork Virtualization (NV) is designed to enable precise network performance testing scenarios thatdeliver highly accurate and reliable performance results. Effective insights and analysis of those resultsare critical to bringing meaningful and cost-effective application or infrastructure changes.12Any application that relies ona network must be able toreact and provide feedbackto the user, even when thenetwork is slow, erratic, oreven unavailable. Networkconditions, such as latency,bandwidth, packet loss, andjitter, must be taken intoaccount when developingand testing software.
Application testing andquality assurance havenever been so crucial. Yourplatform should keep pacewith ever-increasing userexpectations, acceleratingrelease cycles, growing ITcomplexity, and massivescalability requirements.To achieve superior application performance even in adverse network conditions, Network Virtualizationis fully integrated with LoadRunner and Performance Center to simulate the application’s behavior underdifferent network characteristics.The NV Insights Report is a comprehensive network analysis report that provides information about howyour application performs over various networks, during a scenario run. It can help to pinpoint root causesfor performance issues, and provide optimization recommendations to resolve the issues, thereby improving the performance of your application.With the Client side breakdown report, teams can view statistics that help you measure the quality of theuser experience on your application.Figure 10. Client-side breakdown reportNetwork Virtualization receives the time of the events (Start render, DOM loaded, Page loaded), allowingthe user to inspect events in the client as they correlate to network calls.Find the Right Application Testing PlatformApplication testing and quality assurance have never been so crucial. Your platform should keep pacewith ever-increasing user expectations, accelerating release cycles, growing IT complexity, and massivescalability requirements.Take a closer look at the new capabilities built into LoadRunner and Performance Center 12.55 to build,test, and deliver your applications with breakthrough speed and quality. Talk with your local representativeto explore what your organization can achieve with version 12.55.Learn More performancecenterwww.microfocus.com13
Additional contact information and office 000020-002 3502 H 10/18 2018 Micro Focus or one of its affiliates. Micro Focus and the Micro Focus logo, among others, are trademarks orregistered trademarks of Micro Focus or its subsidiaries or affiliated companies in the United Kingdom, United States and other countries. All other marks arethe property of their respective owners.
web and mobile, software is becoming fully meshed into the fabric of daily life through the Internet of Things . load and performance testing into continuous integration and continuous testing practices . Unit Tests Execution with LoadRunner . Server performance (CPU, memory, server response time, code hotspots, exceptions, and so on)