Transcription
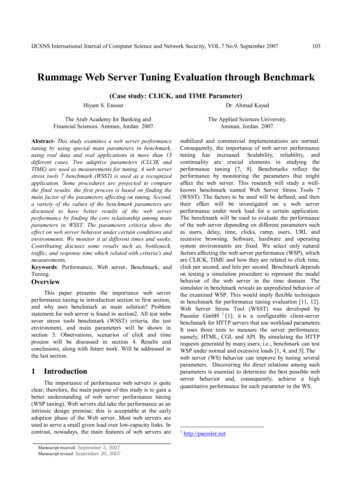
PERFORMANCE ANALYSIS OF WEB SERVERSApache and Microsoft IISAndrew J. Kornecki, Nick BrixiusEmbry Riddle Aeronautical University, Daytona Beach, FL 32114Email: kornecka@erau.edu, brixiusn@erau.eduOzeas Vieira Santana FilhoSenac University Center, Sao Paulo, Brasil, CEP 01222-903Email: ozeas@sp.senac.brKeywords:Internet Services, Web Servers, Performance AnalysisAbstract:The Internet has become the leading means for people to get information and interact betweenorganizations. Each year there is an increase of the numbers of Internet users. Organizations must be awareof the performance of their web servers to be able to accommodate this growing demand. Networks,connections, hardware, web servers and operating systems each have a role to play in this market, but theweb server could be a bottleneck for the entire system. The goal of this research paper is to discuss theissues related to the performance analysis of web servers. The focus is on measurement technique as asolution to performance analysis. Also, the paper describes a practical method to compare two web servers.1 INTRODUCTIONThe World-Wide Web is one of the most usedservices of the Internet. Basically, the World-WideWeb is a client/server system that integrates diversetypes of information on the global Internet and/orenterprise networks. Clients and servers on the Webcommunicate using the HyperText Transfer Protocol(HTTP), which is layered on the TCP/IP protocol. Inthis client/server system, the client is a WebBrowser, such as Internet Explorer or any softwarethat can make a HTTP request for a HTML(HyperText Markup Language) file and is able toshow it graphically to the user. The Web Serversoftware manages all the web server site files andresponds to all requests made by web browsers.Figure 1 shows a simplified one to oneclient/server environment for HTTP communication.In the real Internet, the connections are n-to-n, andservers can connect to other servers using Webservices protocols. Also clients can connect directlywith others clients, as a peer-to-peer network, toexchange files or for other types of datacommunication. Figure 1, however, represents theclient/server HTTP communication, that it is thefocus of this study.Most studies of Web server performance consideronly static Web content. A dedicated tool, httperf,for measuring HTTP performance and generatingthe client workload, was presented in (Titchkosky,2003). That paper compared performance of variousweb servers. However, the Internet InformationServer, one of the most used in the market, was notpart of the testing suite. Several other papers(Prefect, 1996), (Banga, 1999), (Hu, 1999),(Barford, 2001) discuss measurement of web Corporation (SPEC) is a non-profit corporationformed to establish, maintain and endorse astandardized set of relevant website benchmarks(SPECweb99, 1999). There are a great number ofresults using these benchmarks that can be accessedon SPEC site (www.spec.org).The objective of this project is to compare theperformance of two widely used web serversavailable on the market. The specific goal of theexperiment is to compare performance of twosystems using the same platform, hardware andoperating system. The component under study is theweb server: either Apache Web Server or theMicrosoft Internet Information Server. Data will becollected, and statistics and performance analysistechniques will be used to create this report.293
WEBIST 2005 - WEB INTERFACES AND APPLICATIONSFigure 1: Simplified Client/Server of HTTP communication.2 TEST ENVIRONMENTThe system under test (SUT) consists of the WebServer and Web Browser. Two other componentsplaying roles in the experiment are the operatingsystem and the software that will collect the metrics.Since the tool selected to get the metrics also playsthe role of a client through making requests to theserver, a Web Browser is not necessary in the test.The operating system is Windows 2003 EnterpriseServer, which was the latest release from theMicrosoft at the time of the experiment.To assure that the SUT will not interfere with anyother software installed, and also to provide morecontrolled environment, the Microsoft Virtual PChas been used to create a virtual machine to run thetests. Due to comparative nature of the study thedescription of hardware environment is not critical.For the record, the experiment was run on aconventional computer (Pentium IV, 2.4Ghz,768MB, Windows XP SP1 and 60GB hard disk).The Microsoft Virtual PC runs: (a) the MicrosoftWindows 2003 Server, (b) the Webbench,performance web tool for collecting data, and one ofthe Web Servers at a time: either (c1) MicrosoftInternet Information Server 6.0 or the (c2) ApacheHTTP Server Version 2.0.51.The next sections describe the components of theSUT.2.1 Apache HTTP Server V.2.0.51The Apache project is an effort to develop andmaintain an open-source HTTP server for variousmodern desktop and server operating systems, suchas UNIX and Windows. The goal of this project is toprovide a secure, efficient and extensible serverwhich provides HTTP services in synchronizationwith the current HTTP standards. Apache isavailable at http://httpd.apache.org/294Apache has been the most popular web server onthe Internet since April of 1996. The Netcraft WebServer Survey of October 2004 found that more than67% of the web sites on the Internet are usingApache, thus making it more widely used than allother web servers combined. The Microsoft IISholds over 21% of the web server market share.2.2 Microsoft Internet InformationServer 6.0Internet Information Services (IIS) is a part of theMicrosoft Windows Server 2003 family andattempts to provide an integrated, reliable, scalable,secure, and manageable Web server. The IIS is atool for creating a communications platform ofdynamic network applications. IIS 6.0 leverages thelatest Web standards like Microsoft ASP.NET,XML, and Simple Object Access Protocol (SOAP)for the development, implementation, andmanagement of Web applications. IIS 6.0 includesnew features designed to help Web administratorsimprove performance, reliability, scalability, andsecurity either on a single IIS server or on multipleservers.The IIS 6.0 is integrated with the Windows 2003Server Family. Windows Server 2003 includesfunctionality customers may need today from aWindows server operating system, such as security,reliability, availability, and scalability. In addition,Microsoft has improved and extended the WindowsServer operating system to incorporate the benefitsof Microsoft .NET for connecting information,people, systems, and devices. The Microsoft Windows Server is a retail Microsoft product.2.3 Microsoft Virtual PC 2004The focus of the study was to compare performanceof selected servers rather than assess specific
PERFORMANCE ANALYSIS OF WEB SERVERS: Apache and Microsoft IISFigure 2: Table with detailed information about the 2k experimental design.performance of each. Virtual environments impacteach server in the same way and are thus appropriatefor this comparison. With Microsoft Virtual PC2004, it is possible to create one or more virtualmachines, each running its own operating system, ona single physical computer. The virtual machineemulates a standard x86-based computer, includingall the basic hardware components except theprocessor. By using emulated hardware and theprocessor in the physical computer, each virtualmachine works like a separate physical computer.Because each virtual machine has its own operatingsystem, it is possible to run several differentoperating systems at the same time on a singlecomputer. The Microsoft Virtual PC 2004 is aretail Microsoft product.send requests to the server for static files placed onthe server or for a combination of static files anddynamic executables that run producing the data theserver returns to the client. During WebBench's testsuite execution, the clients issue a combination ofrequests for static and dynamic data. These clientssimulate Web browsers. When the server replies to aclient request, the client records information, such ashow long the server took and how much data itreturned, and then sends a new request. When thetest ends, WebBench calculates two overall serverscores (number of requests per second andthroughput in bytes per second) as well as individualclient scores. The user can view all these resultsfrom the WebBench controller.The link to the WebBench Web site ishttp://www.veritest.com/benchmarks/ .2.4 WebBench 5.0There are a number of Web server benchmarkingprograms available that can be used to obtainperformance metrics. They differ in their ability tobe configured by the user running the tests. Someare very flexible, such as the Webbench, Webstone,webmonitor or httperf (Almeida, 1997), (Mosberger,1998), (Nahum, 1999), and others are less flexible,such as the SPECweb99 that does not even allow theanalyst to change the workload, as it is predefined inthe standard (SPECweb99, 1999).The WebBench tool, a licensed PC Magazinebenchmark program developed by Veritest, has beenused to collect the data. WebBench uses clients to3 EXPERIMENTIn this project, the web servers were rated by thesemetrics: Requests per Second: the total number ofsuccessful requests divided by the amount of timein seconds that it took for the requests tocomplete. Throughput: how many bytes per second theserver is providing to the clients.It is necessary to identify factors that have an impacton the performance of web servers. Each factor can295
WEBIST 2005 - WEB INTERFACES AND APPLICATIONSApache Server - Overall WebBench Requests/Second80000,000Requests / 020000,00010000,0001TSta1T tic1Sta1T tic21 T S tatiDyn c31T a mDiyn c11T a micD2ynam2T i c 3Sta2T tic1Sta2T tic22 T S tatiDyn c32T a miDyn c12T a miDyn c2am4T i c 3Sta4T tic1Sta4T tic2S4 T tatiDyn c34T a miDyn c14T a miDyn c2am8T i c 3Sta8T tic1Sta8T tic28 T S tatiDyn c38T a miDyn c18T a miDyn c2a16 micTS 3t16 aticTS 1t16 atic216 TStTD atiyn c316aTD mic116 ynaTD miyn c2a32 miTS c3t32 aticTS 1t32 atic232 TStTD atiyn c332aTD mic132 ynaTD miyn c2amic30,000Mix NameInternet Information Server - Overall WebBench Requests/Second160000,000Requests / ,00040000,00020000,0001TSta1T tic1Sta1T tic2S1T taD tic3yn1T amiDyn c11T amiDyn c2am2T ic3Sta2T tic1Sta2T tic2S2T taD tic3yn2T amiDyn c12T amiDyn c2am4T ic3Sta4T tic1Sta4T tic2S4T taD tic3yn4T amiDyn c14T amiDyn c2am8T ic3Sta8T tic1Stat8T ic2S8T taD tic3yn8T amiDyn c18T amiDyn c2a16 micTS 3t16 aticTS 1t16 atic2T16 StTD atiyn c316aTD mic1y16 naTD miyn c2a32 micTS 3t32 aticTS 1t32 atic2T32 StTD atiyn c332aTD mic1y32 naTD miyn c2amic30,000Mix NameFigure 3: Request/Second for Apache and IIS experiments.assume multiple values, thus having multiple levels.Four factors were selected to run a 2k factorialexperiment. The objective was to assess the factorsand identify the important ones for doing thecomparison of two web servers. The four factors are: Quantity of Memory of the system undertest (128 or 256 MB). Number of Clients (Threads) that will makethe requests to the Web Server (1 or 10) Receive Buffer Size (4096 or 8192 bytes) Workload (Static or Dynamic)The last factor represents what is considered to bethe system workload. While running a Web serverthere are two types of workload: Static Web site: Requests for static HTMLpages that contain only html commands andgraphic files. Typically, this load has a lowimpact on Web server components. Onlyrequests for very large files are disk andnetwork intensive. Dynamic Web site: Requests for HTMLpages where the content is dynamicallygenerated on the server and can have backend server interactions. Typically, theserequests are CPU and/or disk intensive.296It is possible to modify or create the workload totailor it to be more realistic and resemble a specificsystem. But here the tools were used to generategeneral workload that simulates the typical scenarioof web requests.The WebBench allows the analyst to change thepercentages of each type of request. Also, thedynamic workload is composed of a percentage ofCGI calls and the remaining requests are static.The experimental design was used to reduce theamount of effort necessary to collect all the data(Lilja, 2000). The n2m fractional factorial design wasused to find the dominant factors that have the mostimpact in the performance (necessary to reduce thenumber of experiments). Experiments wereperformed for each Web Server to get the metrics:requests per second and throughput. The mean,standard deviation and confidence interval of theresulting experiments were calculated. And finally,the metrics were compared for the two alternatives.The above identified steps, factors and workloadconstituted a base for the 24 experimental designs.The four factors, with their respective two levelswere:A Buffer Size (4096 or 8192)B Workload (Static or Dynamic)C Number of threads / Clients (1 or 2)
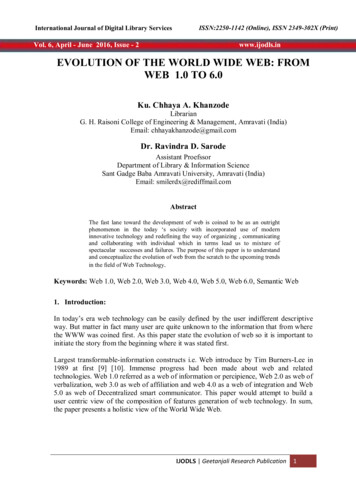
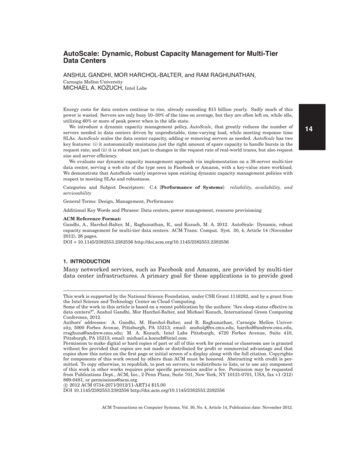
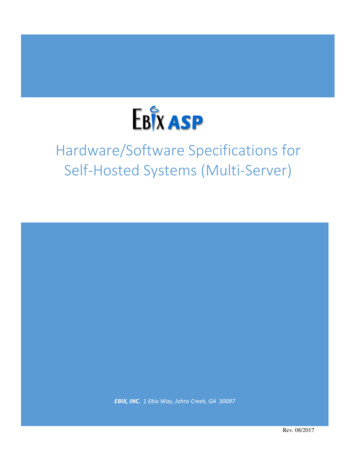
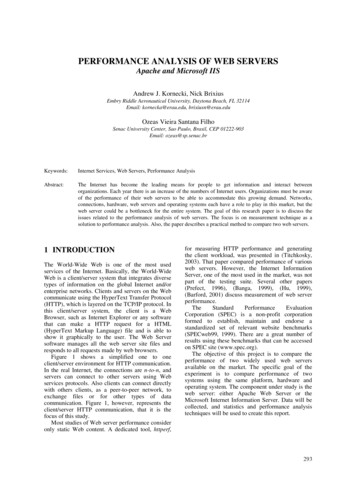
PERFORMANCE ANALYSIS OF WEB SERVERS: Apache and Microsoft IISD Memory (128 or 256 MB)The reason for using relatively low memory valueswas to stress the web server. For instance, there is noimpact on performance of 500MB server whilerunning it with 2 or 4 GB of memory. Each of the 16experiments was run for two minutes with datacollected by WebBench. The computed effects ofeach factor were:o Buffer: 1 %o Workload: 18%o Number of Clients: 75.5%o Memory: 2.5%The effects of factor interactions were very low,all less than 1%, except the interaction of Workloadand Number of Clients, which was 1.5%. Forexample, a table with detailed information on one ofthe metrics of the 2k experimental design is shown inFigure 2.The above results led to using only the Workloadand Number of Clients factors to do the detailedexperiments and to compare the Web Servers.Twelve experiments were conducted using thecombinations of the two levels of Workload factor(Static, Dynamic) and six levels for Clients factor (1,2, 4, 8, 16, and 32). Each experiment was repeatedthree times. The total of 36 suites of experimentswere run for 30 seconds for each server inWebBench. The measurements of requests persecond and throughput for each server were used forcomparison. Figures 3 and 4 show the results.From the corresponding measurements made onthe two servers, a confidence interval for the meanof the individual differences was constructed. If theconfidence interval for the differences does notinclude zero, then the sign of the mean differenceindicates which system is better. If the confidenceinterval includes zero, the difference is notsignificant (Lilja, 2000). The results are shownbelow.For the difference of Request per Second metric: Difference Mean: 29,559.7 Difference Standard Deviation: 25,011.9 95% confidence interval for meandifference is (22,702.3, 36,417.1).For the differences of Throughput metric: Difference Mean: 168,639,315.1 Difference Standard Deviation:140,193,508.1 95% confidence interval for meandifference of is (130,202,929.1,207,075,701.1).The 95% confidence interval for mean differenceof both metrics does not include zero. Based on thisanalysis, IIS has significantly higher performanceApache Server - Overall WebBench Throughput (Bytes/Second)Throughput (Bytes / 0000000,000100000000,00050000000,0001TSta1T tic 1Sta1T tic 21T StaD tic 3y1T na mDyn ic 11T a mDiyn c 2am2T icSt 3a2T tic 1Sta2T tic 22T StaD tic 3y2T na mDyn ic 12T a miDyn c 2am4T ic 3Sta4T tic 1Sta4T tic 24T StaD ticyn 34T a mDiy c14T na mDyn ic 2am8T ic 3Sta8T tic 1Stat8T ic 28T StaD ticyn 38T a mDiy c18T na mDyn ic 2a16 micTS 3t16 aticTS 116 tatic16 TSt 2TD atic16 yn a 3TD mic16 yn a 1TD miyn c2a32 miTS c3t32 aticTS 132 tatic32 TSt 2TD atic32 yn a 3TD mic1y32 n aTD miyn c2amic30,000Mix NameInternet Information Server - Overall WebBench Throughput 0,000100000000,0000,0001TSta1T tic 1Sta1T tic 21T StaD tic 3y1T na mDyn ic 11T a mDiyn c 2am2T icSt 3a2T tic 1Sta2T tic 22T StaD tic 3y2T na mDyn ic 12T a miDyn c 2am4T ic 3Sta4T tic 1Sta4T tic 24T StaD ticyn 34T a mDiy c14T na mDyn ic 2am8T ic 3Sta8T tic 1Stat8T ic 28T StaD ticyn 38T a mDiy c18T na mDyn ic 2a16 micTS 3t16 aticTS 116 tatic16 TSt 2TD atic16 yn a 3TD mic16 yn a 1TD miyn c2a32 miTS c3t32 aticTS 132 tatic32 TSt 2TD atic32 yn a 3TD mic32 yn a 1TD miyn c2amic3Throughput (Bytes / Second)900000000,000Mix NameFigure 4: Throughput for Apache and IIS experiments.297
WEBIST 2005 - WEB INTERFACES AND APPLICATIONSmetrics than Apache Server.The result of this analysis was expected, giveninspection of the experimental results. Reviewingthe results of individual runs, one can see that the IIShas higher values of the measured metrics than theApache. But it is interesting to see that thedifference of performance between the two serversstart to diverge as the number of clients is increasing(right side of Figures 3 and 4). For less than fourclients, both servers have similar performance.4 CONCLUSIONTo manage the relatively short time allocated for theproject, the experiment was conducted in twophases. In the first phase, all four factors were used,each on two levels. The objective was to determinethe effects of each factor and thus identify dominantfactors. In the second phase, the experiment wasperformed using the dominant factors having criticaleffect on the performance of the system under test.The second phase experiment used an increasednumber of levels on a reduced number of factors.It was clear that Internet Information Server has abetter performance than Apache Server on dynamiccontent. One possible explanation is that dynamiccontent requires more interactions with the operatingsystem and evidently IIS is much better integratedwith Windows 2003 Server than an external productsuch as Apache.Although the results demonstrate that IIS is betterthan Apache Server (at least running in a Windowsenvironment) under the heavier workload used inthis comparison, the results for a smaller number ofclients (1 to 3) illustrate better Apache performance.Thus, for a web site that has a lower level of traffic,the Apache Server seems to be a good alternative.Also, looking at graphics showing the throughputand requests per second, and comparing theirrespective variances, it is easy to notice that the IISis more consistent than Apache. So IIS seem to bebetter suited for systems requiring determinism andpredictability. As potential extensions of this studyone could consider similar experiments withLinux/UNIX platforms rather than Windows toshow the comparison from a different perspective.The Webbench used in the study supports only CGI.The study extension may also include use of ASP,Servlets, and PHP as the possible dynamic loads.298REFERENCESAlmeida J.M., Almeida V., and Yates D.J., Measuring theBehavior of a World-wide Web Server, Proceedings ofthe Seventh Conference on High PerformanceNetworking, pp. 57-72, White Plains, NY, 1997Banga G. and Druschel P. Measuring the Capacity of aWeb Server under Realistic Loads. World Wide WebJournal (Special Issue on World Wide WebCharacterization and Performance Evaluation), .html)Barford P.R., Modeling, Measurement And PerformanceOf World Wide Web Transactions, PhD Thesis. 2001Hu Y., Nanda A., and Yang Q. Measurement, Analysisand Performance Improvement of the ApacheWebServer. A preliminary work has been presented at the18th IEEE International Performance, Computing, andCommunications Conference (IPCCC’99) February10-12, 1999 Phoenix/Scottsdale, ArizonaLilja D.J. Measuring Computer Performance, APractitioner’s Guide. Cambridge University Press,2000Mosberger D. and Jin T., httperf - A Tool for MeasuringWeb Server Performance, HP - Internet Systems andApplications Laboratory. March, 1998Nahum E., Barzilai T., and Kandlur D. PerformanceIssues in WWW Servers. IBM T.J. Watson ResearchCenter, 1999 (http://citeseer.ist.psu.edu/565918.html)Prefect F., Doan L., Gold S., Wicki T., and Wilcke W.,Performance Limiting Factors in Http (Web) ServerOperations. Proceedings of the COMPCON Spring’96.SPECweb99 Benchmark – White Paper. SPEC StandardPerformance Evaluation Corporation, July, 2000(http://www.spec.org/web99)Titchkosky L., Arlitt M. and Williamson C. PerformanceBenchmarking of Dynamic Web Technologies.Proceedings of the 11TH IEEE/ACM InternationalSymposium on Modeling, Analysis and Simulation ofComputerTelecommunicationsSystems(MASCOTS’03)
2003). That paper compared performance of various web servers. However, the Internet Information Server, one of the most used in the market, was not part of the testing suite. Several other papers (Prefect, 1996), (Banga, 1999), (Hu, 1999), (Barford, 2001) discuss measurement of web server performance. The Standard Performance Evaluation .