Transcription
10th Global Conference of ActuariesRisks faced by General InsurersBy Birla, Neha,Kumar, Tarun,Garg, Vikas ,Chitlange, Sheetal,Bhatia, Bhumika& Khandelwal, AbhishekPrefaceThe insurance industry is facing turbulent times and risk management is at the top of the agenda.Pressure is mounting on insurers to implement and professionalize risk management practices.Needless to say, supervisors are encouraging risk management information to be more widelyspread throughout organizations in order for it to be fully integrated into the day-to-daymanagement of the business. Many companies are at this moment upgrading their riskmanagement systems.In this paper, which aims to improve standards of risk assessment, should be regarded as anopportunity for insurance companies to improve their risk management systems and will allow youto benefit from the risk management efforts in the context of supervision.This paper will help you to quickly get to grips with risk management terms and techniques andhow they relate specifically to the insurance industry.The main benefit of Risk Management for Insurers is that it emphasizes the practical riskmanagement concepts, rather than technical calculations and detailed theory, making it easier fora layman to understand. What’s more, all concepts and terms are applied to clear illustrativeexamples and the regulation and supervision developments are simple to follow.It is recommended for risk managers, actuaries, controllers, accountants, auditors, corporatefinance managers, underwriting and reinsurance managers, investment managers, equityanalysts and financial consultants.1. IntroductionCenturies ago merchants were encouraged to take hazardous journeys by the existence ofinsurance: if they took the risk and disaster struck, then they would not be ruined if they wereinsured. The same social advantage is still there today. The exciting ventures have changedsomewhat, but the ability to insure against various perils still enables individuals and companies totake on risks that they would not otherwise undertake.Policyholders reduce uncertainty by passing risks to an insurance company. It is not surprising,therefore, that insurance companies themselves are subject to risk and uncertainty.Most of the major uncertainties centre around how many claims there will be and how much theinsurer will have to pay to settle them. These uncertainties have a big influence on how much theinsurer will charge for the protection provided and how much the insurer needs to reserve for futureclaims payments. Other risks to the insurer include: recovery of fixed expenses, failure of otherparties (e.g. brokers or reinsurers), falls in asset values and the insurance cycle. The size of the freereserves will influence the ability of the insurer to cope up with these risks as will reinsurance coverand the investment policy.1
10th Global Conference of Actuaries2. RiskThere are many different definitions of risk, some of them are given below:Project Risk Analysis & Management Guide (PRAM Guide, 1997) defines risk as “an uncertain eventor set of circumstances which, should it occur, will have an effect on achievement of objectives”Risk is a concept that denotes a potential negative impact to an asset or some characteristic ofvalue that may arise from some present process or future event. In everyday usage, "risk" is oftenused synonymously with the probability of a known loss.Risk is the cumulative effect of the chances of uncertain occurrences, which will adversely affectproject objectives. It is the degree of exposure to negative events and their probableconsequences.3. Key components of riskIn modeling risk, actuaries pay special attention to the following key components of risk for eachperil. The modeling tools describe later will need to reflect the following components of riskresulting from each peril.3.1 VolatilityVolatility refers to the amount of uncertainty or risk about the size of changes in a security's value.A higher volatility means that a security's value can potentially be spread out over a larger rangeof values. A lower volatility means that a security's value does not fluctuate dramatically, butchanges in value at a steady pace over a period of time.In general insurance, for some types of business the size of possible claims covers a very widerange, and there is consequent uncertainty as to whether the claims that have actually occurredcan properly be regarded as typical of what might be expected to occur.The variance of aggregate claim amounts will increase if there is non-independence of risks.Therefore accumulations of risk will increase the uncertainty relating to the variability in claim size.The level of random variation will be higher, the smaller the portfolio of business. This problem istherefore greater for small companies (or small classes of business) where you would expect alarger variation from year to year.3.2 UncertaintyUncertainty is the inability to predict the future with confidence. Because of the presence ofuncertainty, we need to consider the effects of possible deviations from the projected figures. Thegreater the uncertainty, the greater the risk.The uncertainties faced by a general insurer can be considered under two main headings: Uncertainty as to the outcome of the business already written Uncertainty as to the premiums the insurer needs to charge in future to achieve a desiredfinancial result.3.2.1 Business already writtenAt any given time, an insurer will have claims that have been reported but have not yet beensettled, and there will be uncertainty as to when they will be settled and the amount for which theywill be settled. Even for the claims that have been recorded as having been settled, there is a riskthat they will be reopened and further payments will have to be made. In addition, there will be2
10th Global Conference of Actuariesclaims that have been incurred but of which the insurer is unaware because they have not yet beenreported; there will be inevitable uncertainty as to the number of such claims, their costs and thetiming of the payments.3.2.2 Premium rates required in the futureThe natural starting point for assessing the premium rates that an insurer needs to charge in futureis an assessment of the adequacy of the rates that have been charged in the past. This is subject toall the uncertainties that affect the measurement of the financial outcome of the existing business,together with further uncertainties as to: The extent to which past experience will be relevant to the future The extent of any adjustments that need to be made to the experience of the recent past toallow for exceptional claims that have occurred or failed to occur Possible changes in assumptions required as projections have to extend even further intothe future The appropriate choice of rating factors and premium relativities, i.e. the relationshipsbetween the premiums quoted for different rating cells.4. Types of risk4.1 Underwriting riskUnderwriting refers to the process that a large financial service provider (bank, insurer, investmenthouse) uses to assess the eligibility of a customer to receive their products like equity capital,insurance or credit to a customer. The name has been derived from the Lloyd's of London insurancemarket in London, United Kingdom. Financial bankers, who would accept some of the risk on agiven venture (historically a sea voyage with associated risks of shipwreck) in exchange for apremium, would literally write their names under the risk information which was written on a Lloyd'sslip created for this purpose.Insurance underwriters evaluate the risk and exposures of the prospective clients. They decide howmuch coverage the client should receive, how much they should pay for it, or whether to evenaccept the risk and insure them. Underwriting involves measuring risk exposure and determiningthe premium that needs to be charged to insure that risk. The function of the underwriter is toacquire—or to "write"—business that will make the insurance company money, and to protect thecompany's book of business from risks that they feel will make a loss. In simple terms, it is theprocess of issuing insurance policies.Underwriting decisions would typically be influenced by PML (Probable Maximum Loss) evaluations,and the amount of reinsurance ceded on a risk would normally be predicated on the PML valuation.PML is the anticipated value of the largest loss that could result from the destruction and the loss ofuse of property, given the normal functioning of protective features (firewalls, sprinklers, and aresponsive fire department, among others, in the case of a fire loss). This number is usually smallerthan the maximum foreseeable loss, which assumes the failure of all protective features.At the most basic level, managing catastrophe risk involves ensuring that insurers and reinsurersare able to remain viable following losses from a ‘probable maximum’ event. For the most part,insurers and reinsurers approach PML management by planning for the eventuality of a largenatural catastrophe, and have quantified their risk accordingly.A PML Bust could result from the accumulation of risk as in the case of attack on the Twin Towers,the PML was taken to be the Sum insured of one tower and the 9/11 attack was considered to betwo events by the insurers. But when the final court verdict came it was taken to be a single eventand there was a PML bust which led many insurers to insolvency.3
10th Global Conference of ActuariesWTC has showed just how necessary it is to perform a worst-case accumulation analysisencompassing all property and Business Interruption (BI) losses, despite the fact that calculating allpotential BI exposures is a difficult task.4.2 Credit riskCredit risk is the risk due to uncertainty in a counterparty's (also called an obligor's or credit's)ability to meet its obligations. In assessing credit risk from a single counterparty, an institution mustconsider three issues: Default probability: What is the likelihood that the counterparty will default on itsobligation either over the life of the obligation or over some specified horizon, such as ayear? Calculated for a one-year horizon, this may be called the expected default frequency. Credit exposure: In the event of a default, how large will the outstanding obligation bewhen the default occurs? Recovery rate: In the event of a default, what fraction of the exposure may be recoveredthrough bankruptcy proceedings or some other form of settlement?4.3 Market riskThis is the risk to an institution's financial condition resulting from adverse movements in the levelor volatility of market prices of interest rate instruments, equities and currencies. Market risk isusually measured as the potential gain/loss in a position/portfolio that is associated with a pricemovement of a given probability over a specified time horizon.Market risk is the risk that the value of an investment will decrease due to moves in marketfactors. The three standard market risk factors are:Equity risk, Equity risk is the risk that one's investments will depreciate because of stock marketdynamics causing one to lose money.Interest rate risk, Interest rate risk is the risk that the relative value of an interest-bearing asset,such as a loan or a bond, will worsen due to an interest rate increase. In general, as rates rise, theprice of a fixed rate bond will fall, and vice versa.Consider a ten year and a twenty year zero coupon bond. If the spot rate for all terms is 5% thenthe prices of the bonds are 1.05-10 61.39% and 1.05-20 37.69% respectively.If the interest rates rise to 6% then the price of both bonds will fall:The ten year bond price falls to 55.84%, a 9% drop.The twenty year bond price falls to31.18%, a 17% drop.Longer dated bonds are more sensitive to interest rate movements than short dated bonds. It isassumed that risk averse investors will require compensation (in the form of higher yields) for thegreater risk of loss on the longer bonds. This might explain some of the excess return offered onlong-term bonds.Currency risk, Currency risk is a form of risk that arises from the change in price of one currencyagainst another. Whenever investors or companies have assets or business operations acrossnational borders, they face currency risk if their positions are not hedged.4
10th Global Conference of Actuaries4.4 Operational riskOperational risk is the risk of loss resulting from inadequate or failed internal processes, people andsystems, or from external events. The committee indicates that this definition includes legal risk butexcludes systematic risk and reputational risk.During the early part of the decade, much of the focus was on techniques for measuring andmanaging market risk. As the decade progressed, this shifted to techniques of measuring andmanaging credit risk. By the end of the decade, firms and regulators were increasingly focusing onrisks "other than market and credit risk." These came to be collectively called operational risks. Thiscatch-all category of risks was understood to include, Employee errors,Systems failures,Fire, floods or other losses to physical assets,Fraud or other criminal activity.The concept of operational risk has primarily emerged from banking industry. In banking industrythousands of transactions are processed each day therefore the amount of data in respect of lossesarising from operation failures is more abundant. This naturally lends itself to the development offrequency and severity models to evaluate the aggregate loss distribution and hence the capitalrequirement.Operational risk has been recognized as an important risk for insurers as well as for banks. But achallenge for insurer’s in assessing operational risk is to separate this risk from the loss experiencedata typically collected for the other underwriting, credit and market risk. For eg , insurer will needto examine the portion of their underwriting losses that are really due to ineffective or faultyunderwriting processes or client management.It is therefore recommended that insurance supervisors, the insurance industry and the actuarialprofession work together to develop appropriate research to measure operational risk.4.5 Liquidity riskThe risk that arises from the difficulty of selling an asset. An investment may sometimes need to besold quickly. Unfortunately, an insufficient secondary market may prevent the liquidation or limit thefunds that can be generated from the asset.An institution might lose liquidity if its credit rating falls, it experiences sudden unexpected cashoutflows, or some other event causes counterparties to avoid trading with or lending to theinstitution. A firm is also exposed to liquidity risk if markets on which it depends are subject to lossof liquidity.In an insurance context, liquidity risk is exposure to loss in the event that insufficient liquid assetswill be available, from among the assets supporting the policy obligations, to meet the cash flowrequirements of the policyholder obligations when they are due.5. Risk Measures:Insurance Risk managementRisk Management is a very important for insurance industry. Insurance means that insurancecompanies take over risk from customers. Insurers consider every available quantifiable factors todevelop profiles of high and low insurance risk. Level of risk determines insurance premiums.5
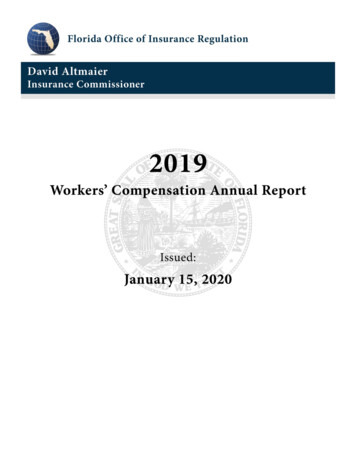
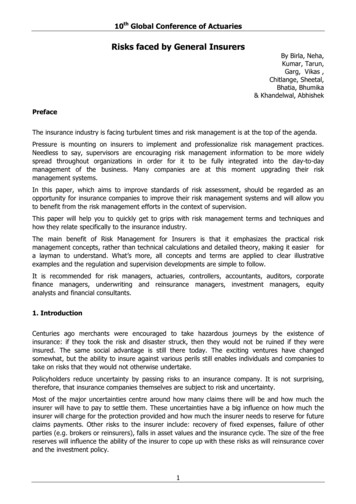
10th Global Conference of ActuariesGenerally, insurance policies involving factors with greater risk of claims are charged at a higherrate.5.1 Statistical Risk Measures:The following diagram shows some of the Risk Measures for a skewed distribution:Skewed DistributionMeanStd DeviationValue at Risk(95th Percentile)Tail VaR95(Average VaR inShaded 0350.000400.000LossNormal distribution is usually not useful as a distribution for losses. According to normal distributionlosses are symmetrical but this is not the case in reality as losses are asymmetrical i.e. losses arepositively skewed. By positively skewed we mean that most of the losses are greater than zero.To elaborate Risk Measures further we have some other definition, which are given asbelow:5.1.1 Mean: 'Mean' means average.For a data set, the mean is the sum of the observations divided by the number of observations. Themean is often quoted along with the standard deviation: the mean describes the central location ofthe data, and the standard deviation describes the spread.5.1.2 VarianceThe (population) variance of a random variable is a non-negative number which gives an idea ofhow widely spread the values of the random variable are likely to be; the larger the variance, themore scattered the observations on average.6
10th Global Conference of ActuariesStating the variance gives an impression of how closely concentrated round the expected value thedistribution is; it is a measure of the 'spread' of a distribution about its average value.Variance is symbolized by V(X) or Var(X) orThe variance of the random variable X is defined to be:Where E(X) is the expected value of the random variable X.Notesthe larger the variance, the further that individual values of the random variable (observations) tendto be from the mean, on average;the smaller the variance, the closer that individual values of the random variable (observations)tend to be to the mean, on average;taking the square root of the variance gives the standard deviation, i.e.:The variance and standard deviation of a random variable are always non-negative.5.1.3 Standard Deviation:Standard deviation is a measure of the spread or dispersion of a set of data.It is calculated by taking the square root of the variance and is symbolised by s.d., or s. In otherwordsThe more widely the values are spread out, the larger the standard deviation.5.1.4 Coefficient of VariationThe coefficient of variation measures the spread of a set of data as a proportion of its mean. It isoften expressed as a percentage.It is the ratio of the sample standard deviation to the sample mean:There is an equivalent definition for the coefficient of variation of a population, which is based onthe expected value and the standard deviation of a random variable.5.1.5 Value at risk and tracking errorValue at Risk (VaR) generalises the likelihood of under-performing by providing a statistical measureof downside risk. Value at risk can be determined as:7
10th Global Conference of ActuariesVaR(X) -t where P(X t) pVaR assesses the potential losses on a portfolio over a given future time period with a given degreeof confidence.For example, if we adopt a 99% confidence limit, the VaR is the amount of loss that will beexceeded only one time in a hundred and we would need to find the loss in valuet such that P(X t) 0.01 .5.2 Other Measures: Insurance Risk Factor Profiling Insurance Predictive Modeling Insurance Scoring5.2.1 Profiling of Risk SegmentsProfiling is to identify factors and variables that best summarize the segments.Profiling insurance risk factors is very important. The Pareto principle suggests that 80%-90% ofthe insurance claims may come from 10%-20% of the insurance segment groups. Profiling thesesegments can reveal invaluable information for insurance risk management. Insurance providersoften collect a large amount of information on insured entities. Policy information (such asautomobile insurance, life insurance, general insurance, etc.) often consists of dozens or evenhundreds of variables, involving both categorical and numerical data with noisy information.Here are some of the examples:High risk healthcare coverage risk factor profiling:An insurance company keeps health care insurance coverage (or health insurance for short) or lifeinsurance records in its database: gender, age, education, smoking, drinking, sun activity, height,weight ( obesity level), claim payment, etc., as well as other contact information. The companywishes to know which health insurance groups are at the highest risk, i.e., have the highest claimratio. The following is a possible output of hotspot profiling r
10th Global Conference of ActuariesAn insurance company keeps records on motor vehicle insurance (or automobile insurance)information in its database containing driver and vehicle information: Gender, age, licenseexperience, education, occupation, drinking, smoking, mobile phone use; vehicle manufacturer,type, model, year make, and so on. The company wishes to know which motor vehicle insurance isat the highest risk groups, i.e., highest average insurance payouts. The following is a possibleoutput of hotspot profiling analysis;5.2.2 Insurance Risk Modeling:If past is any guide for predicting future events, predictive modeling is an excellent technique forinsurance risk management. Predictive models are developed from past historical records ofinsurance policies, containing financial, demographic, psychographic, geographic information, alongwith properties of insured objects.What is predictive modelling?Predictive modelling is the process by which a model is created or chosen to try to best predict theprobability of an outcome. Predictive models are developed from past historical records of insurancepolicies, containing financial, demographic, psychographic, geographic information, along withproperties of insured objects.If past is any guide for predicting future events, predictive modeling is an excellent technique forinsurance risk management. Many successful insurers today know that predictive modeling canassist in better identifying and segmenting insurance risks, which can lead to improvedunderwriting, pricing, and marketing decisions. Predictive modeling can help companies manage theinsurance business smarter. Leaders no longer have to manage on instinct or “gut feel”, but canuse factual data to assist in making better business decisions.9
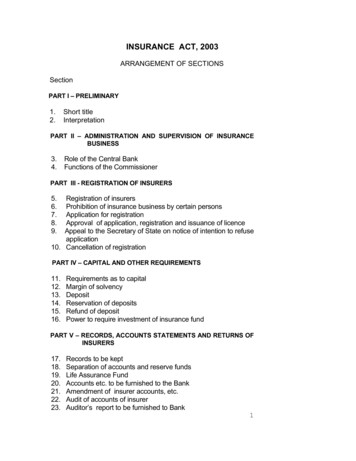
10th Global Conference of ActuariesWhat Can Predictive Modeling Do For Us?First, it can help insurers improve their rating plans by identifying mispriced risks. By analyzingdistributional relationships in insurance databases in a multivariate Frame work, predictive modelingcan show assumptions that can give misleading results. For example, when considering therelationship between insurance losses and age and the relationship between insurance losses andprior accidents, it is no surprise that younger drivers tend to cost more to insure, and that driverswith prior accidents cost more to insure.Predictive modeling helps insurers define groups that are more homogenous for rating,underwriting, marketing, etc. For example, an insurance company may rate the city of Dallas andthe surrounding areas in Dallas County the same. Predictive modeling may show that the risk ofloss outside of the city of Dallas is considerably different than the risk of loss inside the city ofDallas.By identifying new variables or new relationships between variables, predictive modeling can alsoidentify new ways to segment risks. The most vivid example of this in the last decade has been theincreasingly widespread use of credit history in generating insurance scores. Insurance scores havebeen used not only for rating, but also for tiering, underwriting and marketing.Techniques of predictive modelling:Ist Method: Decision TreeDecision tree analysis is a predictive model that attempts to separate a group of risks intohomogeneous groups based on an identified response variable. The process begins by taking theentire population, and then analyzes each independent variable to determine which creates thelargest degree of separation in the dependent variable. The dataset is then “split,” or branches off,into two or more groups based on this characteristic. Next, each branch is independently analyzedto determine which independent characteristic is most important in distinguishing between levels ofthe dependent variable for that branch.Exercise: Our friend David is the manager of a famous golf club. Sadly, he is having some troublewith his customer attendance. There are days when everyone wants to play golf and the staff areoverworked. On other days, for no apparent reason, no one plays golf and staff have too muchslack time. David’s objective is to optimise staff availability by trying to predict when people will playgolf. To accomplish that he needs to understand the reason people decide to play and if there isany explanation for that. He assumes that weather must be an important underlying factor, so hedecides to use the weather forecast for the upcoming week. So during two weeks he has beenrecording: The outlook, whether it was sunny, overcast or raining. The temperature (in degrees Fahrenheit). The relative humidity in percent. Whether it was windy or not. Whether people attended the golf club on that day.David compiled this dataset into a table containing 14 rows and 5 columns as shown below.10
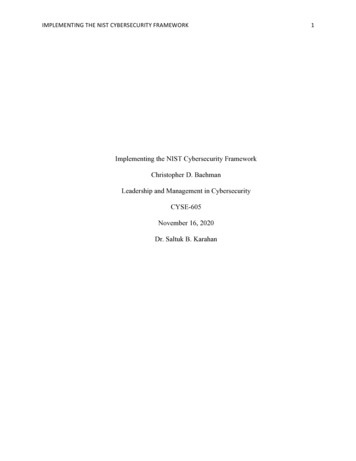
10th Global Conference of ActuariesHe then applied a decision tree model to solve his problem.11
10th Global Conference of ActuariesDavid's first conclusion: if the outlook is overcast people always play golf, and there are somefanatical who play golf even in the rain. Then he divided the sunny group in two. He realized thatpeople don't like to play golf if the humidity is higher than seventy percent.Finally, he divided the rain category in two and found that people will also not play golf if it iswindy.And lastly, here is the short solution of the problem given by the classification tree: David dismissesmost of the staff on days that are sunny and humid or on rainy days that are windy, becausealmost no one is going to play golf on those days. On days when a lot of people will play golf, hehires extra staff. The conclusion is that the decision tree helped David turn a complex datarepresentation into a much easier structure.IInd Method: Generalized Linear ModelGLM allows users to fit a multivariate model with a flexible structure to a dataset, which enables aseries of independent variables to predict the value of a dependent variable. This model isespecially effective for determining the impact of class plan variables on loss costs, or the impactsof different claim characteristics on an ultimate claim settlement value. GLM also gives you aframework for discovering the interactions of variables in an automated way. Interactions occurwhen two independent variables in a model do not have a constant relationship with each other.A GLM consists of an underlying distribution for the data which is assumed to be a member of theexponential family of distributions, a linear predictor and a link function.A generalized linear model (GLM) may be regarded as an extension of the linear Models. Theessential difference for GLMs is that we now allow the distribution of the data to be non-normal.This is particularly important in actuarial work where the data very often do not have a normaldistribution.GLMs relate a variable (called the response variable) which you want to predict, to variables orfactors (called predictors, covariates or independent variables) about which you have information.In order to do this, it is necessary first to define the distribution of the response. Then thecovariates can be related to the response allowing for the random variation of the data. Thegeneral form of distributions (known as exponential families) which are used in GLMs.The exponential family is a broader class of distributions sharing the same density form andincluding normal, Poisson, Gamma, Inverse Gaussian, Binomial, Exponential and other distributions.Exponential family has the following two properties:The distribution is completely specified in terms of mean and variance.The variance of Yi is a function of its mean.The linear predictor is the quantity which incorporates the information about the independentvariables into the model. The symbol η (Greek "eta") is typically used to denote a linear predictor. Itis related to the expected value of the data (thus, "predictor") through the link function. η isexpressed as linear combinations (thus, "linear") of unknown parameters β.To elaborate further, consider an example:In UK motor insurance business, vehicle-rating group is also used as a factor. Vehicles are dividedinto twenty categories numbered 1 to 20, with group 20 including those vehicles that are mostexpensive to repair.Suppose that we have a three-factor model specified as age*(sex vehicle category)The linear predictor would be:12
10th Global Conference of Actuariesαi βix γj δjxAge is a numerical variable. However, vehicle group is really a categorical variable. Sodenote age by x.αi and βi are functions of the policyholder’s sex, and γj and δj are functions of vehicle grouping.It is necessary to connect the mean response to the linear predictor. In general we take somefunction of the mean response and this function is called the link function. The link functionprovides the relationship between the linear predictor and the mean of the distribution function.5.2.3 Insurance Scoring:Managing your credit-borrowing money and paying your bills is the part of daily life. The use ofcredit information by the financial services industry has long been widespread practice, and credithas now become a key tool for insurers.Home and auto insurers use credit insurance to produce an “insurance score”, which helps them tomore accurately assess an applicant. Research has shown a strong correlation between credithistory and the likelihood of loss in both auto and homeowners insurance. Insurance Score, thenprovide an objective, accurate and consistent tool that many insurance carries.But insurance scores are only factor in the underwriting decision. Insurers also years of drivingexperience, previous accidents and violations, type of car and home construction type for example.What is an insurance score?Insurance score are
4.2 Credit risk . Credit risk is the risk due to uncertainty in a counterparty's (also called an obligor's or credit's) ability to meet its obligations. In assessing credit risk from a single counterparty, an institution must consider three issues: Default probability: What is the likelihood that the counterparty will default on its