Transcription
Study of cirrus clouds and implications for the variability oflaser guide star intensity and fratricide effectsAngel Otarolaa and Paul HicksonbaTMT International Observatory, 100 West Walnut Street, Suite 300, Pasadena, CA, USA91124bDept. of Physics and Astronomy, University of British Columbia, 6224 Agricultural Road,Vancouver, BC V6T 1Z1, CanadaABSTRACTMeasurements of back-scattering, at a wavelength of 532 nm, from the Cloud-Aerosol Lidar and InfraredPathfinder Satellite Observation (CALIPSO) satellite, over the period June 2006 - November 2016, are analyzed to characterize cirrus clouds at the location of several observatory sites worldwide. From these data, wederive statistics of altitude, thickness and optical depth of cirrus clouds. These parameters are relevant for understanding and modeling the effects of cloud and aerosols on laser propagation for adaptive optics and the temporalvariability of the fratricide pattern. The latter is particularly important for facilities employing center-launchedlasers, such as the Thirty Meter Telescope.Keywords: Cirrus clouds, aerosols, Rayleigh backscattering, fratricide effect1. INTRODUCTION1.1 MotivationCirrus clouds impact the performance of adaptive optics in several ways. They attenuate the uplink laser beam,and also the downward propagating light, reducing laser guide star (LGS) brightness. They also attenuate thelight from the science target, and may increase the diffuse background light that is the primary source of noisefor observations of faint objects. Laser light scattered by the clouds contributes to fratricide, the contaminationof LGS light by scattered light from multiple propagating laser beams.A new generation of large aperture telescopes will make extensive use of adaptive optics employing asterismscreated by multiple lasers. In the case of the Thirty Meter Telescope (TMT) project, it is planned that for firstlight at least 50% of the time will be dedicated to near-infrared diffraction limited imaging and spectroscopy.Consequently, this study focused on determining the physical characteristics (thickness and optical depth) aswell as the statistical occurrence of thin cirrus clouds and aerosols at various astronomical sites. Most of thosesites have telescopes that make use of adaptive optics systems employing LGS. The information learned in thisstudy should prove helpful for simulations of LGS magnitude variability, as well as of variability in the intensityof the backscattered light detected by wavefront sensors.1.2 Background informationCirrus clouds are a source of attenuation of star light during astronomical observations. The fraction of lightscattered out of the line of sight to the source depends on the optical density of the cirrus clouds. There is notmuch discussion in the literature about systematic detection and classification of cirrus clouds at astronomicalobservatory sites. Yet, even thin cirrus clouds are enough to perturb the quality of astronomical observations.1, 2In fact, isolated emissions features detected on low resolution spectroscopy observations, have been claimed toarise from light from distant lightning storms scattered by thin cirrus clouds.3 Of particular interest are thincirrus clouds that contribute to transparency variations in the order of 10% to 20%, i.e. variations in the detectedstar magnitude of order 0.1 to 0.2 magnitudes.4Further author information: (Send correspondence to A.O.)A.O.: E-mail: aotarola@tmt.org, Telephone: 1 520 318 8401
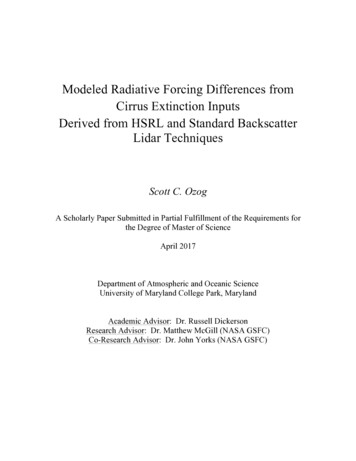
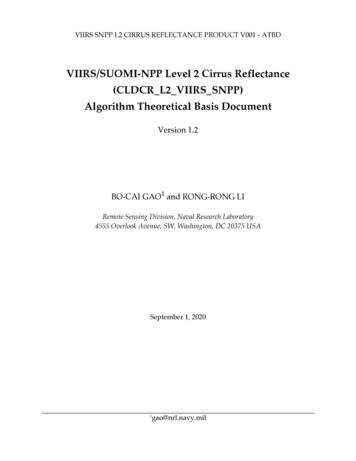
Importantly, in the context of new large aperture telescopes as the European Extremely-Large Telescope(ELT),5 TMT6 and the Giant Magellan Telescope (GMT),7 which will use sodium LGS extensively, cirrusclouds will have a significant impact on performance. In telescopes employing adaptive optic (AO) systemsusing multiple center-launched lasers, such as the Gemini South (GeMS)8 and the TMT (NFIRAOS),9 thebackscattered laser light due to Rayleigh scattering from air molecules, and Mie scattering in cirrus clouds andfrom aerosol particles, is detected by the wavefront sensors matched to neighboring LGS. This is the so-calledfratricide effect.10, 11 The backscattered light is consequently a source of both photon noise and backgroundvariability and will ultimately affect the quality of the wavefront reconstructions. At the TMT project, there isa plan to compensate for the Rayleigh backscattering by making use of either a reference image of the Rayleighbackscattering pattern or by fitting a model to the fratricide pattern.12 However, the time variability of cirrusclouds optical depth, as the clouds drift across the propagating laser beams, will introduce variability in theintensity and shape of the fratricide pattern. Cirrus clouds will also reduce LGS brightness, reducing the numberof detected photons and thus impacting the availability of the AO system.13This manuscript includes the following sections: Section 2 explains the data used for this study, Section 3summarizes the statistics of the various parameters of interest, Section 4 shows some calculations of laser lightpower attenuation and variability in the atmospheric channel, Section 5 presents some comments about therelevance of attenuation and variability in the cirrus cloud properties in the fluctuations of the laser fratricidepattern, and Section 6 summarizes relevant conclusions of this study.2. DATAThe data used in this study were acquired by the Cloud-Aerosol Lidar with Orthogonal Polarization (CALIOP)instrument on board of the Cloud-Aerosol Lidar and Infrared Pathfinder Satellite Observations (CALIPSO)satellite.14 These data were obtained from the NASA Langley Research Center Atmospheric Science DataCenter .Figure 1. Artist concept of the constellation of satellites in the A-Train in. Picture obtained from
The CALIPSO satellite is part of a special Sun-synchronous orbit, so called the A-Train, which includes aconvoy of satellites, each carrying complementary sensors for the study of various geophysical parameters, seeFigure 1. The satellites are positioned so that the time elapsed from the passage of the first and last satelliteover a given point along the orbit is only 15 minutes. The orbital height is 705 km and the satellites cross theequator at approximately 1:30 PM solar time, and then again around 1:30 AM. There are 14.55 orbits per day,this imply the satellites cover sections of the planet separated about 24.74 degrees each day. The orbit path, atthe equator, progresses westwards 10.8 degrees each day, and the final coverage pattern results in a total of 233orbits circling the planet with a separation of about 1.545 degrees. At the Equator, a separation of 1.545 degreesis about 172 km.CALIPSO includes an integrated LIDAR transmitter platform which in turn includes two LIDAR sensors(one using visible and the other a near-infrared wavelength), both in nadir-view geometry. An optical telescopeof one meter diameter is used for the detection of the light backscattered, by aerosols and cloud particles, atvarious levels in the atmosphere as the laser light propagates from the satellite to the surface of the planet. Table1 summarizes the main parameters of the LIDAR transmitter platform and detection system.Table 1. CALIOP main parametersParameterLaserWavelengthPulse energyPulse repetition rateReceiver diameterPolarizationFootprint/FOVVertical ResolutionHorizontal resolutionValueNd:YAG, diode-pumped, Q-switched frequency doubled532 nm, 1064 nm110 mJ/channel20.25 Hz1.0 mOnly for the 532 nm Lidar100 m / 130 uradIn the range 30 to 60 m5 km (above 8 km) / 333 m (below 8 km)2.1 Sites under studyTable 2. CALIOP main parametersSiteMauna Kea (13N site)La PalmaKitt PeakMount GrahamCerro PachónCerro TololoLa SillaLas CampanasParanalArmazonesCerro Honar (Chajnantor)Latitude( )N 19.8260N 28.7567N 31.9583N 32.7013S 30.2407S 30.1697S 29.2500S 29.0146S 24.6272S 24.5894S 23.0833Longitude( )W 155.4747W 17.8919W 111.6467W 109.8891W 70.7367W 70.8068W 70.7333W 70.6926W 70.4029W 70.1919W 67.7667Altitude(m LIOP Level 2 data for the period 2006 to early 2017, were obtained using the Data Ordering Tool availablethrough the Langley Research Center/NASA web site. The ordering tool allows one to specify the coordinates ofa user-defined bounding box around the geographical coordinates of the sites of interest. Since the final orbital
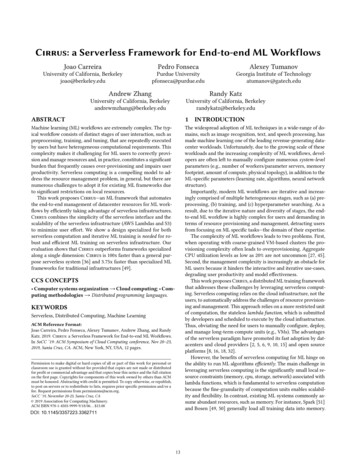
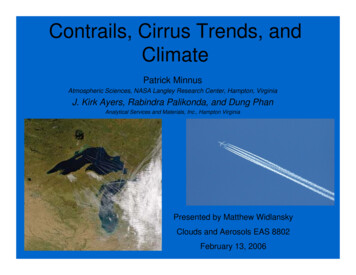
coverage pattern results in the orbits circling the planet with a separation of about 1.545 degrees, the user-definedbounding box was set of at least 0.5 0.5 and up to 1 1 , this to ensure finding a good number of CALIOPobservations near the sites of interest, listed in Table 2. Therefore, the bounding box looked for data withinabout 60 km to 115 km around each site of interest.The CALIOP 532 nm lidar transmits and detects horizontal and perpendicular polarizations. Hence, twoimportant parameters can be computed, one being the layer-integrated depolarization ratio and another the totallayer-integrated attenuated backscatter (see Eq. 1 and Eq. 2 in15 ). Also, the lidar is able to determine the cloudbase altitude. Together, these parameters can be used for the identification of cloud type,15, 16 and in particularcirrus clouds.17 For instance, randomly oriented crystals in ice clouds can introduce significant depolarization ofthe signal.18 Procedures proposed for the automatic detection of cirrus clouds from lidar data have shown thatthin cirrus clouds do not exceed an optical depth of 0.3 nepers.19Figure 2. Map of the Big Island of Hawaii. CALIOP nighttime observations in the period 2006-2017 (red crosses),observations in which a thin cirrus cloud (optical depth less than 0.3 nepers) was detected (blue crosses). The X indicatesthe location of the observatory site.Consequently, for this study, we filtered the databases for each site, selecting only the measurements where asingle-layer cloud was detected at a geographical altitude higher than the site altitude and for which the opticaldepth is at most 0.3 nepers. Figure 2 presents a map of the big island of Hawaii that shows the nadir viewmeasurements of the CALIOP 532 nm lidar in the period 2006 to early 2017 (red crosses), as well as thosemeasurements where a cloud was detected above the altitude of the Maunakea site (blue crosses) and with amaximum cloud optical depth of 0.3 nepers (this corresponds to an extinction of 0.276 magnitudes per airmass).Similar plots are shown in Figure 8, for the data coverage obtained for all of the other sites of interest in thisstudy.One important assumption in this study is that the clear-sky/thin-cirrus-cloud conditions determined from theCALIOP data available from the locations nearby to the observatory sites is, in a statistical sense, representative
of the conditions at the sites. Later on, in the analysis section of this manuscript, it will be shown that theoverall statistics agree quite well with previous studies using different datasets. In addition to those results, thiswork provides a year-to-year, and monthly characterization of thin-cirrus cloud thickness, altitude, and opticaldepth and also aerosol optical depth. Such data are useful for studies that include propagation of laser lightthrough the atmosphere, laser fratricide effects and atmospheric extinction in various astronomical bands.3. STATISTICAL RESULTS3.1 Multi-year statistics of cloud physical propertiesThe parameters of interest are: Clear-sky fraction. Clear-sky thin-cirrus fraction. Thin cirrus cloud mean-base altitude and its standard deviation, as well as cloud thickness. Thin cirrus clouds optical depth statistical quartiles. Upper-atmosphere aerosols optical depth statistical quartiles.The dataset was analyzed such as to determine the statistics for the full period of data available, as well asthe annual and monthly variability.Table 3 summarizes the full-period statistics for each of the sites listed in Table 2.If the statistics of clear sky plus thin-cirrus clouds fraction can be interpreted as what in other studies is calledthe usable-time fraction or spectroscopy sky quality fraction, then the overall statistics shown in Table 3, from theanalysis of the CALIP database, matches very well the results from previous studies. The work of Andre Erasmusand van Staden,20 from the analysis of GOES-8 satellite 10.7 um channel observations, found a usable fractionof 78.2% for the Cerro Tololo site, 83.1% for La Silla Las Campanas area, and 90.5% for the Paranal/Armazonesarea. For these sites, the results in this study are in agreement, within 1.5%, with the Erasmus & van Stadenresults. In the particular case of La Silla observatory, long-term monitoring of photometric sky quality (1984through 2013)† , shows the mean photometric fraction to be 63% with a standard deviation of 20% (see footnote3), this result is compatible with the 75% clear sky fraction found in this study. The main difference is for theMauna Kea site, while in this study the data shows an overall 81% of usable time, the Erasmus study indicates71.4%.For the La Palma site, from the analysis of observing log-books of the Telescopio Nazionale Galileo (TNG),in the period 2000 to 2008, a percentage of clear nights of 62.6% was found.21 This result compares well withthe 64% found in the present study. However, the same study (della Valle et al., 2010) found a 71.9% clear skyfraction for the site of La Palma from the analysis of GOES-12 satellite observations with the 10.7 um channel.For the Kitt Peak site, and from the nighttime observing report compiled by D.L. Crawford‡ , the overall annualmean usable sky fraction is estimated to be 70%, this agrees quite well with the 72% of usable time found inthis study. The Mount Graham and Kitt Peak are within the same climatological region in the USA southwest,but when analyzing the CALIOP sensor data separately, using only the data closer to each site (see CALIOPdata coverage in Figure 8, top-right panel), the results show Kitt Peak to have about 5% larger clear-sky andusable-sky fractions than Mount Graham. However, this 5% variability is in the order of magnitude of the overallyear-to-year variability in the data.In summary, the overall statistics of clear fraction and usable time at astronomical sites, determined fromCALIPSO data, generally agree very well with the results known from the observatory statistics or tps://www.noao.edu/kpno/usrhnbk/user-App.html
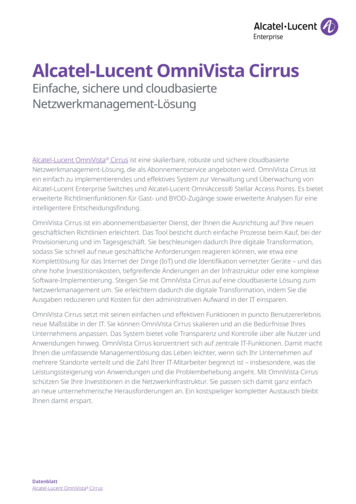
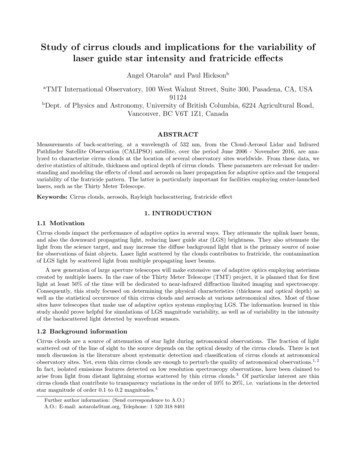
Table 3. Overall, 2006-2017, statistical results of cloud thickness, thin cirrus and aerosol optical depths, clear sky fractionand clear thin-cirrus sky fraction for selected astronomical sites. For cloud base, cloud top and cloud thickness, thestatistics are mean value one standard deviation. Q1, Q2 and Q3 are the 25%, 50% and 75% quartiles.ParameterNo. of data pointsQ1 cloud thick. (km)Q2 cloud thick. (km)Q3 cloud thick. (km)Cloud base alt. (km)Cloud top alt. (km)Cloud thick. (km)Q1 thin cirrus τQ2 thin cirrus τQ3 thin cirrus τQ1 aerosol τQ2 aerosol τQ3 aerosol τClear-sky sectionsThin cirrus sectionsClear-sky fract.Thin-cirrus fract.Usable fract.MK54520.7781.0781.55711.7 2.712.9 2.71.26 ORM56870.8381.1381.6179.3 2.010.7 2.11.33 KP/MG298010.7191.0181.4609.6 2.810.8 3.01.19 2%CP/CT48460.5990.8981.3779.7 1.910.7 2.01.04 S/LC39340.5990.9581.3929.5 2.010.7 2.11.15 ar/Arm73870.6590.8391.23511.1 2.612.1 2.71.03 onar54920.5990.8981.31711.7 2.512.8 2.51.07 3.2 Monthly statistics of clear sky and usable fractionsFor each of the sites under study, the CALIOP data gathered in the period 2006-2017 were grouped by monthof the year. This allows one to estimate the monthly statistics for cloud coverage as well as cloud properties.However, one should keep in mind, that the data in each month comes from orbits of the CALIPSO satelliteover the given sites in multiple years, and this averages out the annual variability. The results for monthly clearsky fraction and monthly usable fraction (including those days with thin cirrus clouds) are shown in Figures 3and 4, respectively. Figure 5 shows the mean clear-sky and usable night fractions for each year.Qualitatively, the clear fraction and usable fraction seem to agree quite well with direct experience. Forinstance, the increasing trend of clear/usable fractions in the northward direction for the Chile sites (moving awayfrom the possible adverse effects of mid-latitude weather fronts). The relatively-lower fraction of clear/usabletime at the sub-tropical zone (Cerro Pachn and Cerro Tololo) is likely because those sites are more prone to beaffected by weather fronts moving north from the mid-latitudes. While, the sites such as Paranal and Armazoneslie in the latitude of the descending (subsiding) branch of the Hadley cell. This subsiding dry air creates ahigh-pressure center that warms the mid-levels of the atmosphere and lower troposphere. This effect, togetherwith the cold Humboldt current along the eastern Pacific basin, creates the conditions that ultimately allow ahigher fraction of clear sky.22Interestingly enough, the CALIOP lidar results show that the median aerosol optical depth is about a factorof two larger for the northern-hemisphere sites than for the southern-hemisphere sites. A likely explanation forthis is the higher fraction of continental masses, higher industrialization, but also of regions known of generatingand distributing mineral dust from the surface into the higher levels of the troposphere, such as the Sahara.23The results in this study show a 50% percentile aerosol optical depth of 0.063 for the site of Roque de LosMuchachos in the period 2006-2017 (mean value 0.060, excluding the high-aerosol events associated with theadvection of Saharan dust). Lidar observations done in situ for a few nights in 2007 and 2008, in the context ofthe ELT site testing effort, show an average value of 0.0405 at 532 nm (in standard conditions) and as high as0.233 during Saharan dust advection events.24 Using the aerosol optical thickness results shown in Figure 7 of,24
Figure 3. Monthly Clear Sky Fraction. The sites are:Mauna Kea (MK), La Palma (ORM), Kitt Peak/MountGraham KP/MG, Cerro Pachn/Cerro Tololo (CP/CT),La Silla/Las Campanas (LS/LC), Paranal/Armazones(Par/Arm), Cerro Honar (HONAR).Figure 4. Monthly Usable Fraction (i.e. includes the effectof thin-cirrus clouds with optical depth up to 0.3 nepers).The site labels are as in Figure 3.and including only those data points that have optical thickness less than 0.15 nepers (to remove the potentialbias of Saharan dust events), the variability of the remaining values is 0.038 nepers. Consequently, the statisticalresults obtained in this study for aerosol optical depth are compatible with the limited in-situ measurements ofaerosol extinction.On the other hand, the mean cloud base and cloud top altitudes, are higher at sites located by the tropicalregion when compare to the sites of higher latitudes. This is consistent with the expanded atmosphere due tohigher energy-content in the atmospheric column in the tropical latitudes. Also, the monthly distributions ofclear/usable sky fraction (See Figure 3), show the clear effect of the North American monsoon (summer months)at the Kitt Peak and Mount Graham sites, when it is mostly cloudy, as well as the seasonal (winter/summer)signal for all sites.3.3 Cirrus cloud optical depth variabilityThe CALIOP Level 2 data consists of 5-km sections along the path of the satellite. The CALIOP 532 nm lidarfootprint is only 90 m in diameter, so in order to achieve a sufficiently-high signal to noise ratio for the detectionof cirrus clouds, the data from this sensor is averaged in sections of 5 km in length (equivalent to about 55individual footprint-size sections). Of interest in this study is the variability of cirrus clouds optical depth onshort time scales, or short spatial lengths, for instance comparable to the size of a laser beam that propagatesthrough the atmosphere (of order 20 to 50 cm laser beam diameter). In the case of the TMT project, the laser
Figure 5. Annual statistics of clear-sky (blue) and usable-nights (red) fractions for the sites under study. The mean overallannual statistics for clear sky(blue) and clear thin-cirrus(red) fractions are also shown.has a Gaussian intensity profile, having diameter, to the 1/e2 intensity level, of 24 cm, i.e. very short whencompare to the 5 km sections of CALIOP sensor data. If a cirrus cloud is located at 8000 meters above thetelescope site, then for a laser propagating at 45 degrees zenith angle, the 24 cm diameter subtends and angleof about 0.5 arcsec. If the cloud layer drifts with a mean wind of 20 m/s, the cirrus cloud section will cross thelaser beam diameter in only 12 ms.The variability of cirrus clouds can be studied by time-resolved stellar photometry, while observing throughthin cirrus clouds. To this end, a series of exposures was obtained using a Canon 60D digital single-lens reflex(DSLR) photographic camera equipped with a 250-mm focal length telephoto lens, for two reference stars.Exposures were taken every 2 seconds, with an exposure time of 200 ms. The camera was slightly defocusedin order to avoid saturation, as well as to spread the light of the star over several pixels and thus improve thephotometry. Aperture photometry, using the green channel, was then used to estimate the stellar fluxes. Figure6 shows the histograms for the variability in the photometry from observations of Arcturus and Vega. Thetime series shown in the upper panel of Figure 6 is that from observations of Arcturus. The first part of theobservations show a larger variability. This was found to be due to stray light so a baffle was added to protectthe lens. The histograms indicate variability at the 1-sigma level of 0.1 mag/airmass to 0.3 mag/airmass (10% to30%), respectively. The 10% to 30% level fluctuations are larger than the stellar brightness fluctuations expectedonly from scintillation, which, for the 58-mm aperture of the lens used in these observations is expected to be ofabout 4% to 5% [25, Eq. 2].4. ATTENUATION AND VARIABILITY IN THE ATMOSPHERIC PATHThe TMT first-light baseline plan consists on using six lasers that create the asterisms necessary to support theadaptive optics correction system. The plan includes the use of TOPTICA/MPB lasers consisting of continuouswave laser light of 22 W power at 589 nm wavelength, for the excitation of the D2a line of sodium atoms in the
mesosphere. It allows up to 10% of the laser power to be used for re-pumping§ of the D2b line.26, 27 As the laserlight propagates upward, it will experience losses due to scattering of light out of the beam due to small opticsaberrations in the beam transfer and laser launch telescope optical surfaces, as well as due to scattering by airmolecules, aerosols and cirrus cloud particles along the atmospheric channel in the propagation of the laser beamfrom the telescope to the mesosphere. The TMT has a requirement for the beam transfer optics throughput of75% (i.e. allow losses not to exceed 25% due to scattering of light out of the main beam arising from aberrationsin the optical surfaces and absorption in optical surface coatings).For the atmospheric channel, the scattering can be modeled by means of molecular Rayleigh scattering theory.The molecular angular volume scattering coefficient is the fraction of photons scattered out of laser light beamper steradian per meter of laser beam path. It is proportional to the molecular scattering cross-section, thenumber density of molecules, and the Rayleigh scattering phase function. A set of equations describing thisprocess is included in the work of Wang et al.12 A similar formalism has been used in this study to estimatethe optical depth of the atmosphere, at 589 nm wavelength, arising from Rayleigh molecular scattering for eachsite listed in Table 2. The vertical profile of the molecular number density, for each site, was obtained from theUS standard atmosphere [28, Table A.8, p. 1293]. Tables 4 summarizes the contributions to the total opticaldepth (τ ) from molecular, aerosol and cirrus scattering, and the overall atmospheric transmission (Tatm e τ ),for 589 nm and 532 nm wavelength respectively.Table 4. Optical depth at the various sites in this study, including contribution from aerosols, cirrus, Rayleigh scattering,and the Chappuis Ozone band, at wavelenghts of 589 and 532 nm. The total optical depths and atmospheric transmissionare computed using the median values for aerosol and cirrus cloud topical depths learned from the analysis of CALIOPsensor lidar data. Aerosol and cirrus optical depths are given for a wavelength of 532 nm, and are the same for 589 0.023 0.0600.029 0.0630.016 0.0410.016 0.0410.011 0.0300.011 0.0300.011 0.0270.011 0.0270.013 0.0250.013 0.0250.009 0.023τcirrus25%50%0.012 0.0490.025 0.0740.019 0.0700.019 0.0700.031 0.0830.031 0.0830.030 0.0900.030 0.0900.018 0.0510.018 0.0510.014 0.048τRayleigh5895320.045 0.0670.056 0.0850.057 0.0870.049 0.0740.053 0.0800.056 0.0850.055 0.0830.055 0.0840.053 0.0810.051 0.0770.037 0.056τozone5895320.031 0.0180.031 0.0180.031 0.0180.031 0.0180.031 0.0180.031 0.0180.031 0.0180.031 0.0180.031 0.0180.031 0.0180.031 0.018τtotal5895320.185 0.1940.224 0.2400.199 0.2160.191 0.2030.197 0.2110.200 0.2160.203 0.2180.203 0.2190.160 0.1750.158 0.1710.139 .53282%79%81%82%81%81%80%80%84%84%87%The aerosol and cirrus optical depths correspond to the 25% and 50% percentiles obtained from the CALIOP532 nm wavelength lidar data, and reported in Table 3. For Mie scattering, aerosols and cirrus clouds, theoptical depths for monochromatic light at 589 nm are about the same as those at 532 nm. This, because theirscattering efficiency are about the same, Qsca (532 nm) ' Qsca (589 nm), where Qsca is the scattering efficiencycoefficient. However, for Rayleigh scattering the optical depths will scale as the inverse of wavelength to the 4thpower, τ R (589 nm) τ R (532 nm)(532/589)4 .For completeness, the optical depth due to absorption by the Chappuis band, arising from ozone moleculesin the mesosphere, was included. The ozone optical depth is extracted for the 532 nm and 589 nm wavelengths,in units of mag/airmass, from Figure 15c in the work of Buton et al.29 and converted into optical depth usingτ 0.9210 magnitude.§TOPTICA/MPB defines the re-pumping power fraction (q) as the fraction of the power in the Na D2b line over thepower that goes to the Na D2a line (q PD2b /PD2a ).
Simulations of the propagation of the 589-nm wavelength laser beam through the attenuating atmospherewhere performed using the LGSBloch package¶ , implemented in Mathematica c , as an extension to the AtomicDensity Package (a collaboration of researchers Simon Rochester, at Rochester Scientific LLC, and Ron Holzlhnerat the European Southern Observatory).Table 5 shows the parameters used in the simulations for two sites, Mauna Kea and the Observatorio deRoque de Los Muchachos.Table 5. Parameters of the site and TMT laser used to estimate the LGS photon flux at two sites.ParameterZenith AngleLaser PowerLaser polarizationLaser spectral bandwidthD2b re-pumping (q)Na column densityLGS spot size (FWHM)Geomagnetic field B Magnetic zenithMagnetic azimuthSite altitudeAtmospheric optical depthAtmospheric transmissionPhoton flux return at siteTMT detection throughputNFIRAOS frame rateNFIRAOS subaperture areaDetected photoeventsMauna Kea 13N0 20 Wcircular1.34 MHz3010%4 1013 atoms/m20.6 arcsecs3.33 10 5 T36.41 189.57 4050 m0.185 nepers83%16.5 106 photons/m2 /s0.3477800 Hz0.52 m21793 photons/sub-aperture/frameORM0 20 Wcircular1.34 MHz3010%4 1013 atoms/m20.6 arcsecs3.70 10 5 T38.01 185.98 2250 m0.224 nepers80%14.7 106 photons/m2 /s0.3477800 Hz0.52 m21597 photons/sub-aperture/frameFluctuations of 30% in the cirrus optical depth, in time scales of a few seconds, will induce fluctuations oforder 5% in the overall photo-detected-events. This 5% fluctuation will be in addition to other fluctuations, suchas the natural variability of the sodium atoms column density.31 For the particular case of the ORM site, in theextreme case of a dust event characterized by an extinction of 0.2 mag/arcsecs (0.184 nepers) and a cirrus opticaldepth of 0.154 (75% percentile, as shown in Table 3), the atmospheric transmission will drop from 80% to 65%,in which case the photo-detected events will decrease to 1087 photons/sub-aperture/frame. This value is slightlyabove the TMT requirement of 900 photons/sub-aperture/frame needed for the successful determination of theLGS centroids in each sub-aperture in order to achieve the goal of 187 nm maximum wavefront error along theboresight direction.5. CIRRUS VARIABILITY AND LASER FRATRICIDELaser fratricide affects multi-laser AO systems, particularly when the laser beams are launched from behind thetelescope secondary mirror. The term fratricide is used here in the sense that back-scattered photons, in thepropagation of a given laser (in the multiple lasers configuration) are detected by the wavefront sensors observingthe LGS created by other lasers in the system. The backscattering of photons arises from the interaction of thelaser beam light with air molecules, as well as atmospheric aerosols (dust particles, or aerosols results of photochemical aggregation) and ic
cirrus clouds.17 For instance, randomly oriented crystals in ice clouds can introduce signi cant depolarization of the signal.18 Procedures proposed for the automatic detection of cirrus clouds from lidar data have shown that thin cirrus clouds do not exceed an optical depth of 0.3 nepers.19 Figure 2. Map of the Big Island of Hawaii.