Transcription
Assignment 8: Supervised Classification(60 Points Total)Data available under Resources Supervised Classification.You have been provided with a Sentinel-2 image of Vancouver, British Columbia(sentinel vancouver.img) that was provided by the European Space Agency (ESA) anddownloaded from the United States Geological Survey’s EarthExplorer. These data have beenprovided at a 10 m spatial resolution with the following band designations:Layer 1: Blue (Band 2)Layer 2: Green (Band 3)Layer 3: Red (Band 4)Layer 4: NIR (Band 8)Layer 5: SWIR (Band 11)Layer 6: SWIR (Band 12)For reference, these are the Sentinel-2 band designations.Sentinel-2 BandsBand 1: Coastal AerosolBand 2: BlueBand 3: GreenBand 4: RedBand 5: Red EdgeBand 6: Red EdgeBand 7: Red EdgeBand 8: Near Infrared (NIR)Band 8A: Narrow NearInfrared (NIR)Band 9: Water VaporBand 10: Shortwave InfraredCirrusBand 11: Shortwave Infrared(SWIR)Band 12: Shortwave Infrared(SWIR)Center Wavelength al Resolution 9029You have also been provided with a set of validation points (validation points.shp). The codesin the “class” field represent the following classes:
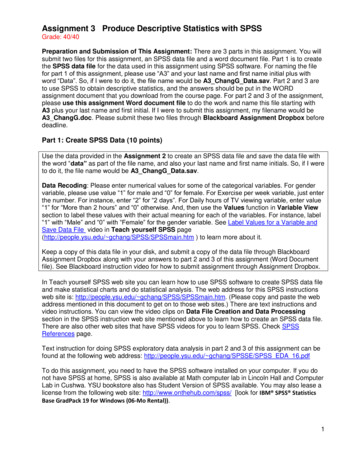
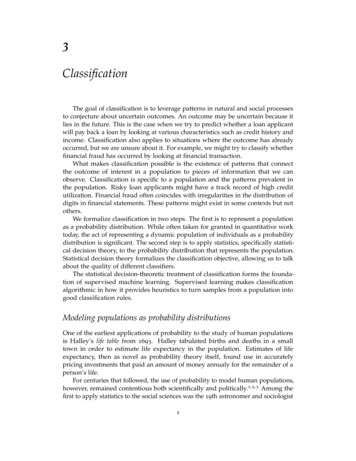
0 Water1 Developed2 Barren3 Forest4 HerbaceousThe examples below describe the classes of interest.DevelopedThis class will include all commercial, urban, and residential areas. Common features withindeveloped areas include buildings, roads, yards, and parking lots.
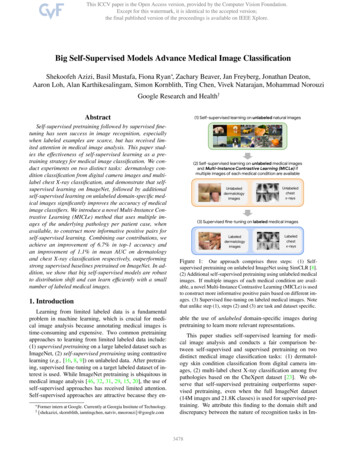
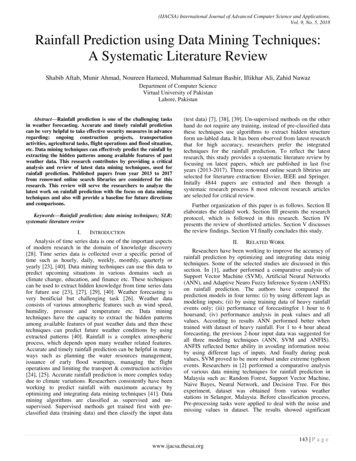
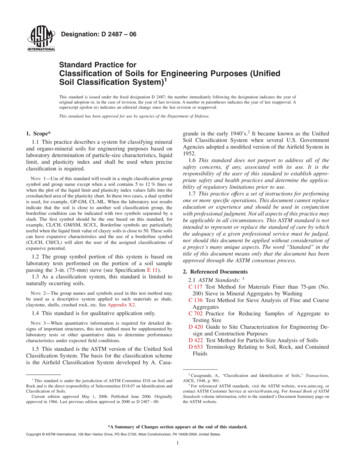
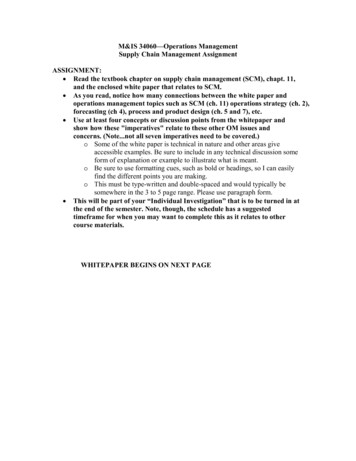
BarrenThis class will include non-vegetated areas not associated with development, such as bare rockor soil. This is not a common cover type in this image. However, there are some bare rocksurfaces in the mountainous area in the top part of the image north of the city.ForestThis class will include all forested areas in the image. Do not include small stands of trees inresidential areas.
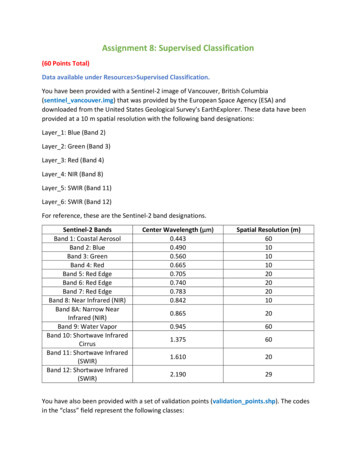
HerbaceousThis class will include vegetated areas that are not dominated by trees, such as fields,pastureland, and cropland.WaterThis class will include all water features, such as the ocean, ponds, lakes, and rivers.Description of ProblemProduce two land cover classifications that differentiate these five classes and compare themusing confusion matrices and the provided validation data. Use the Orfeo Toolbox within QGIS.You will need to do the following:
1. Create a shapefile in which to digitize your training data. Make sure to include a “class”field as an integer type. Use the codes for each class as defined in the validation data.2. Digitize a variety of examples of each type. Make sure to capture the full spectralvariability and variety within each class. Make sure to assign the correct code to eachsample. You can create training data as points or polygons.3. Compute statistics for the sentinel vancouver.img image using theComputeConfusionMatrix tool from the Orfeo Toolbox. Save it as an XML file.4. Train two classifiers using the TrainImageClassifier tool from from the Orfeo Toolboxand your training samples. You do not need to optimize the algorithms.a. SVM with RBF kernelb. Random Forests5. Classify the image using both models with the ImageClassifier tool from the OrfeoToolbox.6. Calculate confusion matrices for each classification using the ComputeConfusionMatrixtool from the Orfeo Toolbox. You will need to change the value for NoDATA pixels to 5since 0 is assigned to a class.Deliverables Create a single layout showing the input image, two classification results, and trainingdata over the input image. You should have a total of four map frames. Also include atitle and text labels for each map frame. Include the error matrices for bothclassifications. They should we well formatted and include the overall accuracy and classuser’s and producer’s accuracies. These can be formatted outside of QGIS and theninserted as images. Include a legend that explains the colors assigned to each class. Onthe layout, write a short paragraph to summarize the results of the algorithmcomparison and the sources of confusion between the classes. Render your results as aPDF.o The four map frames are well organized on the page. (6 Points)o Each map frame is labelled with text. (3 Points)o The same colors are used for each class in both classifications and to show thetraining data. (6 Points)o A descriptive main title and citation for the European Space Agency are included.(3 Points)o A north arrow and scale bar should be included for just one of the maps. (6Points)o The error matrices are well formatted, use the class names for the rows andcolumns as opposed to the class codes, and include the overall accuracy andclass user’s and producer’s accuracies. The counts in the table should berounded to whole numbers while the overall accuracy and class user’s andproducer’s accuracy should be rounded to three decimal places. (12 Points)
o The paragraph clearly summarizes the results by comparing the RF and SVMoutput in regard to overall accuracy. The paragraph should also include adescription of the sources of error or confusion between the classes. (12 Points)o The map should be overall neat, well organized, and use the space well. (12Points)
Sentinel-2 Bands Center Wavelength (µm) Spatial Resolution (m) Band 1: Coastal Aerosol 0.443 60 Band 2: Blue 0.490 10 . Cirrus 1.375 . 60 : Band 11: Shortwave Infrared (SWIR) 1.610 . 20 : Band 12: Shortwave Infrared (SWIR) 2.190 . . Use the codes for each class as defined in the validation data. 2. Digitize a variety of examples of each .