Transcription
IEEE TRANSACTIONS ON VISUALIZATION AND COMPUTER GRAPHICS, VOL. 18, NO. 12, DECEMBER 20122122A Data-Driven Approach to Hue-Preserving Color-BlendingLars Kühne, Joachim Giesen,Zhiyuan Zhang, Student Member, IEEE, Sungsoo Ha, and Klaus Mueller, Senior Member, IEEEAbstract—Color mapping and semitransparent layering play an important role in many visualization scenarios, such as informationvisualization and volume rendering. The combination of color and transparency is still dominated by standard alpha-compositingusing the Porter-Duff over operator which can result in false colors with deceiving impact on the visualization. Other more advancedmethods have also been proposed, but the problem is still far from being solved. Here we present an alternative to these existingmethods specifically devised to avoid false colors and preserve visual depth ordering. Our approach is data driven and followsthe recently formulated knowledge-assisted visualization (KAV) paradigm. Preference data, that have been gathered in web-baseduser surveys, are used to train a support-vector machine model for automatically predicting an optimized hue-preserving blending.We have applied the resulting model to both volume rendering and a specific information visualization technique, illustrative parallelcoordinate plots. Comparative renderings show a significant improvement over previous approaches in the sense that false colorsare completely removed and important properties such as depth ordering and blending vividness are better preserved. Due to thegenerality of the defined data-driven blending operator, it can be easily integrated also into other visualization frameworks.Index Terms—Color blending, hue preservation, knowledge-assisted visualization, volume rendering, parallel coordinates.1I NTRODUCTIONColor mapping and transparency are both frequently used in visualization. A color can be described by the values for luminance, hueand saturation. While luminance is mainly responsible for detectionof shape and state of movement [1], the sensitivity to the chromaticpart of a color stimulus, i.e., hue and saturation, allows humans to visually distinguish objects that are otherwise identical. Hence, colormapping, i.e. assigning a hue value to scalar data, is most often usedfor visual grouping and labeling of nominal data. In applications likeillustrative parallel coordinates [2] and volume rendering, color mapping is combined with transparency in order to avoid occlusions. Themost popular method for simulating transparency is the source-overoperator from the collection of the Porter-Duff operators [3], whichcreates a new color C as a weighted sum of two input colors A and B,C A · α B · (1 α ), α [0, 1].The over-operator is also referred to as alpha-compositing and illustrated in Figure 1.A drawback of alpha-compositing is the creation of false colors, i.e.,the hue of C is usually not one of A or B. This is problematic whenhue is used to encode nominal data. For example, blending betweena vivid red and green results in a slightly less saturated yellow. Ahue-preserving color blending scheme would choose C having eitherthe hue of A or B, but not necessarily the luminance and saturationvalues of A and B. In Figure 1 the hues are indicated by red linesegments. False colors can diminish the value of a visualization bycreating artifacts when C has a hue that exists already in the givencolor palette, but also when the hue is not present in the given palette.False colors with a valid interpretation in the defined color palette canlead to misinterpretations, e.g., as a material property of a certain typerather than the overlapping of two different materials. False colors Lars Kühne and Joachim Giesen are with the Institute of ComputerScience at Friedrich-Schiller-Universität Jena,E-mail: Lars.Kuehne@uni-jena.de and Joachim.Giesen@uni-jena.de. Zhiyuan Zhang, Sungsoo Ha, and Klaus Mueller are with the VisualAnalytics and Imaging Lab, Computer Science Department, Stony BrookUniversity, E-mail: zhiyuzhang@cs.sunysb.edu, pt received 31 March 2012; accepted 1 August 2012; posted online14 October 2012; mailed on 5 October 2012.For information on obtaining reprints of this article, please sende-mail to: tvcg@computer.org.1077-2626/12/ 31.00 2012 IEEEwhose hues are not present in the given color palette may introducevisual clutter.The goal of this work is to build a hue-preserving color blendingoperator, that, while eliminating false colors, perceptually preservesimportant information present in layered data, in particular depth information. Also, the blending result should be perceptually close tothe result from alpha-compositing in terms of vividness. However,the goals of hue-preservation and perceptual closeness to the result ofthe Porter-Duff source-over operator are conflicting. Hue-preservationcan by definition be achieved by using colors close to, or exactly on thegray axis as the blending result, i.e., by desaturation. But as colors getmore and more desaturated, the perception of hue information is alsodiminished, and vanishes entirely on the neutral gray axis. The huepreserving color blending problem deals with the trade-off betweenthe two goals. Recent approaches [4, 5] tackle the problem with ana-priori solution, but have not yet found the optimal balance betweenthe two objectives. Therefore, we propose a data driven approach, thatstrives for capturing important color aspects worth pertaining, whilepreserving the hue of the input colors. The proposed solution is ageneric adaption of the standard Porter-Duff source-over operator, andtherefore easy to integrate into any visualization application that usesalpha-blending, but requires hue preservation.This paper is organized as follows. In the next section we discussthe state-of-the-art in hue-preserving color blending and work relatedto our data driven approach, especially the knowledge-assisted visualization paradigm. In Section 3 we briefly review the basics of colortheory and also support vector machines, a machine learning tool thatwe have used for data analysis. In Section 4 we state the problem ofhue-preserving color blending formally and describe the data drivenapproach and the visual interface that we have used to collect datafrom users. In Section 5 we provide some information on how wehave collected data for generating an actual blending operator. Theanalysis of the data is then described in Section 6, i.e., it is describedhow to compute a blending operator from the data. We have appliedthe resulting blending operator in two applications, illustrative parallelcoordinates and volume rendering. Both applications are described inSection 7. We conclude the paper with a discussion of our results inSection 8 and some concluding remarks in Section 9.2R ELATED WORKWang et al. [4] explain the problem of false colors in the context ofconstructing a color palette for illustrative visualization. They pointout that the problem of false colors can be circumvented by blendingopposing colors on a color wheel. If it is not possible to choose thePublished by the IEEE Computer Society
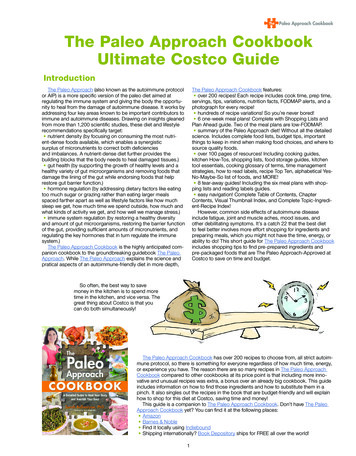
IEEE TRANSACTIONS ON VISUALIZATION AND COMPUTER GRAPHICS, VOL. 18, NO. 12, DECEMBER 20122124stands for the representation of the CIELab space in the cylindricalcoordinates lightness, chroma and hue. Subsequent improvements oncolor distance measures include the E94 and E00 color distance metrics, that introduce more complex distance formulas to compensate forerrors in the E metric.3.2 Support Vector machinesSupport Vector Machines (SVMs) are a popular family of machinelearning techniques for supervised classification (and regression) problems. Given a data matrix X Rm n , i.e., m data points xi in dimension n, together with a vector of labels Y Lm , where the i’th entry inY corresponds to the sample in the i’th row in X, the task is to learna predictor that associates to every point in Rn a label from the labelspace L. If L is a finite set, then the learning problem is called a classification problem, and if L R, then it is called a regression problem.The special case when L contains only two elements is called a binaryclassification problem.Support vector machines are based on sound principles (see thebook by Steinwart and Christmann [15]) and are phrased as optimization problems. A binary classifier, i.e., the case where L { 1, 1},can be computed from the solution of the convex quadratic programm1min kwk2 C · ξi2w,bi 1s.t. yi (w xi b) 1 ξi , ξ 0as the following function(1)Extensions from binary classification to multi-class classification andregression are well known [16]. Support vector machines and similarly also support vector regression basically compute optimized hyperplanes as predictors or regressors, respectively. But they can beturned non-linear by applying the so called kernel trick (see for example the book by Schölkopf and Smola [16]). The kernel trick replacesthe standard Euclidean scalar product by a positive kernel. Importantpositive kernels are the Gaussian kernelk(xi , x j ) exp γ xi x j2 cr c f · α f (1 α f ) · cbcr c f · α f cb · (1 α f ) · αb ,(2)α f : α f (1 α f ) · αb(3), where Equation 2 states the back-to-front and Equation 3 the frontto-back compositing scheme. Where c f , α f and cb , αb are the colorsand alpha-values of the front- and the back layer, respectively. Bothcompositing schemes are technically equivalent and in general not huepreserving. Hue-preserving color blending seeks to find ĉr close tocr whose hue (H value) is among or close to one of the hues of thedifferent layers. Hence, the problem becomes to find a hue-preservingmapping[c f , cb , α f ] or [c f , cb , α f , αb ] 7 ĉr .Since any additional dimension of the problem space increases thedata-gathering effort in a data driven approach, we specify every problem instance by only three parameters, i.e., by a vector [c f , cb , α f ].4.2 Solution space explorationIn principle, there are at least two data driven strategies for solving the problem of false colors, i.e., to define or compute a mapping[c f , cb , α f ] 7 ĉr , namely:TRn x 7 sign(wT x b).before it reaches the observer’s eye. Hence, also for rendering thecase of multiple layers can be reduced to an iterative sequence of twolayer problems. This still leaves two options: the information can beaccumulated either from the front to the back layer, or the other wayaround. The two options lead to two compositing schemes:with γ 0,and inhomogenous polynomial kernels k(xi , x j ) (xiT x j c)d , c 0.4 T HE DATA DRIVEN APPROACHState of the art techniques for hue-preserving color blending, as discussed in Section 2, take a hypothesis based approach. In contrastto that we follow a data-driven approach inspired by the principles ofknowledge-assisted visualization (KAV) [9]. One can think of a datadriven approach as a KAV-based solution, where knowledge (aboutoptimal parameter values for a particular visualization technique) isgathered implicitly rather than explicitly. That is, we do not aim forexplicit (externalized) domain expert knowledge, but elicit data fromusers on examples of blending problems. That also means that wepursue an active data collection strategy, i.e., we do not collect databy passively observing users while working with visualizations thatinvolve color blending, but ask them actively about their preferencesby using specifically designed interfaces to collect the data.4.1 Problem specificationBefore describing how we have collected data implicitly comprising the domain knowledge and preferences for hue-preserving colorblending, we first want to specify the question that has to be answeredfrom the data.Generally, rendering a scene with multiple colored semi-transparentlayers results in pixels that represent several layers and the question ishow to integrate the information from the different layers at a givenpixel. Hadwiger et al. [17] point out that when looking at a real scene,color information is accumulated iteratively at every physical layer1. Transforming the input vector [c f , cb , α f ] into some vector[ĉ f , ĉa , α̂ f ] based on user data and applying the standard blending formula 2 to the transformed vector. This approach is similarto the one taken Wang et al. and Chuang et al. (see Section 2).2. Inferring the color cr directly from the user data without the additional evaluation of a blending formula.We have pursued both strategies and want to refer to the first strategy as Problem Transformation and to the second strategy as DirectSolution. In the following we describe how we have implemented thetwo strategies and why the second strategy works better for us.4.2.1 Problem transformationWe have designed an interface (see Figure 3) for data gathering thatgives the user full control over the solution space [ĉ f , ĉb , α̂ f ]. Herethe solution space coincides with the problem space since we wantto transform a given problem instance to another problem instance towhich the standard blending formula is then applied. The interface hascontrols to manipulate the value (V ) and the saturation (H) in the HSVspace for both input colors c f and cb , and one control for modifyingthe alpha value α f (since αb can be assumed to be 1 in back-to-frontcompositing). Hence, the interface has five controls in total. ThroughFig. 3. A prototype interface. This version was not used for the final datacollection.
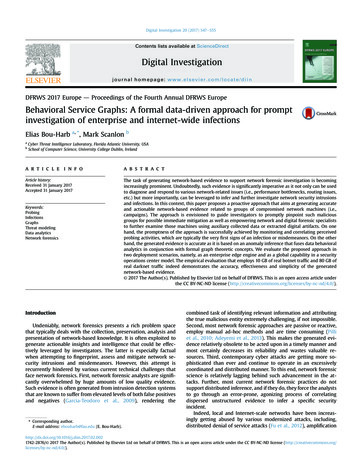
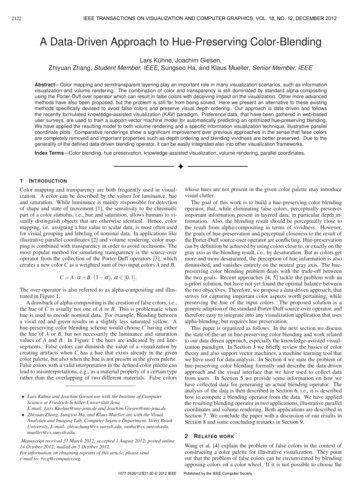
KÜHNE ET AL: A DATA-DRIVEN APPROACH TO HUE-PRESERVING COLOR-BLENDINGthe controls the user can transform the given problem instance, namelytwo overlapping disks with colors c f and cb , respectively, that are presented on top in the middle of the interface. The color in the overlapof the two disks in the problem instance is obtained from applying thestandard blending formula for [c f , cb , α f ]. The second pair of overlapping disks at the bottom in the middle of the interface shows thesame disks, but now the color in the overlap region is computed by thestandard formula for the transformed instance [ĉ f , ĉa , α̂ f ] as specifiedby the user. The task for the user is to modify the original probleminstance such that the overlap region for the lower pair of disks doesnot show a false color and stays perceptually close in terms of depthordering and vividness to the original blending on top.It turned out that the five-dimensional solution space is too large tobe well explored even for users that are familiar with the topic of falsecolors or color science in general. Also, the impact of each parameteron the final blending is oftentimes not clear since the impact is onlyindirect through the evaluation of the blending equation. The highcognitive workload on the user results also in a long time to acquirejust a single data point.A possible way to reduce the search space is to reduce the number of dimensions, e.g., by fixing of the transparency channel α f , orto subsample each dimension. Subsampling can turn the continuoussolution space finite, and the problem of the solution space becomesa finite choice problem, i.e., picking the best solution from a finitechoice set. The interface to choose from such a choice set can be simplified with techniques that we describe in Section 4.2.2, but it wouldstill be more complex to be used effectively than the solution that wedescribe next.4.2.2 Direct solutionFor the direct solution we also use a finite choice approach, but nowwithout evaluating the blending equation. Thus the choice set, i.e., afinite set of colors ĉr for each problem instance [c f , cb , α f ], has beenconstructed differently than in Section 4.2.1. To construct the choiceset we exploit the fact that only a “small” subspace of the color spacequalifies as possible answer, namely the set of colors with either oneof the hues of c f or cb . In color spaces with cylindrical coordinates,like CIELCh, all colors with the same hue lie on a plane spanned bythe lightness and chromaticity axes.2125set in a linear fashion, in order to keep the cognitive workload of the2D exploration as low as possible. For that, the colors in the choice sethave been ordered linearly, such that colors that are close with respectto the linear order are also perceptually close (using the E metric).We have determined that this allows the user to narrow the potentialbest choices from the choice set down quickly, by ruling out candidates that lie far from potential candidates. Hereby, the challenge isto order a sampling of a two-dimensional subspace of the color spacelinearly. We have addressed this by sampling the two-dimensionalsubspace along a continuous space filling curve, more specifically aHilbert curve [18] (see Figure 5).LCFig. 5. Locality preserving linear ordering of samples from a hue plane(here green). Shown at the top are the samples and their ordering alonga space filling curve from the lower-left to the upper-right corner. Shownon bottom is the resulting order of the colors laid out in rows from top tobottom.Besides locality preserving exploration of the two-dimensionalsample space along a path, the interface allows for directly jumpingto distant colors. This specifically includes user marked colors, thatwere considered as potential best choices during the exploration, inorder to get back to them quickly at any time, if necessary.5 DATA COLLECTION We have collected data points of the form [c f , cb , α f ], ĉr over theWeb using the interface shown in Figure 4. The data points will beused later to learn a good mapping [c f , cb , α f ] 7 ĉr .LbCεCoppaFig. 4. Final user-interface. This version was used to collect the preference data.We have designed an interface (see Figure 4) that allows to explorethe choice set with lower cognitive effort than required for the problemtransformation approach. As before, the overlapping disc pair at thetop provides a reference to the standard alpha-compositing blendingresult. The lower disc pair renders the blending color in the overlapregion computed directly from the user’s selection. Therefore, the interface has now only one control that allows to browse along the choiceFig. 6. A cross-section of CIELab space orthogonal to the lightness axis.The disk at the center with radius ε defines a color region that appearsachromatic to the human visual system.In the following we first describe a strategy that we have employedto reduce the number of necessary data points, before we discuss theircollection. As has been discussed already by Wang et al. [4], colorsthat lie on opposite sides of the color circle do not result in false colors when they are blended together, because the two hue axes coincideon a common line that intersects with the gray axis. Although exact
2126IEEE TRANSACTIONS ON VISUALIZATION AND COMPUTER GRAPHICS, VOL. 18, NO. 12, DECEMBER 2012opposition is rarely the case because of rounding errors or a randomsampling, the idea of Wang et al. can still be used to reduce the number of sample points, i.e., problem instances. The idea is, that if theline segment that connects two colors in a color circle that need tobe blended intersects a small disk centered at the center of the colorcircle (which lies on the gray axis), then the hue of the result of alphablending the two colors cannot be distinguished perceptually from oneof the two original hues (see Figure 6).Of course the radius ε of the disk needs to be small enough to guarantee this property, that represents a continuous extension to the discrete evaluation of the opposite color predicate. We chose the radiusε such that the colors in the disk seem achromatic to the human visualsystem. The intuition behind this approach is that all colors in the truncated cone whose apex is C and whose opening angle is determined bythe disk with radius ε (see again Figure 6) can be considered perceptually opposite to C. The cone is truncated at the line that is passingthrough the center of the color circle and is orthogonal to the line segment from C to Copp , where Copp is an actual opposing color of C. Thetruncated cone is shown in orange in Figure 6, and the analogous truncated cone for Copp is shown in yellow. The tolerance disk with radiusε allows to define predicates that given two colors, determines their relationship in terms of perceptual opposition and equivalent hue-angle.With these predicates it can be decided if the blending result ĉr of aproblem instance [c f , cb , α f ] can be computed by alpha-compositing(without creating precptually false colors), or has to be inferred fromthe collected data. The decision rules are as follows:- If α f is either 0 or 1, then the blending result is either cb or c f ,respectively, and thus can be set directly- If c f and cb are opposing colors; this can be decided by checking if the line-segment connecting the two colors intersects thetolerance disk with radius ε .- If the colors c f and cb have the same hue; this can be decided bycreating Copp for c f (see once more Figure 6), and performingthe color opposition test for Copp and cb .Note, that if one of the colors c f or cb is perceptually achromatic,then the opposite-color-check will always evaluate positive, and thusthe blending can be computed directly. Blending with an achromaticcolor does not create any false colors, thus adding achromatic colorsto the survey samples does not increase the complexity of the survey, however, this stabilizes the learned model along the lightnessaxis. Also, we did not exploit the symmetry between [c f , cb , α f ] and[cb , c f , 1 α f ] in the standard alpha-compositing setting, because itis not obvious, why such a symmetry should hold for hue-preservingcolor blending.It remains to describe how we have determined the radius ε of thetolerance disk. For that we have conducted another web based survey.We have sampled CIELCh space close to the gray axis at six equidistant hue angles, and along each hue angle in steps of 4 chromaticityunits from 4 to 20, and at six equidistant lightness levels from 0 to100 units on the CIELCh lightness scale. Each of these 180 samplepoints was presented to participants in our survey together with sample points with similar lightness values that have been sampled exactlyfrom the gray axis. The participants had to identify the unique chromatic sample point among 16 sample points that were presented in agrid of 4 4 colored patches. The radius ε of the tolerance disk hasthen been chosen such that the disk does not contain any sample pointthat has been identified correctly as the chromatic one in at least 80%of the answers for that sample point.The data for this survey have been collected over the course of twoweeks from more than 120 participants who contributed a total of 2457answers, i.e., about 20 decisions per participant and 14 answers persample point.We observed that the chromaticity-sensitivity that has been probedin this survey is hue-angle independent but depends on lightness value.Resulting values for the radius ε are listed in Table 1.Finally, we are ready to describe how we have sampled data pointsfrom the function [c f , cb , α f ] 7 ĉr . The problem instances [c f , cb , α f ]Table 1. ε -Radius for the Tolerance Disk, depending on the lightnessvalue in CIELCh space.lightness level 2020 to 80 80chroma tolerance ε15.010.020.0have to be represented in a specific color space. Since the data havebeen collected over the Web we cannot assume that the monitors ofthe participants of our survey support a color gamut that is larger thanthe sRGB color space. Hence, the sample points have been sampledrandomly from sRGB space such that any point in sRGB has a samplepoint at distance at most 60 E . This results in 16 sRGB samples(including five equidistant achromatic colors added afterwards). Together with a sampling of the alpha-channel α f in increments of 0.25,this resulted in a total of 1280 sampled problem instances. Out of these129 had to be evaluated by participants of our Web based survey usingthe interface from Figure 4. The remaining instances can be blendedautomatically. For each of the 11 chromatic sRGB samples, we sampled the corresponding hue-plane in CIELCh space such that any pointhas a sample point at distance at most 15 E , leading to an average of50 alternative colors ĉr on the interface slider.Over the course of 4 weeks, we have collected 1851 choices from133 participants, most of them students and people with an academicbackground, however not necessarily color science experts. Initially,every participant had to answer to at least 20 choices, however later wereduced this to 10 choices, in order to reduce the cognitive workloadon the participants and to obtain answers of high quality in at most20 minutes. The participants did not evaluate any problem instancetwice. On average, each of the 129 problem instances was presentedto 14 participants.6 DATA A NALYSISThe goal of the data analysis is to learn a functionR7 [c f , cb , α f ] 7 ĉr R3from the user feedback that has been gathered via the Web using theinterface shown in Figure 4. The perceptual non-uniformity of sRGBcan cause non-linear dependencies between the input vector and thegathered label. To circumvent this problem the color coordinates of theinput colors c f and cb have been transformed from sRGB to CIELabcoordinates, i.e any problem instance can be represented as[L f , a f , b f , Lb , ab , bb , α f ]using the CIELab coordinates L, a and b. At a first glance the learning problem at hand looks like three regression problems, namely oneregression problem for each coordinate of ĉr (lightness, chroma andhue). However, the hue of ĉr is by definition either the hue of c f or cb ,and thus can be determined by a binary classification. Predicting thehue angle of the blending color by regression can produce false colors,even if the prediction is only a little bit off. Thus, binary classificationis both more efficient to evaluate and more reliable in the sense of huepreservation.As mentioned before, we had 1280 problem instances in total wherea problem instance now is given as point in seven dimensional Euclidean space R7 . The number of data points that we enter into thesupport machine or regression machinery is higher though, becausethe same problem instance has been evaluated by several participantsin the survey. We handle this as follows: we add one constraint to thesupport vector/regression optimization problem (see Section 3.2) forevery problem instance and chosen alternative ĉr and weigh the slackvariables xi for the i’th constraint by the number of times wi that participants have chosen the particular alternative ĉr , i.e., the objectivefunction of the support vector machine is modified as follows,m1min kwk2 C · wi · ξiw,b 2i 1
KÜHNE ET AL: A DATA-DRIVEN APPROACH TO HUE-PRESERVING COLOR-BLENDINGLuckily, the modified support vector machine/regression instancescan still be solved using the popular, publicly available LIBSVMsolver [19]. We used this solver together with polynomial and Gaussian kernels. Parameters like the regularization parameter C in theobjective function of the support vector machine and kernel hyperparameters have been set using cross-validation which is supportedby LIBSVM. It turned out by using cross-validation that in our casethe solutions of the kernelized optimization problems outperform theirlinear counterparts, and the polynomial kernel slightly outperforms theGaussian kernel.Finally, the solutions to the two regression and one classification problems provide us with the mapping from problem instances[c f , cb , α f ] to a blending color ĉr [L̂r , Ĉr , ĥr ]. Pixel-wise evaluationof the three functions is computationally expensive. The SVM basedblending operator on our dataset is about 20 times as expensive asalpha-compositing. Therefore, we used solution pools to avoid evaluating any problem instance twice. This has been sufficient for our applications where the images have been rendered off-line. Note though,that by construction the evaluation of the three functions is easily parallelizable. Hence, we recommend a GPU based function evaluationfor achieving real-time, interactive frame rates, especially in volumerendering.72127the right, but below it in the central overlap region. But as can be observed this consistency property is satisfied in this test case. Also,thegoal of preserving the depth-ordering has been achieved. Note that wehave enforced this goal as a constraint during the Web based data collection, and this constraint carries over to the support vector models.Another notable difference to the other methods is that the lightness ofthe lower layers is higher. This has not been enforced as a constraintin the data collection phase, but surprisingly for us it supports the perception of the shape of the underlying layers nicely, without sacrificingthe perception of the correct depth ordering.7.2 Illustrative parallel coordinatesFigure 8 to 10 show results that have been obtained after integratingthe data driven blending operator into the rendering software for illustrative parallel coordinates (IPC) by McDonnell et al. [2].A PPLICATIONSWe have integrated our data driven blending operator in an illustrative parallel coordinates framework, and have also used it for volumerendering. In both applications we have blended two layers at a timein back-to-front order, where blending results are always fed into thenext blending iteration as the back layer. But before we discuss bothapplications in more detail, we will first discuss the performance ofour blending operator in a synthetic test case.7.1Synthetic test caseFigure 7 compares the blending operators defined by Wang et al.,Chuang et al. and our approach on a synthetic test case with threesemi-transparent squares on a black background. A rendering usingalpha-compositing is also shown for reference. The test case is probably the most difficult co
hue-preserving color blending formally and describe the data driven approach and the visual interface that we have used to collect data from users. In Section 5 we provide some information on how we have collected data for generating an actual blending operator. The analysis of the data is then described in Section 6, i.e., it is described