Transcription
Success StoryA Data-Driven Systems Approach to ImprovingEmergency CareEXECUTIVE SUMMARYHealth systems can directly impact the quality of emergencydepartment (ED) care by reducing the time patients wait betweenarrival and seeing a qualified medical professional. Long ED waittimes can reduce patient satisfaction and put patients at risk.Mission Health determined that patients in its ED often waited morethan 50 minutes to receive qualified medical care. To decrease thiswait time, the hospital system sought to improve its ED patient flow.Using data-driven insights provided by use of its analytics platform,Mission could visualize each portion of the ED patient flow, enablingthe improvement team to identify and respond to opportunities forprocess improvement.Using this strategy, Mission achieved the following:HEALTHCARE ORGANIZATIONCommunity Hospital SystemPRODUCTSHealth Catalyst AnalyticsPlatform, includingthe Late-Binding Data Warehouse andbroad suite of analyticsapplications89 percent relative reduction in the rate of patients wholeft without being seen (LWBS), resulting in the currentperformance of 0.4 percent.29 percent relative reduction in the time from discharge orderto ED departure time.24 percent relative reduction in the median length of stay(LOS) for patients who are discharged.EMERGENCY DEPARTMENT PATIENT FLOW: A MAJOR PLAYERIN QUALITY OF CAREIn 2012, the ED visit rate in the U.S. was 42 visits per 100 people.1Of 130.4 million visits to the ED, 9.3 percent result in a hospitaladmission. This contributes to more than half of all U.S. hospitalsreporting over-crowding, one-third reporting an increase inambulance diversion, and 90 percent reporting that they frequentlyoperate “at” or “over” capacity.2Mission Health’s Emergency Services include western NorthCarolina’s designated Level II Trauma Center at Mission Hospital,select telehealth specialties at regional hospitals with medicaldirection provided by Mission Hospital-based specialists, groundCopyright 2017 Health Catalyst1
Using a data-driven,systems approach helpedus achieve our goals. Youneed data, and stakeholdercommitment, to improve.Rick Lee, MSN, RN, CEN, NE-BCExecutive DirectorEmergency Servicestransportation by Regional Transport Services (RTS), and airtransport provided by Mountain Area Medical Airlift (MAMA)—bothtransportation services can provide transport for neonatal patients.Mission strives to provide world-class care to people and theirfamilies when they need it most with the aim to get every personto the desired outcome, first without harm, also without waste, andalways with an exceptional experience for each person, family, andteam member. The hospital system targeted improving ED care aspart of its efforts to better its services overall.GROWING EMERGENCY DEPARTMENT VOLUME DEMANDEDIMPROVED WORKFLOWMission faced challenges in its ability to deliver effective emergencyservices. Large numbers of patients—upwards of 4,000 per year—were walking out of the ED without being seen by a provider. Onaverage, patients waited more than 50 minutes to see a qualifiedmedical provider after being triaged by the registered nurse.Wait time is a significant quality issue because the number ofminutes from patient arrival to being seen by a qualified medicalprovider negatively impacts patient satisfaction. Long waits can alsoput patients at risk.Mission recognized the growth in ED patient volume hindered patientplacement and throughput. Patients spent an excessive amountof time in the ED waiting for an inpatient bed or for the informationthey needed for an effective discharge which was impacting patientsatisfaction and negatively impacting Mission’s ability to provide careto newly arriving patients.To improve patient experience, the timeliness of care, and EDthroughput, Mission redesigned its ED workflow to ensure it metpatient needs efficiently. To be successful, they needed actionabledata, along with engagement from not only the interdisciplinary team,but from the entire hospital system.A DATA-DRIVEN, SYSTEMS APPROACH TO EMERGENCYDEPARTMENT IMPROVEMENTMission improved its ED patient flow, patient experience, and EDthroughput with a data-driven, systems approach. Because factorsinside and outside the ED impacted care within the department,Mission focused its improvement strategy on the entire deliverysystem. These internal and external influencing factors included:The way patient volume, arrival time, staffing, and workflowwithin the ED impacted ED throughput.Copyright 2017 Health Catalyst2
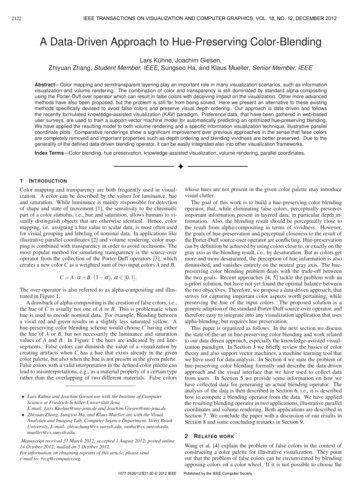
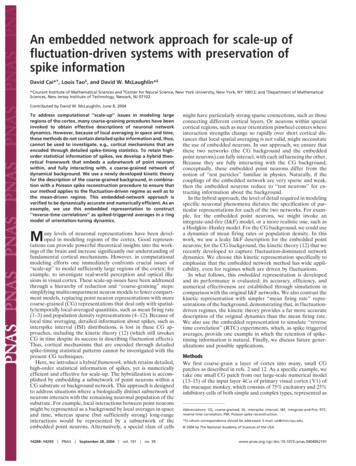
We have numerousimprovement effortsunderway. When youare focused on manyimprovements, data andanalytics become evenmore important. You cannotsucceed without it.Rick Lee, MSN, RN, CEN, NE-BCExecutive DirectorEmergency ServicesWhen inpatient units were full, the ED could not admitpatients—which limited its ability to provide care to patientsarriving to the ED, and increased wait time.When patient volumes peaked, responsiveness from supportdepartments, such as laboratory and environmental services,impacted ED throughput and the ability to transfer new arrivalsto an ED bed.To ensure interdisciplinary participation, Mission established the EDjoint practice team, which included physicians, advanced practiceproviders, ED nurses, quality improvement specialists, leadersfrom various departments within the hospital, representatives fromradiology, pharmacy, registration, behavioral health, environmentalservices, EMS, laboratory, staff education, and security. All ED jointpractice team members contributed their expertise and perspectivesto process improvement activities in keeping with Mission’s goals.As a result of the ED joint practice team’s active support andparticipation, and data-driven insights provided by the HealthCatalyst Analytics Platform, including the Late-Binding DataWarehouse and broad suite of analytics applications, Missionembarked on a systems-approach journey to redesign workflowwithin the ED.Using the analytics application to analyze volume data for theprevious four years, the Mission analytics team and ED leadershipenhanced their understanding of visit volume and arrival time,evaluating arrivals every three minutes. This breadth of historicaldata gave Mission a deep understanding of patient volume andthe impact of seasonality and holidays on both visit time andvolume. The joint practice team used these identified trends toadjust staffing volumes to better align with peak days and hoursthroughout the year.The Health Catalyst Analytics Platform provided a visualization ofeach portion of the ED patient flow and satisfaction with care (seeFigure 1), including:Time from arrival to time assessed by a qualified medicalprovider.Percentage of patients who LWBS.Time from arrival to disposition order.Percentage of patients who left before completing treatment.Time from discharge order to ED departure time.Copyright 2017 Health Catalyst3
LOS for patients who are discharged and admitted, andpatients with a behavioral health diagnosis.Patient satisfaction outcomes.FIGURE 1. SAMPLE EDEXPLORER APPLICATION11 Filters to select measure ofinterest.2 Visualization ofperformance.2Figure 1. Sample ED explorer applicationData and analytics were a vital part of Mission’s ED improvementinitiative. The data demonstrated that when Mission received 30arrivals within an hour, 50 arrivals within two hours, or 65 arrivalswithin three hours, the ED became congested and throughputslowed. Based on this, Mission invested in workflow observationand redesign, making changes to improve high-impact workflows.The hospital system restructured the registration process, whichimproved patient privacy and efficiency. It redesigned the triageprocess, which ensured the alignment between the triage processand the most recent, evidence-based practice.Mission also introduced a new role: an advanced practitioner, whowould evaluate patients in conjunction with the triage nurse, allowingmore timely initiation of care for patients who were not critically illand would otherwise wait for care.Improvements continued following triage: higher-acuity patients wereplaced in regular treatment rooms. Patients who were not critically illwere treated in a more space-efficient area.Mission also developed a process and protocol for quicklyresponding to surges in ED volume. Rather than waiting to discovera halt in throughput after an increase in patient volume, the systemdeveloped a proactive response to increased patient arrivals(defined as more than 30 patients in an hour, 50 within two hours,or 65 within three hours). Using automated, secure text messaging,alerts notified key stakeholders to activate surge protocols.Copyright 2017 Health Catalyst4
When prompted, support departments—including environmentalservices, laboratory, and radiology—responded to the surgenotification. Mission adjusted staffing and services to ensurecontinued throughput within the ED and the locations of care wheresome ED patients are admitted. Patient experience representativesalso responded to the surge notification, increasing the time theyspent in the ED waiting room helping mediate patient dissatisfaction.To ensure continued patient throughput throughout the hospital, theED throughput coordinator worked with leaders and staff to redirectresources as needed.The executive team and leaders responsible for ED throughputhuddled early each morning to review the number of patients in theED and developed plans of action to ensure patients were receivingtimely care and effective ED throughput.While implementing these standard ED processes, Missionmaintained flexibility, empowering the team to adjust patientplacement, staffing, and processes in response to unanticipatedchanges in patient types and volumes.Mission also redesigned its discharge process. Previously, it had asingle discharge location, to which patients awaiting discharge weremoved. Research revealed patient dissatisfaction with the dischargeprocess, and that the protocol inadvertently increased waste aspatients were moved (and increased wait time for the patients).Mission brought the discharge activities back to the bedside,eliminating unnecessary patient movement.RESULTSIn a little over one year, Mission’s data-driven, systems approachdramatically improved all aspects of ED throughput, including:89 percent relative reduction in LWBS rate, with the currentperformance at 0.4 percent.The advanced practice provider role in triage improved thetimeliness of care and decreased the LWBS rate.29 percent relative reduction in the time from discharge orderto ED departure time, a 24 percent relative reduction in themedian LOS for patients who are discharged, a 15 percentrelative reduction in median LOS for patients who are admitted,and a 42 percent relative reduction in median LOS for patientswith behavioral health needs.Mission credits its ED waste reduction to eliminatingunnecessary patient movement and restoring dischargeactivities back to the bedside.Copyright 2017 Health Catalyst5
Changes in triage and treating patients who are not asacutely ill in a more space-efficient environment alsocontributed to a decreased LOS.With these changes, patient satisfaction—the overall rating ofcare—doubled.WHAT’S NEXTMission is focused on the continued use of a data-driven, systemsapproach to improvement, strengthening its ability to deliver worldclass emergency care.REFERENCES1. Hing, E. & Rui, P. (2016). Emergency department use in the country’s fivemost populous states and the total United States, 2012. NCHS data brief, no252. National Center for Health Statistics. Retrieved from .htm2. The Joint Commission. (2016). Specifications manual for national hospitalinpatient quality measures. Retrieved from https://www.jointcommission.org/specifications manual for national hospital inpatient quality measures.aspxABOUT HEALTH CATALYSTHealth Catalyst is a next-generation data, analytics, and decisionsupport company committed to being a catalyst for massive,sustained improvements in healthcare outcomes. We are theleaders in a new era of advanced predictive analytics for populationhealth and value-based care. with a suite of machine learningdriven solutions, decades of outcomes-improvement expertise, andan unparalleled ability to integrate data from across the healthcareecosystem. Our proven data warehousing and analytics platformhelps improve quality, add efficiency and lower costs in support ofmore than 85 million patients and growing, ranging from the largestUS health system to forward-thinking physician practices. Ourtechnology and professional services can help you keep patientsengaged and healthy in their homes and workplaces, and we canhelp you optimize care delivery to those patients when it becomesnecessary. We are grateful to be recognized by Fortune, Gallup,Glassdoor, Modern Healthcare and a host of others as a BestPlace to Work in technology and healthcare.Visit www.healthcatalyst.com, and follow us on Twitter, LinkedIn,and Facebook.Copyright 2017 Health Catalyst
participation, and data-driven insights provided by the Health Catalyst Analytics Platform, including the Late-Binding Data Warehouse and broad suite of analytics applications, Mission embarked on a systems-approach journey to redesign workflow within the ED. Using the analytics application to analyze volume data for the