Transcription
Solvency II Standard Formula andNAIC Risk-Based Capital (RBC)Report 3 of the CAS Risk-Based Capital (RBC) Research Working PartiesIssued by the RBC Dependencies and Calibration Working Party (DCWP)Abstract: The purpose of this paper is to describe the main features of the Solvency II Standard Formulawhen applied to a property casualty insurer and compare those features of the Solvency II Standard Formulato the U.S. National Association of Insurance Commissioners Risk-Based Capital formula. The comparisonhelps clarify the assumptions and methods used by the U.S NAIC RBC and Solvency II Standard Formula.This is one of several papers being issued by the Risk-Based Capital (RBC) Dependencies and CalibrationWorking Party and the Underwriting Risk Working Party (collectively known as the RBC Working Parties).Keywords. Risk-Based Capital, Solvency, Capital Requirements, Insurance Company Financial Condition,Internal Risk Models, Solvency Analysis, Analyzing/Quantifying Risks, Assess/Prioritizing Risks, IntegratingRisks.1. IntroductionThe Solvency II Standard Formula (Standard Formula) is part of a regulatory frameworkreferred to as Solvency II. One part of the Solvency II framework requires that each insurer 1calculates its Solvency Capital Requirement (SCR) using a Standard Formula, an internal model,or some combination of the two.The purpose of this paper is to describe the main features of the Standard Formula as theywould apply to a property/casualty insurer and compare these to corresponding features, if any,in the National Association of Insurance Commissioners (NAIC) Risk-Based Capital (RBC)formula.As the Standard Formula is not final, this paper deals with the Standard Formula as presentedin the Quantitative Impact Study Five (QIS5), with the exception of Table 4.1, which reflects arecent change in underwriting risk charges.We provide comments comparing the Standard Formula to RBC in boxes such as the onearound this paragraph.Solvency II refers to “insurance undertakings,” “entities,” and “(re)insurers” (to mean both insurers and reinsurers) inorder to cover the variety of legal entities within the EU for life, non-life, and health business. For simplicity, in thispaper we refer to “insurers” for those entities.1Casualty Actuarial Society E-Forum, Fall 2012-Volume 21
Solvency II Standard Formula and NAIC RBC1.1 Terminology, Assumed Reader Background and DisclaimerThis paper assumes the reader is generally familiar with the property/casualty RBC formula. 2In this paper, references to “we,” “our,” “the working party,” and “DCWP” refer to the CASRBC Dependencies and Calibration Working Party.We use the term “nonlife (NL) insurers” for insurers generally equivalent to U.S.property/casualty insurers.The description of Solvency II and the comparisons to RBC aim to enhance ourunderstanding of important features of both formulas. As such, we apologize in advance, andwelcome feedback, from readers who might observe that the descriptions or comparisons areoverly simplistic and do not properly represent important aspects of either formula.The analysis and opinions expressed in this report are solely those of the authors, the WorkingParty members, and, in particular, are not those of the members’ employers, the CasualtyActuarial Society, or the American Academy of Actuaries.DCWP makes no recommendations to the NAIC or any other body. DCWP material is forthe information of CAS members, policy makers, actuaries, and others who might makerecommendations regarding the future of the property/casualty RBC formula. In particular, weexpect that the material will be used by the American Academy of Actuaries.This paper is one of a series of articles prepared under the direction of the CAS RBCDependency and Calibration Working Party and the Underwriting Risk Working Party(collectively known as the RBC Working Parties).2. OverviewThe SCR, whether calculated from the Standard Formula or otherwise, is the capital level“correspond[ing] to the Value-at-Risk (VaR) of the basic own funds of an insurance orreinsurance undertaking subject to a confidence level of 99.5% over a one-year period.” 3,4 This isFor a more detailed description of the formula and its initial basis, see Feldblum, Sholom, NAIC Property/CasualtyInsurance Company Risk-Based Capital Requirements, Proceedings of the Casualty Actuarial Society, 1996.3Directive 2009/138/EC of the European Parliament and of the Council of 25 November 2009, on the taking-up and pursuitof the business of Insurance and Reinsurance (Solvency II), Section 99 subsection 3.4 Directive, Introduction section 64 says, “The Solvency Capital Requirement should be determined as the economiccapital to be held by insurance and reinsurance undertakings in order to ensure that ruin occurs no more often than once2Casualty Actuarial Society E-Forum, Fall 2012-Volume 22
Solvency II Standard Formula and NAIC RBCsometimes referred to as the 99.5% one year VaR standard. This is a level intended to besufficient such that the insurer could withstand a 1 in 200 year shock within one year withsufficient assets remaining to allow for the sale or transfer of its remaining liabilities to anotherinsurer.In addition to the SCR, each insurer also calculates a Minimum Capital Requirement (MCR).The MCR represents a threshold below which the national supervisor would intervene. The MCRis intended to reflect an 85% probability of adequacy over a one-year period and is boundedbetween 25% and 45% of the insurer’s SCR.The Standard Formula operates in a Solvency II-defined balance sheet structure that we referto as Solvency II accounting in this paper. Assets and liabilities are valued based on a “mark-tomarket” approach wherever possible and “mark-to-model” whenever mark-to-market is notavailable. Under Solvency II, loss and premium reserves are replaced for financial reporting bytechnical provisions that consists of the cash flows both inwards and outwards relating topremiums and claims. These cash flows are reduced (compared to nominal values) by a discountfor the time value of money and increased (compared to nominal values) by addition of anexplicit risk margin. 5 Stocks, bonds, and other assets are carried at market value. The statementvalues for receivables, including reinsurance recoverables, are reduced to reflect the probability ofnon-payments on an ultimate basis, i.e., not just reflecting reinsurers currently facing financialdifficulties.in every 200 cases or, alternatively, that those undertakings will still be in a position, with a probability of at least 99.5 %,to meet their obligations to policy holders and beneficiaries over the following 12 months.”5 The cash flows in this process are expected values, including low probability events. The interest rate for discountingcash flows is the risk-free rate of appropriate maturity with an illiquidity adjustment. The risk margin is based on a perannum 6% cost (above risk-free interest rates) of holding capital to support the run-off of reserves, a risk marginmethod often referred as cost of capital approach. The technical provisions including the risk margin is the mark-tomodel value intended to represent the price a buyer would require to accept the risk of assuming the liabilities from thecompany.Casualty Actuarial Society E-Forum, Fall 2012-Volume 23
Solvency II Standard Formula and NAIC RBCRBC also has several levels ranging from Company Action Level (CAL) to Mandatory ControlLevel (MCL).There is no target probability safety level specified for the RBC action levels.While the objective of CAL and MCL levels may not correspond to SCR and MCR levels, wenote that RBC MCL is 35% of the RBC CAL, and thus in the middle of the range of ratios ofSolvency II MCR to SCR.U.S. Statutory Accounting reserves are not discounted (other than for tabular indemnitybenefits such as workers compensation life table claims and structured settlements) and containno explicit safety margin beyond the effect of not discounting. Investment grade bonds can bevalued at amortized cost rather than market value 6 and the value of reinsurance recoverables arereduced for the risk of non-payment, but often only if non-payment is likely. 73. Risks and Risk ChargesThe Standard Formula has separate modules for life, health and non-life insurance. Thispaper is presented from the perspective of a stand-alone non-life insurer. Certain features of theStandard Formula that are minimally relevant or irrelevant to U.S.-type non-life insurance arenoted in Appendix A.For a non-life company, the main risk categories included in the Standard Formula are asfollows:Underwriting Risk, which includes: Premium (loss ratio) risk, excluding catastrophe risk Reserve (loss development) risk, excluding catastrophe risk Catastrophe riskUse of amortized cost rather than market value was more prevalent for non-life companies in the 1990s when RBCwas implemented than is the case currently. Also use of amortized cost is standard for life insurance companies and theRBC factors for class 1 and 2 bonds are the same for life and non-life companies.7 Currently, some U.S. insurers anticipate ultimate uncollectibles in ceded reserves and some do not. When RBC wasdeveloped, insurers rarely reflected ultimate uncollectibles.6Casualty Actuarial Society E-Forum, Fall 2012-Volume 24
Solvency II Standard Formula and NAIC RBCDefault (Counterparty) Risk, which includes: “Non-diversified” counterparties, most significantly reinsurance counterparties “Diversified” counterparties, most significantly agents balances and otherreceivablesMarket Risk, which includes: Interest rate risk Equity risk Real estate (Property) risk Spread risk Currency risk Concentration risk Illiquidity riskOperational RiskCasualty Actuarial Society E-Forum, Fall 2012-Volume 25
Solvency II Standard Formula and NAIC RBCRBC has six main risk categories – R0 through R5.R0 contains off-balance sheet risks and risks arising from insurance subsidiaries. Risks in R0are not reduced by the covariance formula. The inclusion of insurance subsidiaries in R0, outsidethe covariance formula, approximates the result that would occur if the calculation were done ona consolidated basis (with regard to insurance subsidiaries). The result effectively allows anycapital held by an insurance subsidiary above the RBC requirements to accrue to the benefit ofthe upstream parent.In Solvency II there is no Standard Formula risk charge for subsidiaries, but to the extent thatthe insurer’s net asset value (NAV) includes insurance or other financial service subsidiaries (fullor partial ownership), the value of those subsidiaries in the parent company financial statement isadjusted to avoid over-counting of NAV between the subsidiary and the parent company.Both RBC and the Standard Formula have special rules for dealing with valuation of financialsubsidiaries in NAV or risk charges like R0 or both.RBC R1 and R2 address invested asset risk, including investments in non-insurance affiliates,corresponding to the Standard Formula Market Risk.R1 addresses invested asset risk for fixed-income investments; R1 primarily addresses default 8risk. The fixed-income risk in Solvency II considers change in market value that includes changein interest rates and market measurement of default risk. The difference in risk treatment mightbe viewed as related to the difference in time horizon between Solvency II and RBC. Over theone year Solvency II time horizon, risk relates to change in market value. Over the longer RBCtime horizon, the risk relates to default.This difference in risk treatment is analogous to the difference in accounting treatmentbetween SAP and Solvency II. In SAP, many fixed-income assets are valued at amortized cost,and that value does not change with interest rates. In Solvency II fixed-income assets are valuedat market, and that value does change when interest rates change.R2 corresponds to equity and real estate (property) risk.8 The R1 factors represent default risk over a 10-year holding period for class 1 and 2 bonds, net of expected recoveriesafter a default. For class 3 bonds the risk factor was a judgmental market risk factor with no clear holding period.Casualty Actuarial Society E-Forum, Fall 2012-Volume 26
Solvency II Standard Formula and NAIC RBCR3 corresponds to default (counterparty) risk. 9R4 and R5, reserving and premium risk, correspond to Standard Formula Underwriting risk.The R4 and R5 provisions for growth are analogous to the growth component within theStandard Formula provision for Operational Risk.The RBC provision for catastrophes is implicit in R4 and R5, primarily R5, although work isunderway to develop separate RBC charges for hurricane and earthquake risk.The risk charges for each of these Solvency II risk elements are intended to represent the99.5% VaR for a one-year time horizon. Risk charges for each risk at this target safety level aredetermined by one of two methods: the “factor method” or the “scenario method.”For some risks, e.g., premium and reserve risk, the risk charge is calculated by applying afactor to a balance sheet value at the statement date. We refer to this as a factor method.For other risks the risk charge is determined by taking the difference between the insurer’s netasset value, or “NAV” (capital and surplus in U.S. statutory terminology), at the statement dateand the insurer’s NAV restated, at the same statement date, based on a scenario affecting one ormore risk elements. We refer to this as a scenario method. For example, the interest rate riskcharge is determined by measuring how specified changes to the interest rate term structures andinterest rate volatility affects the NAV due to revaluation of all interest rate sensitive assets andliabilities, (e.g., discounted loss reserves).The capital charges associated with each of the risks are combined with a “correlationmatrix” 10 intended to produce the target of a 99.5% VaR level in total over a one-year timehorizon. The correlation matrix values are “tail correlations” appropriate to the 99.5% VaR leveland not the more commonly discussed “linear correlation” factors. The resulting capitalrequirement is compared to the company’s actual capital and surplus subject to severaladjustments.Ceded reinsurance credit risk with R3 is split 50/50 between R3 and R4 when applying the RBC covariance formula.The 50/50 treatment is not applied for fronting companies that retain little to no underwriting risk. For suchcompanies, all the ceded reinsurance credit risk is retained in R3 when applying the covariance formula.10 Solvency II “correlation matrices” are intended to represent the dependency relationship at the tail of the riskdistribution. Technically these are not correlation matrices according to the assumptions required of linear correlation.These “correlation matrices” are useful approximations, but might be described as “weighting factor matrices.”Nonetheless, to be consistent with Standard Formula terminology, we refer to them as correlation matrices. (All theSolvency II matrix values are rounded or selected to be multiples of 0.25.)9Casualty Actuarial Society E-Forum, Fall 2012-Volume 27
Solvency II Standard Formula and NAIC RBCRBC target safety level is generally implicit and not the same for each risk element. The riskcharge for reserve and premium risk in R4 and R5 has been calibrated to an 87.5% VaR over theclaim run-off period (reserves) and 87.5% for one year of new business (premium).RBC currently uses factor methods only, no scenario methods, although the hurricane andearthquake cat charges being developed would use catastrophe model results (which combinescenarios with probability estimates).The RBC correlation structure is less extensive than that used by the Standard Formula.In the remainder of this report, we discuss non-life underwriting risk (Section 4), default orcounterparty risk (Section 5), and market risk (Section 6). In Section 7 we discuss how the risksare combined to produce the total SCR, reflecting dependency relationships between the risksand operational risk. In section 8 we discuss the adjustments to Solvency II capital that are madebefore capital is compared to the SCR result.4. Non-Life Underwriting Risk Module4.1 OverviewThe main elements of non-life underwriting risk are premium risk, reserve risk, andcatastrophe risk. Each of these is described in the sections below.The underwriting risk charge is determined both net of reinsurance and gross of reinsurance.The risk charge net of reinsurance enters the Standard Formula directly. The difference betweenthe risk charge net of reinsurance and the risk charge gross of reinsurance represents exposure tocredit risk. As such, that difference is used in calculating the reinsurance counterparty default risk(credit risk) charge.4.2 Premium and Reserve Risk ElementsPremium risk is intended to measure the variation in combined ratios, net of reinsurancerecoveries and excluding catastrophe losses. Expense risk is implicitly included as part ofpremium risk.Reserve risk is intended to measure variation in loss reserve development, net of reinsurancerecoveries and excluding catastrophe losses.Casualty Actuarial Society E-Forum, Fall 2012-Volume 28
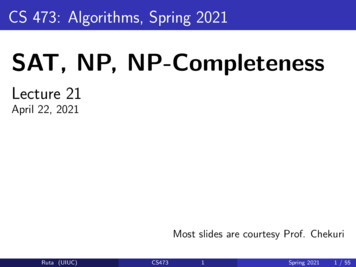
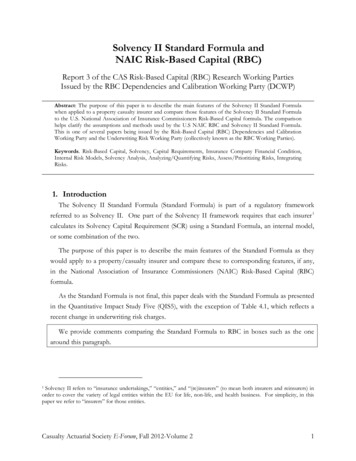
Solvency II Standard Formula and NAIC RBCThe Standard Formula requires insurers to classify non-life business into 12 lines of business. 11Table 4.1 below shows the standard deviations used to calculate risk charges for premium andreserve risk.Table 4.1Standard Deviations by Line of Business – Premium and Reserve Risk(Updated Dec 2011)Standard DeviationLOB #LOBGross Premium 12Net Reserves 131Motor vehicle9.6%8.9%liability2Other motor8.2%8.0%3Marine, aviation,14.9%11.0%transport (MAT)4Fire8.2%10.2%53rd party liability13.9%11.0%6Credit and11.7%19.0%suretyship7Legal s12.8%20.0%10NP reins (prop)5.0%5.3%11NP reins (cas)8.5%13.9%12NP reins (MAT)8.0%11.4%Source: Report of the Joint Working Group on Non-Life and Health NSLT 14 Calibration, “Calibration of thePremium and Reserve Risk Factors in the Standard Formula of Solvency II,” 12 December 2011.The factors are the same for all jurisdictions across the EU.Proportional reinsurance business is treated as if it were the corresponding primary line ofbusiness, based on the assumption that the risk standard deviations are the same for primary andproportional reinsurance business.The underwriting risk charges are applied to premiums and reserves net of reinsurance (fornet risk) and to premiums and reserves gross of reinsurance (for gross risk), with the differenceThis paper does not compare the Solvency II risk charge values to RBC values. Any such comparison is complicated(or impossible) because the lines of business are not directly comparable.12Premium factors were selected based on data gross of reinsurance.13Reserve factors were selected based on data net of reinsurance.14 Health is separated into (a) business analyzed using techniques “similar to life insurance techniques” (SLT) and (b)health analyzed using techniques like non-life or not-SLT (NLST).11Casualty Actuarial Society E-Forum, Fall 2012-Volume 29
Solvency II Standard Formula and NAIC RBCbetween the two risk charges (the “ceded risk exposure”) used to determine reinsurance creditrisk. For premium risk, the standard deviation in Table 4.1 can be reduced using a formula toreflect the extent the ceded reinsurance is non-proportional reinsurance. 15The factors in the table are standard deviations, applied separately for premium and reserve risk.There are several steps required to produce the combined premium and reserve risk charge byline of business and then for all lines combined.First, for each line of business, the premium risk and reserve risk standard deviations arevolume weighted together assuming a correlation coefficient of 50% between premium andreserves as follows: Square Root {(Premium2 * σ2 Premium Reserve2 * σ2Reserve Premium *Reserve * σ Premium * σ Reserve*)/ (Premium Reserve)2 }.σLOBSecond, the volume measure(s) for each line of business are adjusted to reflect geographicdiversification as follows: 16VolumeLOB ,r),LOB, r (PremiumLOB r ReserveLOB, r)* (75% 25% * Diversificationwhere the r subscript represents geographic segments, generally countries.Geographic Diversification LOB { (Premium(Premium LOB, r Reserve LOB, r)) 2}.LOB, r ReserveLOB, r) 2 / ( Third, the standard deviation for all lines combined is determined with the following formula,summing over all pairs of LOB J and K, using the LOB Correlations from Table 4.2:σ TOTAL Square Root {(1/( Volume TOTAL)2 *[ Correlation LOBLOB J, LOB K) * σLOBJ * *σLOB K * Volume LOB J * * Volume LOB K]}.15 Insurers must assess whether net-to-gross ratio of premiums or reserves at the 99.5% level are less than (or at least notsignificantly greater than) the net-to-gross ratio of best estimate provisions. That might be the case due to loss ratiolimits and the like. If so, the reduction in the capital charge resulting from reinsurance is reduced. (QIS 5 TechnicalSpecifications SCR 13.9)16 Rather than adjusting the standard deviation to reflect this diversification, the formula adjusts the volume measure.Casualty Actuarial Society E-Forum, Fall 2012-Volume 210
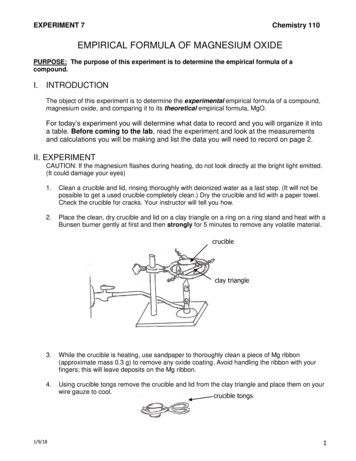
Solvency II Standard Formula and NAIC RBCTable 4.2LOB/LOB123456789101112Standard Formula Underwriting Risk Covariance Matrix for Premium and Reserves(LOB numbers in the first column follow the numbering in Table .250.250.501.000.250.251.000.25Note that each of the correlation factors is 0.25, 0.50, or 1.00. These are tail correlations andare intended to represent the relationship between line of business outcomes (premium andreserves combined) at the one-year 99.5% VaR level.The non-life underwriting risk charge is approximately as follows:Underwriting Risk Charge [Volume (after geographic diversification) Total] * (3.0 *σ Total).The factor 3.0 is the rough number of standard deviations required to reach the 99.5% levelfor a lognormal distribution.Casualty Actuarial Society E-Forum, Fall 2012-Volume 211
Solvency II Standard Formula and NAIC RBCRBC treats premium risk and reserve risk as independent. The Standard Formula treats themas having some degree of covariance.RBC has a line of business diversification credit (dependency relationship) expressed by the70% rule. 17 The Standard Formula specifies a covariance relationship between each pair of linesof business.RBC does not have a specific credit for geographic diversification or charge for geographicconcentration. RBC risk charges are derived from data that implicitly includes an averagegeographical diversification effect for U.S.-domiciled insurance companies. The StandardFormula geographical diversification credit has a 75% rule that is applied like the 70% rule forLOB diversification in RBC.RBC uses the same factors for business regardless of the state in which the business is written.The Standard Formula takes the same approach.RBC does not evaluate risk gross of reinsurance as that information is not used in the RBCcredit risk calculation. 18For R4, RBC includes an investment income offset. 19 The Standard Formula does not includean investment income offset in that investment income is already reflected in the discountedunpaid claim reserves. Thus, investment income is treated as a reduction in the risk charge inRBC while it is treated as an increase in capital and surplus in the Solvency II accounting basis.For R5, RBC measures the risk as potential operating loss net of the investment incomeoffset. The standard formula measures premium risk based on an unexpected increase in the lossratio. Thus, the RBC risk charge is net of expected profit while the Standard Formula is gross ofexpected profit. 20For premium risk the concentration factor is 70% plus 30% times (premium for largest Schedule P line ofbusiness/total premium). For reserve risk the concentration factor is the same formula using reserves instead ofpremium. The result is 100% for a monoline company and approaches 70% for a hypothetical insurer evenly spreadacross an infinite number of lines. The minimum value for the factor is limited by the number of Schedule P lines. The70% rule was selected considering observed risk for all-lines combined compared to risk by line of business.18 Ceded reinsurance risk is considered in the credit risk charge, R3.19 Applied to reserves “grossed up” for any company non-tabular discount.20 An offsetting factor is that under Solvency II accounting profits are recognized more quickly than under SAP. UnderSolvency II accounting, underwriting profit is reflected as premium is written and investment income on assetscorresponding to unearned premium and unpaid claims is recognized in part immediately and in part as the risk margin17Casualty Actuarial Society E-Forum, Fall 2012-Volume 212
Solvency II Standard Formula and NAIC RBCOwn-Company ExperienceSubject to regulatory approval, an insurer can choose to use a credibility-weightedcombination of its own specific parameters (such as standard deviations) or the industry standardparameters for premium and reserve risk under the Standard Formula. The insurer experiencemust be analyzed in a prescribed manner analogous to the manner in which the industry data wasevaluated. Insurer-specific parameters for premium and reserve risk would be treated as 100%credible if sufficient years of data are available. Insurers with at least five years of experience in aline of business start with 34% credibility. The credibility weights increase to 100% for 10 yearsof experience (most lines of business) or 15 years of experience (for longer-tailed lines ofbusiness such as third-party liability, motor vehicle liability, and credit and suretyship).RBC includes an own-company adjustment using the 50-50 rule in which company experiencemodifies the RBC charge based on the ratio of company loss ratios to industry loss ratios orcompany-incurred development to industry-incurred development, as long as the company has10 years of experience and meets certain other requirements regarding consistency of volumeover the 10n years. 214.3 Catastrophe RiskAs with the non-catastrophe underwriting risk charges, the Solvency II catastropheunderwriting risk charge is determined both net and gross of reinsurance. The charge net ofreinsurance is a component of the total underwriting risk charge. The difference between thegross and net risk charges is referred to as the catastrophe risk mitigation effect and is a measureof reinsurance credit risk used in the counterparty default risk calculation.Catastrophe risk charges consider both natural catastrophes and man-made catastrophes.Natural catastrophes consist of windstorm, flood, earthquake, hail, and subsidence. 22 Storm surgeis included with the windstorm peril. Man-made catastrophes include motor, fire, aviation, marine,liability, credit and suretyship, and terrorism.reduces. Under SAP underwriting profit in the written premium is not reflected until the premium is earned andinvestment income is recognized as realized.21 The exact rule for including company experience is more complex. See NAIC instructions for precise statement of therule.22 Not all perils apply to all countries.Casualty Actuarial Society E-Forum, Fall 2012-Volume 213
Solvency II Standard Formula and NAIC RBCThe risk charges are based on a combination of scenarios and factor methods. Scenariomethods (Method 1) are for use in calculating capital requirements for natural catastrophes in theEEA. 23 The Scenario methods are described later in this section.Factor methods (Method 2) are used when application of Method 1 may not be appropriate,e.g., for natural catastrophe exposures outside of the European Economic Area (EEA),miscellaneous business, and non-proportional reinsurance business. For the factor method, theStandard Formula provides selected gross loss ratios by line of business.With either Method 1 or Method 2, insurers calculate their gross catastrophe losses based oneither the prescribed scenarios (Method 1) or the prescribed gross loss damage ratios and grosswritten premiums (Method 2).Insurers then net down the calculated gross loss damages using their own reinsuranceprograms including any excess covers, any proportional covers, excess retentions andreinstatement premiums as well as recoveries from any national pools.The aggregate capital requirement for non-life (NL) natural catastrophes is determined as:NL CAT Square Root {(Method 1)2 (Method 2)2}Thus, it is assumed that Method 1 and Method 2 apply to independent catastrophe exposures.Scenario Methods—Natural CatastrophesThe Standard Formula provides tables showing the gross loss damage ratio (Qcountry) for 1in-200 year catastrophe events, by peril, within each CRESTA 24 zone, separately by country. Thecapital requirement for each CRESTA zone and each peril gross of reinsurance is Qcountry timesthe aggregated value of geographically weighted total insured value by peril for each country,where the weights are the zone relativity factors for each country provided by the StandardFormula.23 The only company data required to apply the scenario methods is Total Insured Value (TIV) by line of business,reflecting the company’s proportional share if on a co-insurance basis, without allowance for deductible, limits, and sublimits, See “CEIOPS-DOC-79-10-CAT-TF-Report” page 9) by CRESTA zone. As that level of data is expected to becommonly available, it is expected that companies can apply the scenario method within the EEA.24CRESTA, the Catastrophe
Both RBC and the Standard Formula have special rules for dealing with valuation of financial subsidiaries in NAV or risk charges like R0 or both. RBC R1 and R2 address invested asset risk, including investments in noninsurance affiliates- , corresponding to the Standard Formula Market Risk.