Transcription
Forensic Analysis Insights—Business ValuationHow to Estimate the Long-Term GrowthRate in the Discounted Cash Flow MethodAaron Rotkowski and Evan CloughIn forensic analysis engagements where the value of a company or security is disputed,one topic that the litigants often disagree about is the selection of the expected long-termgrowth rate used in the discounted cash flow method. The expected long-term growth ratemay be contested because (1) small changes in the selected growth rate can lead to largechanges in the concluded business or security value and (2) the long-term growth rate isa judgment-based valuation input. Because of these two factors, judges, mediators, andarbitrators may view the analyst’s selected long-term growth rate skeptically. This discussionprovides qualitative and quantitative factors that analysts may consider to support theselection of an expected long-term growth rate.IntroductionValuation analysts are often retained to estimatethe fair value or fair market value of a company orsecurity for a variety of forensic analysis purposes,including taxation, bankruptcy, lender liability,shareholder disputes, GAAP compliance, intellectual property infringement, contract dispute, condemnation/eminent domain, and other controversies.In these assignments, the valuation analyst mayconsider the income approach and, specifically, thediscounted cash flow (DCF) method to value thesubject company or security.This discussion focuses on the procedure to estimate one of the important valuation variables in theDCF method: the subject company’s expected longterm cash flow growth rate in perpetuity.The Delaware Chancery Court (the “ChanceryCourt”) “is widely recognized as the nation’s preeminent forum for the determination of disputesinvolving the internal affairs of the thousands uponthousands of Delaware corporations and other business entities through which a vast amount of theworld’s commercial affairs [are] conducted.”1The Chancery Court has noted that the DCFmethod is a generally accepted method to value abusiness or security. In particular, the Chancerywww.willamette.comCourt notes that “the DCF [method] has featuredprominently in this Chancery Court because it ‘isthe approach that merits the greatest confidencewithin the financial community’”2 and “if a [DCFmethod] reveals a valuation similar to a comparablecompanies or comparable transactions analysis,[the Chancery Court has] more confidence thatboth analyses are accurately valuing a company.”3The DCF method involves a projection of thecompany’s results of operation for a discrete, multiyear period. The discrete cash flow projection isthen converted to a single present value. The DCFmethod typically involves a terminal value analysisat the end of the discrete projection period.The terminal value is “the present value ofthe stabilized benefit stream capitalized into thefuture,”4 where the future represents all periodsafter the discrete projection period.In the DCF method, it is not uncommon for theterminal value to account for 75 percent or more ofthe total company or security value. This conclusionis especially true when there are fewer discrete projection periods between the valuation date and terminal period—that is, the terminal value accountsfor more of the projected economic benefit of thecompany and thus a higher proportion of the totalvalue.5INSIGHTS SPRING 2013 9
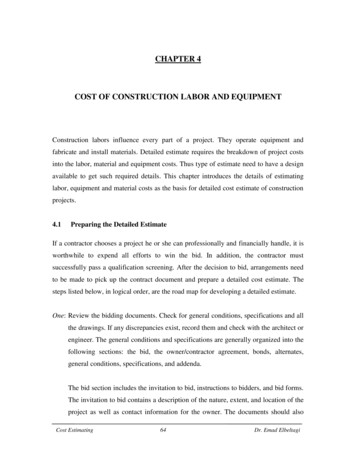
The Gordon growth model (GGM) is a methodthat is often used to calculate the terminal value ina DCF method analysis. This terminal value estimation model can be sensitive to the expected longterm growth (LTG) rate.6 Because a small changeto the LTG rate can have a large impact on theconcluded value, the LTG rate is often one of thedisputed variables in valuations prepared for forensic analysis purposes.Figure 1 demonstrates the sensitivity of theconcluded terminal value to the selected LTG rate(as calculated by the GGM), assuming the followingillustrative valuation variables:1.A 15 percent weighted average cost of capital (WACC)2.A terminal period cash flow of 10As shown in Figure 1, an increase in the LTGrate from 3 percent to 4 percent causes an increasein the terminal value of 10 percent. An increase inthe LTG rate from 5 to 6 percent causes an increasein the terminal value of 11 percent.7Given the potential controversy regarding theselection of the LTG rate in the DCF method, thisdiscussion considers the following topics:1.How the LTG rate relates to (a) the subjectcompany or security and (b) the concludedterminal value2.The factors that affect the LTG rate selectionFigure 1Sensitivity of GGM to Selected LTG Rate 120 100 100 91Terminal Value 83The Gordon Growth ModelAs previously discussed, one common method usedto calculate the DCF method terminal value is theGordon growth model. The GGM formula8 is presented as follows:PV (NCF0 ( 1 g )) ( k – g )where:PV Present valueNCF0 Net cash flow in the final discreteprojection period9g Selected long-term growth ratek Selected cost of capitalThe first procedure to calculate the terminalvalue using the GGM is to estimate the normalizedlong-term income stream (e.g., terminal period netcash flow, or NCF) at the end of the discrete projection period. This income stream should take intoaccount the stable, normalized economic returns ofthe business.10The next procedure in the GGM is to capitalizethe terminal NCF at a risk and growth adjusted capitalization rate (i.e., the direct capitalization rate).The GGM estimates the terminal value based on thepremise that the NCF will increase (or decrease)in perpetuity at a constant annual rate. The appropriate GGM direct capitalization rate equals thecompany WACC (which incorporates the risk of the company cashflow) minus the selected LTG rate(which incorporates the expectedgrowth of the company cash flow). 111Once the direct capitalizationrate is calculated, the projectedterminal period’s NCF is dividedby that direct capitalization rate toderive the terminal value. 80Because the terminal value iscalculated as of the end of thediscrete projection period, the lastprocedure in the application of theGGM is to compute the presentvalue of the terminal value. 60 40 20 03.0%4.0%5.0%6.0%The long-term growth rate is notused in this procedure. Instead, thesame present value factor appliedto the final discrete period’s projected NCF is also applied to theterminal value in order to convertit to the present value as of thevaluation date.LTG Rate10 INSIGHTS SPRING 2013www.willamette.com
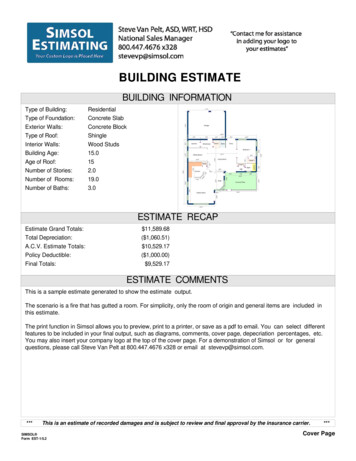
LTG Rate Definitionterminal period discounted to the beginning of theterminal period at the direct capitalization rate.The terminal value incorporates the value of allthe company’s cash flow following the final discreteprojection period, into perpetuity. That period isreferred to as the “terminal period” for purposes ofthis discussion. As such, when an analyst selects along-term growth rate, the analyst is effectively concluding that the company’s cash flow will increase(or decrease) at the constant LTG rate forever.11Because the direct capitalization rate equals theselected WACC minus the selected LTG, the proportion of the terminal value that is generated in eachsuccessive period depends on the spread betweenthese two figures.In other words, given the same WACC, a lowerLTG rate causes a higher proportion of terminalvalue to be generated in the near term, while ahigher LTG rate causes the opposite result.At first glance, it may seem unrealistic toassume that a company will experience positive (ornegative) growth forever—especially if the analystselects a growth rate that is greater than the projected rate of inflation (and, in doing so, implicitlyprojects that the company will grow to infinite sizeover infinite time). However, the majority of theterminal value is generated by the cash flow thatoccurs within the first few periods beyond the discrete projection periods.This is because a higher LTG rate causes cashflow to increase more rapidly into the future, whichconsequently causes future periods to have relatively higher present values.Figures 2 through 4 graphically present theannual and cumulative percentage of the terminalvalue in the first 20 years of the terminal period,based on the following valuation variables:1. A WACC of 15 percentTherefore, when the analyst selects a LTG ratefor the GGM, he or she is essentially estimating theannual percentage changes in a company’s cash flowover the first 10 to 20 years beyond the terminalperiod.The GGM is a formula to calculate the net present value (i.e., the “terminal value”) for all futureperiods into perpetuity. In essence, it is a collapsedversion of the formula that represents a summationof the present value of each individual period in the2.Normalized cash flow in the first terminalperiod of 1003.LTG rates between 0 percent and 5 percent12The vertical bars in Figures 2 through 4 present the present value of annual cash flow duringthe terminal period and the curved horizontal lineFigure 2WACC 15 Percent, LTG 0 Percent100% 9093.9% 8090%80% 7070% 6060% 5050% 4040% 3030% 2020% 1010% 00%123456789Cumulative % of Terminal ValuePresent Value of Cash Flow (000) 10010 11 12 13 14 15 16 17 18 19 20PeriodPresent Value of Cash Flowwww.willamette.comCumulative % of Terminal ValueINSIGHTS SPRING 2013 11
Figure 3WACC 15 Percent, LTG 2.5 Percent100% 90 8090%90.0% 80% 7070% 6060% 5050% 4040% 3030% 2020% 1010%Cumulative % of Terminal ValuePresent Value of Cash Flow (000) 1000% 012345678910 11 12 13 14 15 16 17 18 19 20PeriodPresent Value of Cash FlowCumulative % of Terminal Value 100100% 9090% 8083.8% 7080%70% 6060% 5050% 4040% 3030% 2020% 1010% 00%123456789Cumulative % of Terminal ValuePresent Value of Cash Flow (000)Figure 4WACC 15 Percent, LTG 5 Percent10 11 12 13 14 15 16 17 18 19 20PeriodPresent Value of Cash Flow12 INSIGHTS SPRING 2013Cumulative % of Terminal Valuewww.willamette.com
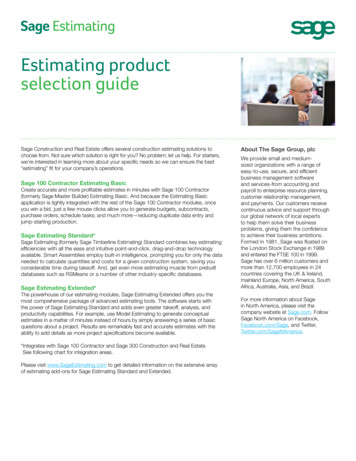
presents the cumulative percentage of the total terminal value of the presented cash flow for periods 1through 20.Figure 2 demonstrates that with a selected LTGrate of 0 percent, periods 1 through 20 account for93.9 percent of the terminal value. Figure 3 demonstrates that with a selected LTG rate of 2.5 percent,periods 1 through 20 account for 90.0 percent of theterminal value.Figure 4 demonstrates that with a selected LTGof 5.0 percent, periods 1 through 20 account for83.8 percent of the terminal value.The positive correlation between the LTG rateand the proportion of value generated in later periods is paradoxical. Later projection periods andhigher selected LTG rates generally drive a greaterdegree of uncertainty, which means that selecting ahigher LTG rate causes uncertainty in later periodsto be amplified by their relatively increased proportion of the terminal value.Nonetheless, this concern is usually mitigated bythe fact that the amplitude of this effect is generallysomewhat small—that is, sooner periods still generate a much larger proportion of terminal value thanlater periods, even when the selected LTG rate maybe relatively large.Because of the large proportion of the terminalvalue that is accounted for in the first 20 or so periods following the discrete projection period, it ispossible to make a reasonable directional predictionabout the subject company cash flow.This directional cash flow prediction is capturedby the LTG rate. As such, it is necessary that theanalyst consider appropriate factors in the selectionof the same.SelectingtheLTG RateThere are a number of issues that the analyst mayconsider in selecting an LTG rate. First, the analystshould be careful to match the selected growth rateand the inputs considered with the metric beingmeasured—that is, cash flow.13Second, the analyst should be careful to considerany and all appropriate (and not consider inappropriate) qualitative factors in the selection of thegrowth rate.Third, the analyst should consider appropriate(and not consider inappropriate) quantitative factors in the selection of the growth rate.The next section summarizes the quantitativeand qualitative factors that analysts may considerwhen selecting an LTG rate in the application ofthe GGM.www.willamette.comQualitative ConsiderationsSome valuation analysts consider the subject company’s LTG rate only in terms of historical growth,near-term projected growth, projected or historicalinflation, or another similar measurable financialmetric. Those factors are all considerations in theselection of the LTG rate.However, when selecting an LTG rate, the analyst should also have a general understanding froma business perspective of what factors contribute tothe subject company’s growth. This understandingis important because the period covered by the LTGrate variable within the GGM may start so far intothe future that the following may occur:1.Precisely projecting the LTG rate is difficult.2.It may not be practical or possible to pinpoint the specific company initiatives thatwill contribute to the company’s growth.Appropriate qualitative considerations mayinclude an analysis of the historical and projectedperformance of the company, existing assets of thecompany, and management’s strategy of acquisitionsand/or new development.According to Investment Valuation, Tools andTechniques for Determining the Value of Any Assetby Aswath Damodaran, a company’s LTG rateshould be “determined by a number of subjectivefactors—the quality of management, the strength ofa firm’s marketing, its capacity to form partnershipswith other firms, and the management’s strategicvision, among many others.”14Damodaran also includes reinvestment as afactor of a company’s expected long-term growthrate. Damodaran writes that “defining reinvestmentbroadly to include acquisitions, research and development, and investments in marketing and distribution allows you to consider different ways in whichfirms can grow. For some firms like Cisco, reinvestment and growth come from acquisitions, while forother firms such as GE it may take the form of moretraditional investments in plant and equipment.”15For any subject company, reinvestment may beviewed as coming from the following three sources:1.Opportunities to exploit the existing assets2.New internally developed assets3.AcquisitionsLet’s consider the LTG rate in the context of ahypothetical designer and manufacturer of women’saccessories, GrippCo. Let’s further assume that (1)the specific segment of the industry that GrippCoINSIGHTS SPRING 2013 13
competes in was in the growth stage of its life cycleand (2) the industry segment was fragmented.The next sections explain the three sourcesof growth described above. And, the next sectionillustrates each source of growth using the GrippCoexample.Growth From the Existing AssetsOne category of LTG is from the subject company’sexisting assets, both tangible and intangible. Thistype of growth is probably what most analysts thinkof first when they think of the company’s long-termgrowth. Examples of this type of growth include thefollowing:1. Selling more units of an existing product orservice2. Selling existing products or services at agreater selling priceThe factors that the analyst may consider whenassessing the expected subject company growthfrom the existing assets include, but are not limitedto, the following:1. The overall industry growth2. The company’s market share3. Inflation (e.g., the potential to increaseprices)4.The growth of the existing assets prior tothe terminal periodNote that factors one through three should beconsidered as of the terminal period. For example,if the subject company has projected that it willincrease its market position from the tenth largestcompetitor to the first largest competitor during thediscrete projection period, then the company’s ability to grow by selling additional units in the terminalperiod may be limited.Likewise, if the industry growth is expectedto be rapid during the discrete projection periodand slow in the subsequent years, then the analystshould focus on the slower, second phase of industrygrowth.Since GrippCo has a small market share, it ispossible for the company to grow from both of thefollowing conditions:1.Increased accessory sales2.Rising pricesTherefore, the valuation analyst may includeGrippCo LTG from existing assets from selling agreater number of products at prices that increasearound the same rate of inflation. In this scenario,the analyst could support a selected LTG rate forGrippCo from existing assets that is greater thanthe projected nominal growth rate for the economy.Growth Related to New InternallyDeveloped AssetsWhether it is one year or 100 years, almost everyproduct has a limited life. The stylish and brandedGrippCo accessory that is manufactured and sold asof the valuation date will not be around in a decade;but GrippCo likely will be.If the company does indeed survive 100 years,it will do so by redesigning its existing productofferings or expanding into related lines of businessto stay competitive. That is, GrippCo will achievelong-term cash flow growth from new internallydeveloped assets that it did not own as of the valuation date.For some companies, like the hypotheticalGrippCo, developing new assets is a critical component of the company’s business plan. For companies like this, if the analyst only considers growthfrom existing assets in the LTG rate, he or she mayunderstate the company’s LTG rate.Growth from new internally developed assets ismore difficult to identify and support than growthfrom existing assets. This is because, by definition,the valuation analyst is projecting that cash flow willbe generated from a product or an idea that hasn’tbeen developed. The analyst is also assuming thatthis undeveloped idea will be commercially viable.14 INSIGHTS SPRING 2013www.willamette.com
In spite of the difficulties in explicitly projectingthis type of growth, growth from newly developedassets should still be considered. In fact, companiessuch as GrippCo only survive (1) by regularly reinventing themselves or (2) by “cannibalizing” theirexisting products with newly developed products.valuation date, then it may be reasonableto assume that the company will make asimilar number of acquisitions in the futureas it did in the past.nThe acquisition policy of company management. For example, if the board of directors’minutes indicate that the subject companymanagement was directed to make acquisitions, then it may be reasonable to assumethat the company will grow by makingacquisitions.nThe level of acquisition activity in thesubject company industry. The analyst canreview several of the merger and acquisitiondatabases to analyze the number of transactions that occurred in the subject companyindustry in the years preceding the valuation date.In order to assess the likelihood and amount ofLTG from new internally developed assets, the analyst may consider the following factors:nnnThe frequency of the subject companyproduct launches. For example, if the subject company launches new products several times a year, then it may be reasonableto assume that it will frequently launch newproducts during the terminal period.The success of the subject company productlaunches. For example, if demand generallyexceeds supply for the first production runof the subject company new products, thenit may be reasonable to assume that thecompany will successfully launch new products during the terminal period.The level of innovation in the subject company industry. For example, growth fromnew internally developed products is morelikely if the subject company competes inan innovative industry (e.g., the electroniccomputers industry) than if the subjectcompany competes in a mature industry(e.g., the petroleum refining industry).Growth by AcquisitionsAnother category of growth is growth by acquisitions. Growth by acquisitions can (1) create newcompany assets and (2) create and augment thecompany’s existing assets, including goodwillGoodwill is the company’s business enterprisevalue in excess of the company individual tangibleand intangible assets owned as of the valuation date.The analyst may consider the following:1.How likely the subject company is to makeacquisitions during the terminal period2.How much LTG is projected to come fromacquisitionsThe following discussion presents some specificfactors that the analyst may consider to answer thetwo questions posed above:nWhether or not the company was a historically acquisitive company. For example, ifthe subject company was created via anacquisition and reported a material numberof acquisitions in the years preceding thewww.willamette.comThe level of acquisition activity in theindustry may provide an indication of thecompany’s likelihood to complete acquisitions in the terminal period.nThe subject company’s projected ability,from a financial perspective, to make acquisitions. The analyst can review the historical financial statements as well as the financial statements projected for the discreteprojection period.Since the relevant period for analysis isthe terminal period, the analyst should bemost concerned with the company’s abilityto make acquisitions at the start of the terminal period.For example, if the company has planneda major capital expenditure financed withdebt capital during the discrete projectionperiod, it may be difficult for the companyto complete acquisitions during the firstpart of the terminal period.Excluded FactorsIn general, inappropriate considerations may includespeculation, hypothetical situations, or opportunities which may have existed as of the analysis datebut were as-of-yet unexploited. For valuations prepared for forensic purposes, the valuation analystshould understand how the relevant court (e.g.,Tax Court, Delaware Chancery Court, BankruptcyCourt, etc.) has viewed the LTG rate selection inthe DCF method.It may be prudent for the analyst to consult withcounsel in order to understand what specific considerations can and cannot be included in the LTGrate variable.INSIGHTS SPRING 2013 15
Quantitative ConsiderationsUsually, it is also appropriate to consider and support the selected LTG rate with empirical data.Among other things, these data may include both ofthe following:1.Company-specific information2.Projected economic growth, both real andnominalThese data should be corroborative of the selected LTG rate. If qualitative data and quantitativedata suggest different LTG rates, the analyst shouldunderstand and reconcile the differences.An important source of information that an analyst can use when selecting an LTG rate is financialinformation from the company. This can include(1) historical financial information and (2) management-prepared projectionsIf the business was operating under similar business conditions, historical financial informationis useful because it provides snapshots of the economic results of the business.Management-prepared projections are usefulbecause company management generally has a deepunderstanding of the economic drivers of the business and is able to isolate and predict the expectedresults of the business for a number of years intothe future.Historical Financial InformationWhen a company is valued as a going concern, asis common in forensic circumstances, it is assumedthat it will retain the functioning mechanisms thatdrove past economic returns.16 As such, it is likelythat the economic factors driving a company in thenear past will continue to affect the company in thenear future.In other words, recent trends of increase ordecrease in historical cash flow—if not caused byobvious changes in company operation—are oftenlikely to carry on into the future.17This can provide the analyst with a useful ideaof what may constitute a reasonable LTG rate forthe company cash flow. This is especially true whenthe company has a long operating history and/or theanalyst is able to identify specific factors that havedriven these trends.The age of the company is relevant to the consideration of historical financial trends for the following two reasons:1.An older company is more likely to exhibita stabilized economic condition.16 INSIGHTS SPRING 20132.More time periods provide more data toconsider.When a company has reported stable economicreturns over a number of periods with operatingconditions similar to those at the valuation date andthere are not expected to be any subsequent material changes, trends in historical financial information can carry a significant amount of weight.The U.S. District Court in Wisconsin observedthat “[w]hen a business has a long track record,revenues can be forecasted with greater certainty,and the need to perform a finely calibrated analysisof the various factors affecting revenues may not beas acute.” On the other hand, financial trends in thehistorical financial information of young businessesmay carry less weight, and making projections fromsuch information is “notoriously difficult.” To do so,“the expert must look to other indicators, such asthe track records of other firms that are comparableto the [business].”18This implies that long-term historical trends areuseful indicators of future trends, while short-termtrends of a business may require a deeper understanding of their economic drivers to predict thatthey will continue into the future.As an example, let’s consider three differentbusinesses and the impact of their circumstanceson the usefulness of their historical financial data inthe selection of the LTG rate.The first business, Company A, was foundedthree years ago. It is already showing profits andis expected to continue doing so, but it has volatilecash flow and a high dependence on two customersthat are not secured by long-term contracts.The second business, Company B, also hasa three-year history, but has exhibited steadilygrowing cash flow (which is projected to continueincreasing at a predictable rate) and no key customer dependence.Company C has a 30-year operating history withsteady cash flow that is increasing at a rate consistent with the industry, and it predicts no materialbusiness changes in the foreseeable future.In the case of Company A, the business does notexhibit stabilized economic drivers, past cash flow isvolatile, and customer relationships are uncertain.Therefore, the historical data may be less important when compared to management projections,industry projections and expectations, and/or otherfactors.On the other hand, Company B’s historicalfinancial information may be more useful than thatwww.willamette.com
of Company A. This is because it appears that theCompany B economic drivers are more predictable.The historical financial information of Company Cwould be more useful than that of Companies A orB. This is because it represents many data periodsand demonstrates stable economic drivers that areexpected to continue in the future.When management prepared projections areavailable along with historical financial information,the two can and should be considered side-by-side.The specific factors of the company at hand willdetermine what information will carry the mostweight and what quantitative methods the analystmay use to provide an indication of a supportableLTG rate.for the analyst to identify the economic drivers thatcompany management believes will affect the projected financial results of the business.For example, the management-prepared projections may link projected gross domestic productgrowth with sales volume, and inflation with salesprices. In instances such as these, it is prudent forthe analysts to examine the projected economicdrivers of the company, as well as the projectionsthemselves.Management-Prepared ProjectionsAn examination of projections, coupled withan examination of historical information and thefactors that affect similar businesses, can provideinsight into the factors that management expectswill affect the operation of the business. In this way,projections may provide a view of the LTG potentialof a business in the terminal period.Management-prepared financial projections aresimilarly useful to historical results of a business,especially if they provide further insight into theeconomic forces acting on the business. As noted inValuing a Business, “[s]ince the value of a businessinterest ultimately depends on what the businesswill accomplish in the future, reasonable estimatesof future expectations should help in arriving at avalue.”19When using management-prepared projections,an analyst may also consider the conditions andcare under which the projections were prepared.If the projections were prepared for a purpose thatcould call their objectivity into question (e.g., theywere prepared for litigation purposes where the litigants may hope to achieve a particular value range),an analyst may wish to take care when using theseprojections.Management-prepared projections also oftenform the basis for the discrete period projectionsused in the DCF method.Reviewing management-prepared projectionsmay be advantageous for a young business that hasnot exhibited stabilized economic returns. In thesesituations, the usefulness of historical financialinformation can be limited, given instability of thehistorical trends or the limited number of historicaldata points.In this case, management’s projections over thediscrete projection period may be more relevantthan the subject company’s historical financialstatements.Another example of when management-preparedprojections may be particularly helpful to estimatethe LTG rate is when the subject company hasrecently undergone or is projected to undergo amaterial change in the business. This change couldbe the rollout of a new product line, closing a facility, or completing an acquisition that was in thediligence stage as of the valuation date.In each of these examples, the subject companycould operate differently as of the start of the terminal period compared to the valuation date, whichcould render the historical financial
within the financial community'"2 and "if a [DCF method] reveals a valuation similar to a comparable companies or comparable transactions analysis, [the Chancery Court has] more confidence that both analyses are accurately valuing a company."3 The DCF method involves a projection of the company's results of operation for a discrete .