Transcription
The Rise ofAnalytics in HRThe era of talent intelligence is here1
About this reportThe need for high-performing talent has never been greater, so it’s more important than ever to leverage data inhuman resources. Data analytics can help organizations hire the right candidate for the right job at the right time.But building a data-driven function across every dimension of HR – from talent acquisition, performance,and workforce planning to workplace policies, employee engagement, and retention – can be complex andchallenging.Compiled through in-depth research and discussions with leading HR leaders, this report addresses many of thequestions that come with ramping up your talent analytics capabilities, including: What is the role of analytics in the evolution of the HR function? What challenges can HR analytics solve? What industries are adopting HR analytics in North America? What skills are required of leaders and teams to leverage the true value of analytics? How can the HR function move from data to insights that drive outcomes?Finally, we explore LinkedIn’s own vision for talent intelligence — the use ofdata and insights to make people your competitive advantage.2
Table of ContentsAnalytics is on the rise in HR04The adoption of HR analytics in North America07Building a data-driven HR function11Applying analytics to answer critical talent questions15Methodology273
01Analytics is on the rise in HR4
Conversations about applying data analytics to HR management aren’t new. Despite more than a decade ofdiscussion, organizations are at different maturity levels when it comes to its adoption. Some use it for simplereporting while others have gone deep and implemented sophisticated predictive analytics. The discrepancyin adoption levels can be attributed, in part, to varying objectives by industry. Some need to justify investmentsand predict risks while others are more concerned with workforce planning business decisions and peerbenchmarking.According to Deloitte’s 2017 Human Capital Trends report, 71% of companies see people analytics as a highpriority, but only 9% believe they have a good understanding of which talent dimension drives performance intheir organizations.1Even though analytics has been on HR leaders’ minds for quite some time, it’s only in the last five years thatwe’ve seen a rapid rise in adoption rates.When we looked at LinkedIn data, we found that in thelast five years in North America, there has been a 3xincrease in HR professionals who list analytics skills andkeywords on their profiles.While many HR professionals leverage analytics as part of their general HR role, an increasing number focusprimarily on HR analytics. These specialists work on teams with names like “talent analytics” and “peopleanalytics” at a number of the more forward-thinking enterprise companies.In the next section, we will explore what’s driving this trend in HR analytics.1 aurence Collins, David R. Fineman, and Akio Tsuchida, People analytics: Recalculating the route, 2017 Global Human Capital Trends,LDeloitte Insights, February 28, 20175
Behind the rise of analyticsOne major question surrounding data analytics is why its growth is happening now. As it happens, the maindrivers are pretty easy to discern. They include executive leadership, technological innovation, and an increasinglycompetitive landscape. The CEO’s relationship with the CHROAccording to the PwC CEO survey, 77% of CEOs believe the biggest threat to their business is the lack ofavailability of key skills. With CEOs so concerned about talent, it’s important for the CHRO to help plan for theworkforce of the future. HR data analytics can help answer many of the critical concerns CHROs must grapplewith, including workforce diversity, geolocation decisions, hiring strategy, competitive benchmarking, workforceplanning, and employer branding. The growth in HR technology and innovationOver the last five years, the adoption of technology has moved from static HR management solutions to moredynamic, real-time cloud and mobile-based tools and platforms. These solutions are being integrated in theareas of recruitment, collaboration, productivity, learning, wellness, and performance management. Sierra-Cedarresearch shows that 45% of large companies and 51% of mid-sized companies are increasing their spendingon HR technology. Of course, this trend is not restricted to employers – today’s technological innovation hastransformed how talent looks for work. The vast majority of candidates can now be found online. Candidateshave access to an abundance of information on companies and opportunities, allowing them to engage withrecruiters, companies, and other employees as they explore the job market.How do we identify and predictwho is going to be the next batchof successful leaders in ourorganization?Regan TaikitsadapornChief Human Resources OfficerMarriott InternationalHow do we make informeddecisions around labor mix, talentattraction, and development – even atthe end of our life cycle aroundattrition or turnover? What is the supplyof talent in the external marketplace?Paul Stratford An increasingly competitive landscapeBeyond basic consumer-facing competition, organizations are vying for the best of a limited talent pool. Thischallenge is best addressed through workforce analytics and planning, including identifying an organization’sfuture needs in terms of size, structure, type of talent, experience, skills, and industry knowledge. Analytics canalso ensure access to a pipeline of qualified candidates so companies can remain competitive in the future. Manybusinesses might know where they need to be in the next two to five years, but what about 10 to 15 years downthe road? This predictive form of analytics is becoming an irreplaceable tool for managing teams effectively,maximizing profits, and ensuring long-term success.Director of Global TalentTelstraHow impactful is our leadership,the way we work, and our processes?How strong is our culture, and do wehave the right people?Helen RussellChief People OfficerAtlassian2320th PWC CEO SurveySierra-Cedar 2016–2017 HR Systems Survey White Paper, 19th Annual Edition6
02The adoption of HR analyticsin North America7
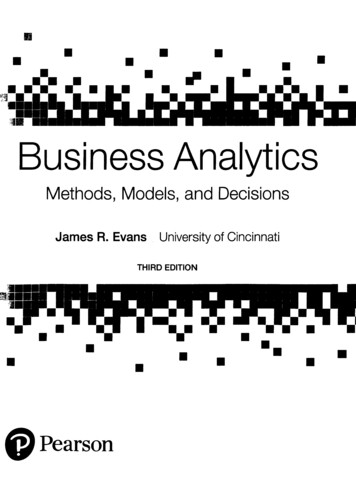
The state of HRanalytics adoption inNorth AmericaThe adoption of specialized HR analytics in NorthAmerica has been strong in the last five years (refer tosection 1) and is higher than in other global regions.Yet adoption is concentrated in certain industries andthe overall adoption rates of HR-focused analyticsteams remain low across industries.NORTH AMERICA - ALL COMPANIES WITH HR% OF COMPANIES APPLYING ANALYTICS IN HR BY INDUSTRYCompanies leveraging analytics in HRCompanies with dedicated HR analytics roles50%40%10%gngineerinArchitecture &Eustrialcturing/IndManufa& ero/Aervicesional SProfessuctser ProdonsumRetail &Cwarey - HardTechnologticalsarmaceuare & PhHealthcOil & Energyy - Software0%TechnologAt the other end of the spectrum, architecture andmanufacturing companies have among the lowestrates of HR analytics adoption.20%l ServicesThe industries with the most widespread adoption ofanalytics in HR are finance and tech-software. Buttheir use of HR analytics roles and responsibilitiesare different. While finance has the highest adoptionrates across industries, more tech HR professionalsuse analytics in their roles. That is, in tech-software,there are over nine employees leveraging analytics inHR on average compared to six at the average financecompany.30%FinanciaOverall, 22% of companies haveadopted HR analytics, and 11%have adopted the role itself.8
NORTH AMERICA - ALL COMPANIES WITH HRTOP INDUSTRIES WITH ADOPTION OF HR ANALYTICS BY METRO AREA1. New York2. San Francisco3. Washington, D.C.4. Chicago5. BostonFinancial Services &InsuranceTechnology - SoftwareAero/Auto/TransportTechnology - SoftwareTechnology - SoftwareProfessional ServicesTechnology HardwareTechnology - SoftwareFinancial Services &InsuranceHealthcare &PharmaceuticalTechnology - SoftwareFinancial Services &InsuranceFinancial Services &InsuranceTechnology HardwareFinancial Services &Insurance6. Los Angeles7. Dallas/Fort Worth8. Atlanta9. Toronto10. SeattleMedia & EntertainmentTelecommunicationsTechnology - SoftwareFinancial Services &InsuranceTechnology HardwareHealthcare &PharmaceuticalTechnology - SoftwareTechnology HardwareTelecommunicationsMedia & EntertainmentTechnology - SoftwareFinancial Services &InsuranceFinancial Services &InsuranceTechnology - SoftwareTechnology - SoftwareIndustries adoptingHR analytics bymetro areaNew York, San Francisco, and Washington, D.C.are the top regions in North America by volume ofprofessionals whose profiles indicate some capacitywith HR analytics work. And, interestingly, HR analyticsadoption by industries varies across the top 10markets for this talent pool. Across regions, financeand tech appear consistently at the top of each list.The two outliers are healthcare in Boston and mediaand entertainment in Los Angeles.That said, perhaps the most eye-opening takeaway isthe number of leading North American industries notrepresented. The public sector (includinggovernment, education, and nonprofit companies)has not adopted HR analytics at the scale of someother industries, despite being top employers inseveral cities. As another example, retail andconsumer products, a top industry in Atlanta, is alsolagging when it comes to HR analytics adoption.* Top regions in North America are based on the volume of professionals whose profiles indicated they deal in some capacity with HR analytics work — a subset ofthese professionals also have HR analytics titles. Only companies with at least 501 employees and with employees who work in HR in general were included in thisanalysis. Adoption defined based on number of companies in the industry that leverage analytics in HR roles (including those with generic HR titles and HR analyticstopics mentioned elsewhere on their profiles).9
The focus foranalytics differsamong metro areaBased on specialty information listed on the LinkedInprofiles of professionals using HR analytics, we canassess the areas they focus on within their fields.Compensation, benefits, productivity, and performanceare the most established focus areas, making a nearclean sweep across metro regions, while retention andemployer brand receive less focus across all regions.In San Francisco, where tech is the top industry byemployment volume, culture and diversity appearshigher on the list than in other cities. An increasedspotlight on diversity (or lack thereof) at techcompanies in the mainstream media could be areason for the heavy focus on that topic.4 Of course,with larger HR analytics teams (on average) at techcompanies, they may simply have greater bandwidthto take on more experimental analytical projects. Andit can’t be discounted that the lack of focus on cultureand diversity analysis in most major metros could be aresult of poor data availability and quality. For example,according to Fortune, only 3% of companies on the2017 Fortune 500 list were fully transparent aboutdiversity data.5Los Angeles – which has seen a net outflow of talentto San Francisco in recent months – is perhapsunsurprisingly more focused on talent acquisition thanany of the other top metro areas in the North Americanregion.6In Washington, D.C., a city with among the largestlevels of skill scarcity, workforce planning ranks higherthan the other metro areas.7 lanca Myers, Women and Minorities in Tech, by the Numbers, Wired.com,BMarch 27, 20185 Stacy Jones and Grace Donnelly, Why We Logged Every Fortune 500Company’s Diversity Data, Or Lack Thereof, Fortune, June 16, 20176LinkedIn Workforce Report, May 4, 20187Ibid4NORTH AMERICA - PROFESSIONALS WHO LEVERAGE ANALYTICS IN HRTOP USE CASES FOR HR ANALYTICS BY REGION1. New York2. San Francisco3. Washington, D.C.4. Chicago5. BostonCompensation & BenefitsCompensation & BenefitsCompensation & BenefitsCompensation & BenefitsCompensation & BenefitsProductivity &PerformanceProductivity &PerformanceProductivity &PerformanceProductivity &PerformanceProductivity &PerformanceTalent DevelopmentCulture & DiversityWorkforce PlanningTalent AcquisitionTalent AcquisitionCulture & DiversityTalent AcquisitionTalent DevelopmentTalent DevelopmentTalent DevelopmentTalent AcquisitionTalent DevelopmentTalent AcquisitionCulture & DiversityCulture & DiversityEmployee EngagementEmployee EngagementCulture & DiversityWorkforce PlanningEmployee EngagementWorkforce PlanningWorkforce PlanningEmployee EngagementEmployee EngagementWorkforce ionEmployer BrandEmployer BrandEmployer BrandEmployer BrandEmployer Brand6. Los Angeles7. Dallas/Fort Worth8. Atlanta9. Toronto10. SeattleCompensation & BenefitsCompensation & BenefitsCompensation & BenefitsCompensation & BenefitsCompensation & BenefitsTalent AcquisitionProductivity &PerformanceProductivity &PerformanceProductivity &PerformanceProductivity &PerformanceProductivity &PerformanceTalent DevelopmentTalent DevelopmentTalent AcquisitionTalent DevelopmentTalent DevelopmentTalent AcquisitionTalent AcquisitionTalent DevelopmentCulture & DiversityCulture & DiversityCulture & DiversityCulture & DiversityCulture & DiversityTalent AcquisitionEmployee EngagementWorkforce PlanningEmployee EngagementEmployee EngagementWorkforce PlanningWorkforce PlanningEmployee EngagementWorkforce PlanningWorkforce PlanningEmployee ntionEmployer BrandEmployer BrandEmployer BrandEmployer BrandEmployer Brand* Top regions in North America are based on the volume of professionals whose profiles indicated they deal in some capacity with HR analytics work— a subset of these professionals also have HR analytics titles. In this analysis, topic rankings are defined based on volume of profile mentions byprofessionals that leverage analytics in HR.10
03Building a data-drivenHR function11
David WhiteSenior Director, Talent InsightsLinkedInSTRUCTURING AN HR DATA ANALYTICS TEAMWe spoke with David White, Senior Directorand leader of LinkedIn’s analytics functionin the HR department, to learn about thecompany’s structure, goals, and operations.ConsultingSingle Point Contacts for HR Leadership TeamLine of Business & Center of Excellence Consulting, Analysis & InsightsBuilding an Insights-Driven CultureLinkedIn’s HR department has a specialized analyticsteam whose mission is “better, faster talent decisions.”The objective of the team is to turn talent data intoinsights that drive action, as well as measure andimprove results once action is taken. LinkedIn’sanalytics function is composed of 16 people andbroken into three key specialties: data, consulting, andresearch. It reports directly to the CHRO.The team has a wide range of technical andfunctional skills, including statistics, machine learning,programming languages (ex: R, Presto, Hadoop),consulting, survey research, and organizationalpsychology. Balancing the teams’ skills is critical,because applying talent analytics effectively requiresmultiple disciplines working toward a single goal.To stay on task, the talent analytics team has anembedded member within its HR business partners,keeping the line of communication open, aligningobjectives and strategies, and ensuring the analyticsteam doesn’t operate in a silo.The team seeks to solve a number of business issues,including workforce effectiveness, workforce planning,talent acquisition, and diversity. More recently, theteam has partnered with engineering to create ageolocation strategy for new products and markets,allowing LinkedIn to better understand its competitivelandscape.DataTalent Portal (self-service)Scaleable and Repeatable VisualizationsData Modeling and StructureResearchDeep Competitive InsightsArtificial Intelligence/Machine LearningLongitudinal Research12
Building skills andcapabilitiesBuilding an effective HR analytics team requires anunderstanding of the skills you need on hand. Welooked at the skill profiles of professionals who workedon some form of talent analytics and we found threedistinct skill sets: HR Domain: Skills include recruiting and placement,compensation and benefits, talent management,employee engagement, employer branding, andworkforce planning. Domain knowledge is key toapplying statistics and analytics to ensure thatyou’re addressing the right problems with the rightapproach. Business & Strategic Thinking: Skills include businessdevelopment and relationship management, as wellas skills that are important but difficult to quantify(such as leadership). A critical component of anytalent analytics work is the ability to develop afunctional hypothesis, convert data into actionableinsights, communicate those insights articulately,and make data-driven recommendations for thebusiness. Data & Analytics: Skills include everything from HRsoftware expertise, statistical analysis and datamining to big data and machine learning. Analyticsspecialists need to understand data and know whichare the right tools to use when cleaning, extracting,combining, analyzing, and/or visualizing datasets.SKILLS RELEVANT TO GENERALHR PROFESSIONALS VS. HR ANALYTICS SPECIALISTSHR DomainData AnalyticsRecruiting and PlacementSourcingStatistical Analysis and DataMiningHR Analytics, Data Analytics,Data Management Statistics,Data Mining, Predicitve AnalysisSAS, R, PythonCompensation and BenefitsPayroll, Benefits negotiationOther HR Domain SkillsTalent Management, EmployeeEngagement, Employer Branding,Workforce Planning, EmployeeTraining, OrganizationalDevelopmentStrategyBusiness Development andRelationship ManagementStrategy and StrategicPlanningBusiness AnalysisManagement and LeadershipBusiness IntelligenceSAP Business Objects, TableauHR membersadoptinganalytics18%Big Data and MachineLearningMarket Research and InsightsQuantitative and QualitativeResearch, Market ResearchHR softwareSAP products, SAP ERP, ATS,Taleo, HRIS, Data Management,Workday, PeoplesoftData Engineering and DataWarehousingData Marts, Data Integration,Data GovernanceDatabase Management &SoftwareSQL, Databases13
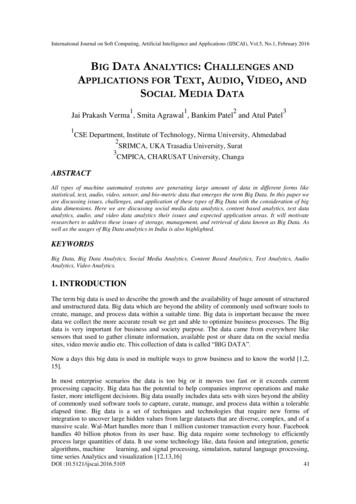
Goal-specific skillsNORTH AMERICA — PROFESSIONALS WHO LEVERAGE ANALYTICS IN HRSKILL SET REQUIRED FOR HR ANALYTICS BY USE CASEOf course, a one-size-fits-all approach for skillsdevelopment is never the smartest strategy. Theskills required changes based on the type of analysisrequired. For example, professionals who worked ontalent analytics related to culture and diversity are morelikely to have market research and insight skills whilethose with a workforce planning focus are typicallymore skilled in HR software and business analysis.In fact, 17% of professionals who use analytics toaddress culture and diversity list skills related to marketresearch on their profiles compared to the 10% whosefocus is on workforce planning.HR Software60%Machine Learning40%Statistical Analysisand Data Mining20%Business AnalysisBig Data0%Data Engineering andData WarehousingMarket Researchand InsightsBusiness IntelligenceDatabase Management and SoftwareWorkforce PlanningCulture & Diversity17% of professionals using analytics to address Culture &Diversity have Market Research & Insights skills, compared to just10% of those with a Workforce Planning focus.14
04Applying analytics to answercritical talent questions15
Successful adoption of analytics dependson how you apply itIntroducing an analytics function into your HR team goes beyond simply investing in talent with the right skillsand identifying key business focus areas – you also need to understand where and how to apply it in a practicalsense.The key to success in utilizing data is understanding how to apply it to your business, your needs, and yourorganizational goals. Whether it’s the recruiter, HR business partner, VP HR, or the learning & developmentconsultant, it’s HR professionals who are using data and insights to make a business case, highlight gaps, andhave strategic conversations with senior leadership. Thus, access to analytics makes HR professionals moreefficient in their jobs and provides them with the tools to elevate their position in the organization.The vision should be to make analytics available in a digestible format that is simple to access, so the general HRpractitioner can easily reference and use it.In fact, many organizations already provide – or plan to provide – a majority of HR data to HR business partners.By sharing data, the analytics and respective insights won’t be wasted by sitting in a siloed, specialized team,and are instead available for the entire HR function.In this section, you’ll learn about LinkedIn’s vision for the application ofanalytics and how you can use insights to fuel your talent strategy.16
Talent intelligenceLINKEDIN HAS CREATED THE WORLD’S LARGEST TALENTMARKETPLACE WHERE CANDIDATES AND COMPANIESINTERACT EVERY DAYLinkedIn’s vision is to create economic opportunity forevery member of the global workforce. Executing onthat vision begins with mapping the digital economy –or creating the world’s first economic graph.LinkedIn’s Economic Graph is a digital representationof the global economy based on data generatedfrom 560 million members, 50,000 skills, 20 millionemployers, more than 15 million open jobs, and 60,000educational institutions.LinkedIn has created the world’s largest talentmarketplace where candidates and companies areinteracting every single day. While 10 years ago wehad a relatively small collection of profiles and someengagement, we now have a robust community wherebillions of interactions are taking place every day.The insights generated from these billions ofinteractions can enable today’s HR leaders to answersome of the most deep and complex questions raisedby the CEO and senior business leaders.This ammunition adds a data-driven foundation toyour point of view, your experience, and yourdecisions.Talent intelligence can enable your team to marry theirinstincts with these insights to make the right decisionsor elevate their position in the organization, while alsoensuring that people are a competitive advantage forthe business.ConnectionsEducationIndustryConnections at companyOpen candidateAlumniSkillsMacro labor trendsLocation interestJob cationJob searchesCompany sizeSalaryCurrent employeesContent viewJob viewsCompanies followedCulture & valuesSimilar companiesIn the next few pages, find out howorganizations can use insights fromLinkedIn to answer critical questionsacross the employee life cycle.17
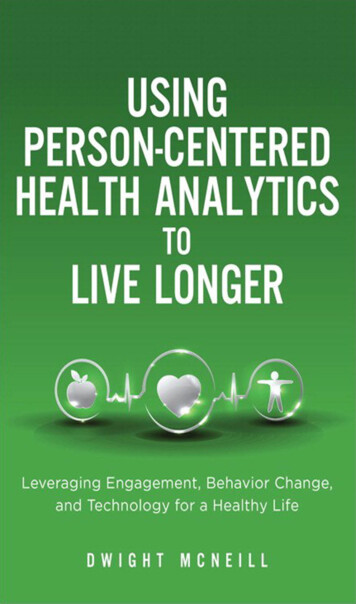
WorkforcePlanningEmployeeEngagement& gagementTalent Pool AnalysisFIND THE RIGHT TALENT IN THE RIGHT LOCATIONTALENT DEMOGRAPHIC AND COMPETITIONThe graph below shows supply and demand of talent for a job profile or skill set. This includes talent poolcompetition in different cities, which can help you make decisions on pipelining, talent acquisition strategy,employer branding investment, and geo-location strategy.Overview Why do I find it difficult to hire talent with certainskill sets?Supply and Demand RegionProfessionals on LinkedIn Where should I open my new Research &Development center or my new office?406K Do I need to evaluate and increase my employerbranding investment?Competition for TalentLowModerateWorkforce Planning:This analysis shows competition for the talent poolin different cities, which helps an organization makedecisions on pipelining, competitive talentacquisition strategy, employer branding investmentand geo-location strategy.HighLevel of competition is in the top 50%compared to other talent poolsCompetition Trend0.2%change in avg. InMails per memberlast 12 months vs. prior 12 monthsSize of Bubble: Indicates the total # of LI professionals in regioncolor: Indicates the competition for talent, derived from Recruiter InMailmessages receivedHigh CompetitionModerateSupplyCompetition for TalentLocationProfessionalsDemand1New York, NY42KHigher2Los Angeles, CA20KHidden Gem3Chicago, IL20KHigherTrendLowHidden GemAvg. Annual Comp 95K- 88K 94K18
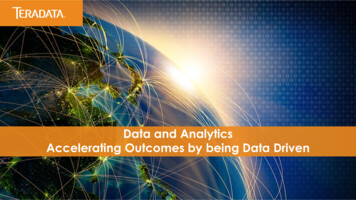
EmployeeEngagement& RetentionAlumniEngagementGender DiversityUNDERSTAND ENGAGEMENT WITH FEMALE TALENTGender Diversity:40%Attracting Female Talent How do I build a gender diverse workforce?of members who engaged with you onLinkedIn are women. Why do I find it difficult to engage and hirefemale leaders?*Engagement includes members who follow/viewyour LinkedIn page or view your jobs. How does my organization compare to competitorswith respect to diversity? As compared to your industry over timeThis type of analysis shows how femaletalent engages with your organization compared toindustry and peer averages across functions andseniority levels. It can be used for benchmarking andrevealing areas of opportunities for you, whichcan lead to decisions on diversity initiatives andemployer branding. Across business functions% of engaged members that are womenYourPeerIndustryCompany Average 22%Finance39%43%34%Human Resources61%58%52%IT32%31%22%32%30%28%Jun 15Sept 15Your CompanyDec 15Mar 16Jun 16Peer AverageSept 16Dec 16Mar 17Industry Average19
WorkforcePlanningTalentSourcingEmployeeEngagement& rce Skills DensityCOMPARING SKILLS DENSITY TO IDENTIFY STRENGTHS & GAPSYOUR ENGINEERING WORKFORCE HAS A HIGHER CONCENTRATION OF AI, CYBER SECURITY &CLOUD COMPUTING SKILLS COMPARED WITH PEERS How does the skills profile of myworkforce compare to my competitors?Big Data94% What competencies are my competitorsinvesting in?75% Where should I focus in reskilling andupskilling my workforce?56%37%Cyber Security19%Artificial IntelligenceEngineers in your companySkills Analysis:MobileDevelopmentThis type of analysis shows how your organizationcompares to your competitors in the penetrationand adoption of certain skills. It can be usedfor various purposes, such as analyzing skillsgaps, understanding competitors’ investment incapabilities, and building out the upskilling andreskilling strategy for your workforce.Cloud ComputingEngineers in peer company20
TalentSourcingWorkforcePlanningEmployeeEngagement& DevelopmentEmployeeRetentionAlumniEngagementBrand AuditMEASURING THE STRENGTH OF A COMPANY’S EMPLOYER BRANDYOUR COMPANY’S TALENT BRAND RANKS THIRD OF EIGHT COMPETITORS20%18%Talent Sourcing: How strong is my employer brandcompared to my competitors?18%16%The employer of choice has a brandthat is 1.6x stronger than yours! Is my employer brand growing stronger orweaker over time? How can I grow my employer brand?16%14%AVG TBI: 11.8%11%12%10%10%9%10%Peers9% Peers A7%8%3 of 8This type of analysis shows how your organizationcompares with peers with respect to the Talent BrandIndex (TBI). The Talent Brand Index is calculated basedon engagement of LinkedIn members with your Jobsand Career Page on LinkedIn. Peers B Peers C Peers D6% Peers E Peers F4% Peers G2%0%Employerof choiceWeakertalent brand21
WorkforcePlanningTalentSourcingEmployeeEngagement& al MobilityUNDERSTAND INTERNAL MOVEMENT BETWEEN DEPARTMENTSIDENTIFY THE MOST COMMON CROSS-FUNCTIONAL MOVEMENTS AMONG YOUR EMPLOYEESEmployee Engagement& Development: What are the most common internal movements? Which internal mobility paths lead tohigher retention?This type of analysis shows the most common internalcareer paths for your employees. You can benchmarkthis against your peers and industry to build careergrowth plans for high potential talent, which will help toprevent attrition of top talent.22
Case Study: NielsenEmployee Engagement& DevelopmentUsing data to identify internal mobility as a key to retentionOne of Nielsen’s businesses engaged its People Analytics team to understand why the company was losingtalent. Starting with five years of people data in a (big) spreadsheet and some hypotheses, they identified thefactors most highly correlated with attrition.The biggest finding was that employees with a change in job responsibilities due to promotion or lateralmovement within the past two years were much less likely to leave. This insight prompted Nielsen’s leadershipto make it easier for employees to pursue jobs internally, identify “at-risk” high performers, and proactively putopportunities in front of them.The ImpactMore opportunities for employeesThere was an 8x increase in internal mobility in the initiative’s first year.This was the furthest thing froman academic exercise. This directlyimpacted the business. Everybody feelsretention. The data let us make solidrecommendations that the companycould take action on immediately.Chris LouieSVP, People Analytics and TalentAcquisition, NielsenIncreased employee retentionMost groups achieved a 5-10% increase in annual retention of their at-risk employees.Immediate credibility for talent analyticsThe analysis caught the attention of other business leaders and has since been replicated for other Nielsen units.23
TalentSourcingWorkforcePlanningEmployeeEngagement& ion & Tenure AnalysisCOMPARE ATTRITION RATES AND TENURE WITH INDUSTRY PEERSYOUR COMPANY’S ATTRITION IS HIGHEST BETWEEN THREE AND SIX MONTHS OF JOINING,COMPARABLE TO INDUSTRY PEERSAttrition % vs. PeersYour company26%Peer 1Peer 225%23%Peer 3Employee Retention:24% What types of roles have the highest attrition rate? What is the average tenure of your employees?Attrition by TenureYour companyPeer 1Peer 2Peer 3This analysis shows the tenure of your employees, andwhen they are most likely to leave.39%38%37% 37%30%26%19% 19%15%10% 10%20% 20%18%13%13%11%9% 3 months9%7%3-6 months7-9 months10-12 months 12 months24
WorkforcePlanningTalentSourcingEmployeeEngagement& DevelopmentEmp
Data analytics can help organizations hire the right candidate for the right job at the right time. . According to the PwC CEO survey, 77% of CEOs believe the biggest threat to their business is the lack of availability of key skills. With CEOs so concerned about talent, it's important for the CHRO to help plan for the .