Transcription
Interim Report on the Malpractice Relative ValueUnits for the CY 2018 Medicare Physician FeeScheduleJuly 2017Acumen, LLC500 Airport Blvd., Suite 365Burlingame, CA 94010
EXECUTIVE SUMMARYThe Centers for Medicare and Medicaid Services (CMS) pays physicians for theirservices according to the Physician Fee Schedule (PFS), which specifies payment policies andamounts for several thousand services. Payments for services paid under the PFS are determinedbased on relative value units (RVUs) for each service that are set using a methodology referredto as the resource-based relative value scale (RBRVS). In this method, each procedure isinterpreted as being produced by a combination of three categories of inputs: practitioner work,practice expense (PE), and malpractice insurance (MP). A payment for a procedure depends onits assigned RVUs and the input prices assessed for each RVU component based on a variety ofdata sources.As mandated under Section 1848(c) of the Social Security Act, CMS is required toestablish national RVUs for each of the three categories of inputs. The MP RVUs, which reflectthe relative costs of professional liability insurance to practitioners, were first implemented in thePFS final rule published November 2, 1999. 1 Section 1848(c)(2)(B)(i) of the Act requires thatCMS review and, if necessary, adjust RVUs at least once every five years. Beginning with theCY 2016 PFS final rule, CMS updates the MP RVUs annually based on a Medicare claims-basedspecialty mix for each service. CMS generally updates the malpractice insurance premium dataevery five years; these premiums are used to reflect the amount of malpractice insurancetypically required to furnish medical services. Using more recent data ensures that the MPRVUs closely reflect malpractice insurance premium trends. CMS last updated the malpracticepremium data used to construct MP RVUs in the CY 2015 PFS final rule (“CY 2015 Update”).Based on established precedent, the next MP RVU update will occur no later than CY 2020.After evaluating both the current data and methods CMS uses to calculate the MP RVUsand assessing other means of determining MP RVUs, Acumen recommends that CMSimplement six modifications to the MP RVU framework for the next MP RVU update. Thesemodifications include updating:1. The methodology to construct MP RVUs;2. The malpractice premium data;3. The malpractice premium amount reflecting technical component procedures;4. The Current Procedural Terminology RVUs and Services (CRS) dataset;5. The American Community Survey (ACS) Population Estimates dataset; and6. The Geographic Practice Cost Index (GPCI) dataset.164 FR 59380Report on the CY 2018 Update of the MP RVUs for the Medicare PFS Acumen, LLC ii
Acumen recommends these modifications for several reasons. First, the proposed methodologicalchanges to the MP RVU calculations ensure that the RVUs are calculated in an effective mannerconsistent with the RBRVS method, in which physician payment should reflect the relativeresources involved in furnishing a service. Second, updating malpractice premium data for alltypes of procedures generates MP RVUs that are more reflective of recent premium trends.Third, using recent data on RVUs, population estimates, and geographic cost variation createsmore representative MP RVUs.The remainder of the Executive Summary provides additional information about RVUsand highlights this report’s key findings. The first section reviews how Medicare uses RVUswithin the PFS. The second section discusses proposed refinements to the MP RVU calculationmethodology. The third section describes how updated data was used to construct the specialtyrisk factors. Finally, the fourth section concludes with highlights from the empirical analysis ofthe impact of the above changes.How RVUs Affect Practitioner PaymentsUnder the PFS, Medicare pays practitioners for care based on a list of services and theirpayment rates. Every practitioner service corresponds to a specific procedure code within theHealthcare Common Procedure Coding System (HCPCS); many services are further classifiedby modifier (MOD) type. Payments for each service depend on the relative amounts of inputsrequired to perform the procedure. These inputs include the amount of practitioner work neededto furnish a medical service, expenses related to maintaining a practice, and malpracticeinsurance costs. CMS estimates the quantity of inputs involved in furnishing these servicesunder the PFS using work RVUs, PE RVUs, and MP RVUs. Higher RVU levels indicate thatthe service requires more relative resources.CMS measures the regional variation of each of the three input categories usingGeographic Practice Cost Indices (GPCIs). GPCIs increase the price associated with an RVU inhigh cost regions and decrease the price associated with an RVU in low cost regions. GPCIs arebudget neutral (except when exempted by statute) and do not affect aggregate payment levels;rather, they reallocate payment rates by locality to reflect regional variation in relative inputprices. For instance, a PE GPCI of 1.2 indicates that practice expenses in that area are 20 percentabove the national average, whereas a PE GPCI of 0.8 indicates that practice expenses in thatarea are 20 percent below the national average.To translate the sum of the GPCI-adjusted RVUs into a PFS payment amount for amedical service, CMS applies an established conversion factor. Equation (1) belowdemonstrates how the work, PE, and MP RVUs combine with the three GPCIs and the CF toestablish a practitioner payment for any procedure code HCPCS in Medicare locality L:Report on the CY 2018 Update of the MP RVUs for the Medicare PFS Acumen, LLC iii
��𝑃𝐻𝐻𝐻𝐻𝐻𝐻𝐻𝐻𝐻𝐻 ,𝐿𝐿 ��𝑊𝑊𝑊,𝐿𝐿 ��𝑊 ,𝐻𝐻𝐻𝐻𝐻𝐻𝐻𝐻𝐻𝐻 ���𝐿 𝑅𝑅𝑅𝑅𝑅𝑅𝑃𝑃𝑃𝑃 ,𝐻𝐻𝐻𝐻𝐻𝐻𝐻𝐻𝐻𝐻 ���𝐿 𝑅𝑅𝑅𝑅𝑅𝑅𝑀𝑀𝑀𝑀 ,𝐻𝐻𝐻𝐻𝐻𝐻𝐻𝐻𝐻𝐻 𝐶𝐶𝐶𝐶(1)Modifying the MP RVU MethodologyThe first modification proposed in this report is to refine three components of themethodology used to calculate MP RVUs: national average malpractice premiums, specialty riskfactors, and raw MP RVU values. The ultimate goal of evaluating the MP RVU methodology isto ensure that the calculations accurately account for regional variation in malpractice premiumsand generate an interpretable scale to gauge the relative risk of each medical specialty. The MPRVU methodology should be consistent with the RBRVS and the general methods forcalculating work and PE RVUs.MP RVUs are determined in four broad steps:1. Calculate a national average MP premium for each specialty,2. Normalize specialty premiums to create a specialty-specific risk factor,3. Calculate unadjusted MP RVUs for each service based on the volume of practitionersthat perform a service, and4. Adjust the RVUs for budget neutrality.Acumen identified three decision points in these four steps where changes could be madeto update the MP RVU methodology. The three points are: 1) the method used to computenational average MP premiums for each specialty, 2) the approach used to normalize specialtypremiums, and 3) the interpretation of the malpractice premium data collected from insurers. Foreach decision point, Acumen conducted exploratory data analyses to assess the impacts ofmaking a change by comparing the results of each methodological option.First, Acumen began by evaluating several methods to calculate national averagepremiums (i.e., the first step of the MP RVU calculations). Beginning CY 2016, CMSincorporated population estimates from the ACS as weights for specialty premiums. The ACSestimates replaced the use of total RVU and MP RVUs to weight specialty premiums in the CY2015 MP RVU Update. This change was implemented following CMS’s determination thatusing RVUs as weights introduced the potential for circularity in the MP RVU calculations.Acumen examined the differences in national average premiums across specialties thatresult from four calculation methods:1. Using population estimates as weights for price-adjusted premiums (i.e., the CYs2016 and 2017 methodology)Report on the CY 2018 Update of the MP RVUs for the Medicare PFS Acumen, LLC iv
2. Using only work and PE RVUs as weights for price-adjusted premiums3. Using total RVUs as weights for price-adjusted premiums4. Using total and MP RVUs as weights (i.e., the CY 2015 methodology)In Methods 1 – 3, the national average premiums were calculated by determining the weightedaverage of the premiums and then normalizing by the MP GPCI. In Method 4, the premiumswere geographically normalized before finding the average.No substantial differences in the national average premiums by specialty were observedamong these different methods. Consequently, CMS decided to maintain the CY 2016/2017methodology of using population estimates from the ACS as weights for malpractice specialtypremiums.Second, Acumen investigated the impacts of two options for determining final riskfactors, which is the second step of MP RVU calculations. Currently, each specialty premium isnormalized relative to the value of the lowest specialty premium. We compared the impacts of:1. Normalizing each specialty premium to the value of the lowest specialty premium2. Normalizing each specialty premium to the average value of all premiumsThe first method measures each specialty’s excess risk relative to the specialty with the lowestpremium. The second method produces risk factors that normalize around 1.0, measuring eachspecialty’s risk relative to the average of all premiums; this method is more consistent with thePE RVU and GPCI methodologies. However, the data revealed that normalizing to either thelowest or the average specialty premium had no impact on the final, budget-neutralized MPRVUs. Thus, CMS will maintain its current methodology of normalizing each premium to thelowest specialty premium amount.Third, Acumen evaluated two options for interpreting malpractice premium data thatimpact the raw MP RVU calculations, which is the third step in the MP RVU calculationprocess. As noted in Section 2.2.3, the current methodology assumes that the malpracticepremium data reflect global procedures, or the malpractice liability associated with bothpractitioner work and technical supplies/overhead. This interpretation was used for the CY 2010and CY 2015 MP RVU updates. However, another possible interpretation is that the malpracticepremium data reflect professional component procedures (i.e., the liability associated withpractitioner work). This assumption was made in the CY 2005 MP RVU update. Compared tothe global data interpretation, the professional data interpretation results in lower MP RVUs forsingle HCPCS codes but higher MP RVUs for global HCPCS codes. 2 Based on these results,2Single HCPCS codes are those that are not eligible to be billed as a global, professional, or technical servicethrough the use of a modifier code.Report on the CY 2018 Update of the MP RVUs for the Medicare PFS Acumen, LLC v
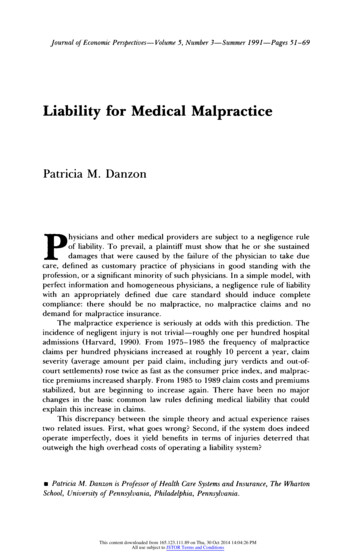
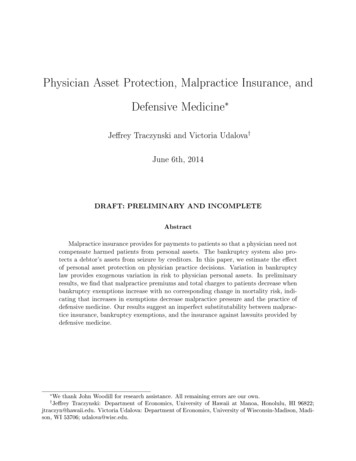
CMS determined that it will continue to interpret collected MP premium data as representingglobal procedures.Calculating the Specialty Risk Factors with Updated DataFour major modifications were made to update the data sources currently used tocalculate the specialty risk factors. Table 1 below summarizes the data sources for the specialtyrisk factors and compares them to the CY 2017 MP RVU data sources.Table 1. Comparison of Specialty Risk Factor Data Sources for CY 2015 and 2018MP RVUsRisk Factor Calculation DataSourceSourceCY 2018 UpdateCY 2015UpdateStateDepartments ofInsurance2014 – 20152011 - 2012U.S. CensusBureau2015N/ACurrent ProceduralTerminology RVUs andServices (CRS) FileCMS20152013Geographic Practice Cost IndexCMS20172014Malpractice PremiumsAmerican Community Survey(ACS) Population EstimatesSummary of the Predicted Impacts on MP RVUsTo assess the effect of updating the data and methodology used to calculate MP RVUs asa whole, Acumen conducted a detailed impact analysis of the newly updated specialty riskfactors. The goal of this analysis was to observe differences between the CY 2017 raw MPRVUs and the modeled MP RVUs based on the updated MP RVU methodology. For thepurposes of assessing impacts, some smaller specialties were grouped with larger ones. Acrosswalk detailing these aggregations is available in Appendix E. Table 2 below presents thepercent changes in MP RVUs by specialty group. Overall, Acumen found that the use of updatedspecialty risk factors did not make a substantial impact on total RVUS. While the impacts on MPRVUs for specific specialty groups is more noticeable, these changes are in line with pastupdates.Table 2. Impact by Specialty GroupReport on the CY 2018 Update of the MP RVUs for the Medicare PFS Acumen, LLC vi
MP RVUsGroup CMS S pecialty#NameMTUSTotal ternal M 527 508,195 2,766-25.3%181,552,573 179,491,579-1.1%10Family 9 ,729,392-3.1%150,143,548 963,520-24.2%92,444,82491,496,387-1.0%50Nurse gery28,063,5537,793,8957,911,1401.5%102,954,510 103,071,7540.1%Report on the CY 2018 Update of the MP RVUs for the Medicare PFS Acumen, LLC vii
TABLE OF CONTENTSExecutive Summary . ii1 Introduction . 112 Refining the MP RVU Methodology . 132.1 How RVUs Affect Practitioner Payments . 132.2 Current Policy for Calculating MP RVUs . 152.2.1 Step 1: Calculating the National Average Premiums . 162.2.2 Step 2: Calculating the Specialty Risk Factors . 172.2.3 Step 3: Calculating the MP RVUs by Procedure . 182.2.4 Step 4: Calculating the MP RVUs Adjusted for Budget Neutrality . 202.3 Proposed Policy for Calculating MP RVUs. 212.3.1 National Average Premiums . 212.3.2 Specialty Risk Factors. 232.3.3 Raw MP RVUs . 243 Updating Malpractice Premium Data. 253.1 Malpractice Premium Data Collection. 253.1.1 Defining a Standard for Malpractice Policies . 253.1.2 Identifying the Primary Medical Malpractice Underwriters. 263.1.3 Collecting Malpractice Premium Data. 283.1.4 Collecting Patient Compensation Fund Surcharges. 283.2 Constructing the Malpractice Premium Dataset . 293.2.1 Validating and Verifying Malpractice Premium Data . 303.2.2 Adjusting for Missing Data. 303.3 Defining Specialties . 313.3.1 Specialty Crosswalk . 353.3.2 Classifying Specialties by Surgery Class. 353.3.3 Specialties with Insufficient Coverage and Extreme Variation in PremiumAmounts . 373.4 Technical Component Data Update . 394 Updating Input Datasets. 414.1 Current Procedural Terminology RVUs and Services (CRS) File . 414.2 American Community Survey Population Estimates . 414.3 Geographic Practice Cost Index (GPCI) File. 415 Impact of the Modelled MP RVUs . 425.1 Overall Impact and Impact by HCPCS Code Type . 425.2 Impact by Specialty. 43References . 47Appendix A : National Average Malpractice Premiums and Risk Factors by Specialty. 48Appendix B : Datasets Used for MP RVU Calculations. 52B.1 Medicare PFS (MPFS) Relative Value File . 52B.2 Clinical RVUs File. 52B.3 Discounted Utilization Files . 52Appendix C : Surgical Codes Outside 10000-69999 Range . 53Appendix D : Impact ANalysis Specialty Crosswalk . 54Appendix E : Malpractice Pre mium Data Availability by Specialty . 57Appendix F : Data Sources for Modelled MP RVUs . 63Report on the CY 2018 Update of the MP RVUs for the Medicare PFS Acumen, LLC viii
LIST OF TABLES AND FIGURESTable 2.1 Distinctions Among Professional Component, Technical Component, and GlobalCodes. 13Table 2.2 MP RVU Data Overview . 15Table 2.3 HCPCS Code Surgery Classes. 18Table 2.4 CY 2017 Work and MP RVU Values by Component for HCPCS 73610: X-Ray Examof Ankle. 20Table 2.5 National Average Premium Options . 22Table 2.6 National Average Premium Distributions Across Options . 23Table 3.1 Elements of Malpractice Insurance and Methodological Decisions. 26Table 3.2 NAIC Market Share by State . 27Table 3.3 States with Mandatory or Voluntary PCFs . 29Table 3.4 CY 2017 Physician Fee Schedule Utilization by Specialty . 32Table 3.5 Surgery Class Scenarios. 36Table 3.6 Surgery Class Scenarios. 36Table 3.7 Reassigned Specialties with Insufficient Coverage, No State Coverage, and ExtremeVariation in Premium Amounts . 37Table 3.8 Technical Component Data Options . 40Report on the CY 2018 Update of the MP RVUs for the Medicare PFS Acumen, LLC ix
[This page is intentionally left blank.]Report on the CY 2018 Update of the MP RVUs for the Medicare PFS Acumen, LLC x
1 INTRODUCTIONThe Centers for Medicare and Medicaid Services (CMS) pays physicians for theirservices according to the Physician Fee Schedule (PFS), which specifies payment amounts andpolicies for several thousand services. Payments for services paid under the PFS are determinedbased on relative value units (RVUs) for each service that are set using a methodology referredto as the resource-based relative value scale (RBRVS). In this method, each service isinterpreted as being produced by a combination of three categories of resource inputs:practitioner work, practice expense (PE), and malpractice insurance (MP). A payment for aservice depends on its assigned RVUs and the relative resources assessed for each RVUcomponent based on a variety of data sources.As mandated under Section 1848(c) of the Social Security Act, CMS is required toestablish national RVUs for each of the three categories of resource inputs. The MP RVUs,which reflect the relative costs of professional liability insurance to practitioners, were firstimplemented in the PFS final rule published November 2, 1999. 3 Section 1848(c)(2)(B)(i) of theAct requires that CMS review and, if necessary, adjust RVUs at least once every five years.Beginning with the CY 2016 PFS final rule, CMS updates the MP RVUs annually based on theMedicare claims-based specialty mix for each service. CMS generally updates the malpracticeinsurance premium data every five years; these premiums are used to reflect the amount ofmalpractice insurance typically required to furnish medical services. Using more recent dataensures that the MP RVUs closely reflect malpractice insurance premium trends. CMS lastupdated the malpractice premium data used to construct MP RVUs in the CY 2015 PFS final rule(“CY 2015 Update”). Based on established precedent, the next MP RVU update will occur nolater than CY 2020.This report describes the results of analyzing the data and methods used to calculate MPRVUs and will inform CMS’ decisions regarding the next MP RVU update. This report willdiscuss refining the MP RVU methodology, constructing specialty risk factors with updated data,and assessing the impact of the updated risk factors on MP RVUs. Updating the malpracticepremium data used to construct the specialty risk factors will generate MP RVUs that arereflective of more recent malpractice premium trends. Moreover, the proposed methodologicalchanges to the MP RVU calculations ensure that the RVUs are calculated in an effective manner,consistent with the RBRVS method in which physician payment should reflect the relativeresource costs for providing a service.Section 2 provides a brief overview of the current MP RVU methodology and proposedchanges. Sections 3 and 4 discuss updating the data sources used to calculate specialty risk364 FR 59380Report on the CY 2018 Update of the MP RVUs for the Medicare PFS Acumen, LLC 11
factors. Section 5 concludes with the impacts that the updated data and methodology have onMP RVUs.Report on the CY 2018 Update of the MP RVUs for the Medicare PFS Acumen, LLC 12
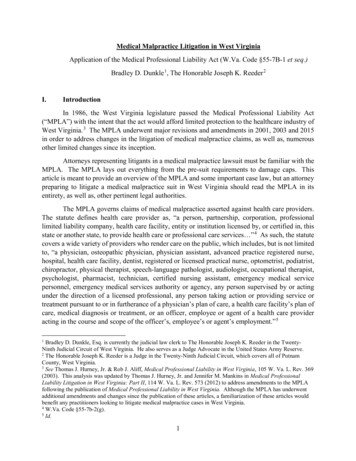
2 REFINING THE MP RVU METHODOLOGYAs part of the PFS, MP RVUs reflect the relative cost of medical malpractice insurance topractitioners. This section provides an overview of how CMS uses MP RVUs within theMedicare PFS and proposes changes to the calculation process. Section 2.1 discusses how RVUsaffect Medicare payments. Section 2.2 presents the current methodology CMS uses to calculateMP RVUs. Section 2.3 discusses the results of Acumen’s analyses of the MP RVU methodologyand proposes changes.2.1How RVUs Affect Practitioner PaymentsUnder the PFS, Medicare pays for practitioner services based on a list of services andtheir payment rates. Every practitioner service corresponds to a specific procedure code withinthe Healthcare Common Procedure Coding System (HCPCS). For some services paid under thePFS, CMS allows different practitioners to bill for different components of the same service.The technical component (TC) of a procedure includes the cost of equipment, supplies,technician salaries, and malpractice insurance for the service (e.g., the cost of producing an xray). The professional component (PC) of a procedure includes the practitioner work, associatedoverhead, and malpractice insurance costs involved in the service (e.g., the cost of interpretingthe contents of an x-ray). For most of these services, PC and TC modifiers (MOD) are appendedto procedure codes when the professional and technical components are billed separately.Without these modifiers, the practitioner is billing for the complete service, referred to as the“global” code. Table 2.1 below summarizes the differences among PC, TC, and global HCPCScodes. Note that whereas the MOD variable for the technical component is “TC,” the modifiervalue for the professional component is “26.” For some other PC and TC services, there aredistinct codes that are used to report each component. For these codes, neither the “TC” or “26”modifier is applied.Table 2.1 Distinctions Among Professional Component, Technical Component, and GlobalCodesHCPCS t26Practitioner work, overhead,and malpractice insuranceTechnicalComponentTCEquipment, supplies, technicalsalaries, and malpracticeinsuranceGlobalNonePC and TC billed togetherReport on the CY 2018 Update of the MP RVUs for the Medicare PFS Acumen, LLC 13
CMS has relied on the RBRVS system to determine the fee for each procedure tocalculate payment rates for individual services. In the RBRVS system, payments for eachservice depend on the relative amounts of inputs required to perform the procedure. These inputsinclude the amount of practitioner work involved in furnishing a medical service, expensesrelated to maintaining a practice, and malpractice insurance costs. CMS estimates the quantity ofinputs involved in furnishing these services under the PFS using the work RVU, PE RVU, andMP RVU. Higher RVU levels indicate that the service involves a greater amount of relativeresources.CMS measures the regional variation of each of the three input categories using the costsof each of the three input categories by locality: work, PE, and MP. Geographic Practice CostIndices (GPCIs) are then used to increase the payment rates associated with an RVU in high costregions and decrease the payment rates associated with an RVU in low cost regions. Ascalculated, variations in GPCIs are budget neutral and do not affect aggregate payment levels;rather, they reallocate payment rates by locality to reflect regional variation in relative resourceinputs. For instance, a PE GPCI of 1.2 indicates that practice expenses in that area are 20percent above the national average, whereas a PE GPCI of 0.8 indicates that practice expenses inthat area are 20 percent below the national average. The three GPCIs are calculated for 112localities, defined alternatively by state boundaries (e.g., Wisconsin), metropolitan statisticalareas (MSAs) (e.g., Metropolitan St. Louis, MO), portions of an MSA (e.g., Manhattan), or restof-state areas that exclude metropolitan areas (e.g., Rest of Missouri).To translate the sum of the GPCI-adjusted RVUs into a PFS payment amount for amedical service, CMS applies a conversion factor. The methodology prior to CY 2015determined the conversion factor based on a statutory formula with annual updates. However,the Medicare Access and CHIP Reauthorization Act of 2015 repealed the statutory formulaupdate and specified annual adjustment factors for CYs 2015 onward. 4Equation (1) below demonstrates how the PW, PE, and MP RVUs combine with the threeGPCIs and the CF to establish a Medicare practitioner payment for any procedure code HCPCSin locality 𝑃𝑃𝐻𝐻𝐻𝐻𝐻𝐻𝐻𝐻𝐻𝐻 ,𝐿𝐿 ��𝑊𝑊𝑊,𝐿𝐿 ��𝑊 ,𝐻𝐻𝐻𝐻𝐻𝐻𝐻𝐻𝐻𝐻 ���𝐿 𝑅𝑅𝑅𝑅𝑅𝑅𝑃𝑃𝑃𝑃 ,𝐻𝐻𝐻𝐻𝐻𝐻𝐻𝐻𝐻𝐻 ���𝐿 𝑅𝑅𝑅𝑅𝑅𝑅𝑀𝑀𝑀𝑀 ,𝐻𝐻𝐻𝐻𝐻𝐻𝐻𝐻𝐻𝐻 𝐶𝐶𝐶𝐶4(1)80 FR 70885Report on the CY 2018 Update of the MP RVUs for the Medicare PFS Acumen, LLC 14
2.2Current Policy for Calculating MP RVUsThe current policy for calculating MP RVUs involves several data sources and four mainsteps. MP RVUs are primarily based on malpractice premiums and data sources from the CensusBureau and CMS that account for population, geographic cost variation, RVUs, and volume ofMedicare claims. Each data source is summarized in Table 2.2 below.Table 2.2 MP RVU Data OverviewDataset NameSourceObservation LevelData Source RoleMethodol ogyStepMalpracticePremiums (MPFile)StateDepartmentsof InsuranceCounty, Specialty,Surgery ClassDetermining specialty riskfactors1AmericanCommunitySurvey PopulationEstimates (ACSFile)U.S. CensusBureauCounty, PopulationWeighting malpracticepremiums1GeographicPractice CostIndex (GPCI File)CMSLocalityApplying geographicadjustm
Third, Acumen evaluated two options for interpreting malpractice premium data that impact the raw MP RVU calculations, which is the third step in the MP RVU calculation process. As noted in Section 2.2.3, the current methodology assumes that the malpractice premium data reflect global procedures, or the malpractice liability associated with both