Transcription
Nifty200Momentum 30IndexGain exposure to 30high momentum stocksacross large andmid-cap stocksSeptember 2020
IntroductionMomentum refers to the tendency of stock pricetrends to persist – stocks that have outperformedrecently are likely to continue to outperform, and viceversa. The momentum factor’s ability to generateexcess returns in equity markets has earned it the title‘the premier anomaly’1, according to Eugene Fama,the father of the Efficient Market Hypothesis. There isno universal explanation for why the momentumfactor works. Some potential explanations are thatinvestors tend to initially underreact to news affectingstock prices. Thus, news is reflected in stock pricesgradually, instead of instantly. For example, pricestend to increase for weeks or months after a positiveearnings surprise as more investors revise theirexpectations upward. ‘Herding’ then begins to takeplace as other investors observe the strongperformance and increase their exposure, leading tofurther price increases. Likewise, in a downtrend,investors are often reluctant to realize losses on theirinvestments. Thus, stock may not fall instantly asmuch as it should on bad news. In both cases, theslow assimilation of news across the market, or lossaversion, can lead to delays in adjustment of the stockprice to all available news and thus create a prolongedupward / downward trend in stock prices.Momentum remains a simple to understand andpopular factor globally as well. Moreover, the conceptof momentum extends beyond the stock market. Ithas been documented across asset classes,geographies and over long periods of time2 inacademic literature. In the US, Momentum ETFs haveapproximately 14bn in Assets Under Management(AUM) as of June 2020 (Source: etfdb.com). However,this amount does not reflect AUM of multifactor ETFs,in which momentum is one of the factors.About the Nifty 200 Momentum 30 IndexNSE Indices has developed the ‘Nifty200 Momentum 30 Index’ which aims to track the performance of the top30 companies within the Nifty 200 Index selected based on their normalised momentum score. Thenormalised momentum score for each company is determined based on its 6-month and 12-month pricereturn, adjusted for its daily price volatility. Stock weights are based on a combination of the stock’s normalisedmomentum score and its free-float market capitalization.HighlightsThe index has a base date of April 01, 2005,with a base value of 1000The weight of each stock is based on the factortilt methodology – the weight is derived bymultiplying the free float market cap with thenormalised momentum score of that stockThe index tracks the performance of the stocksthat are part of the Nifty 200 Index, and havehigh normalised momentum scoresStock weights are capped at the lower of 5% or5 times the weight of the stock in the index basedonly on free float market capitalizationThe normalised momentum score is based on6-month and 12-month price return, adjustedfor its daily price return volatilityA buffer based on normalised momentum scoreranks is applied to reduce turnover1 Dissecting Anomalies (2008), Eugene F. Fama and Kenneth R. French2 A Century of Evidence on Trend-Following Investing (2012), Brian Hurst, Yao Hua Ooi and Lasse H. Pedersen, Ph.D02
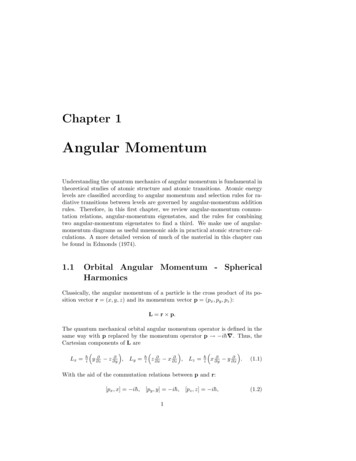
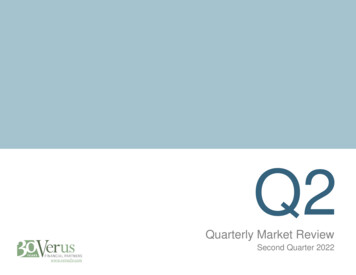
The Nifty200 Momentum 30 Index has significantly outperformed itsparent index over the long term and recent short-term horizonExhibit 1: Nifty200 Momentum 30 Index and Nifty 200 Index 02005 2006 2007 2008 2009 2010 2011 2012 2013 2014 2015 2016 2017 2018 2019 2020Source: NSE Indices. Data as of August 31, 2020Nifty 200 Momentum 30Nifty 200Exhibit 2: Nifty200 Momentum 30 Index and Nifty 200 Index performance tableCAGR returnsPeriodAnnualised VolatilityReturn-risk ratioNifty200Momentum 30Nifty200Nifty200Momentum 30Nifty200Nifty200Momentum 30Nifty200Since Inception18.6%12.7%23.4%22.3%0.800.5715 years18.0%11.9%23.6%22.5%0.760.5310 years16.3%8.9%18.0%17.3%0.900.517 years20.5%13.2%18.8%17.2%1.090.775 years13.4%8.4%19.1%17.8%0.700.473 years7.2%4.3%20.6%20.2%0.350.211 years14.5%4.5%29.3%30.0%0.490.156 months2.3%2.1%38.1%39.3%0.060.053 months14.6%19.0%14.9%15.5%0.981.23Source: NSE Indices. Data as of August 31, 2020. Inception date: April 01, 2005. Returns based on TRI valuesThe Nifty200 Momentum 30 Index has outperformedthe Nifty 200 Index since inception, with an 18.6%CAGR return against 12.7% return for the Nifty 200Index. In the last 3 years, the Nifty200 Momentum 30Index has returned 7.2% CAGR compared to 4.3%CAGR for the Nifty 200 Index.The Nifty200 Momentum 30 Index has been slightlyless volatile than the Nifty 200 Index over recentshort-term horizons, but somewhat more volatile overlong-term horizons. It has been marginally lessvolatile than its parent index during the recent 6months, with annualized volatility of 38.1% against03
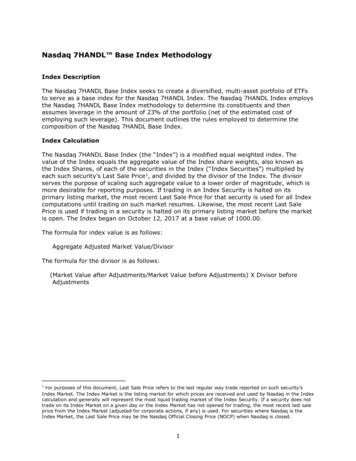
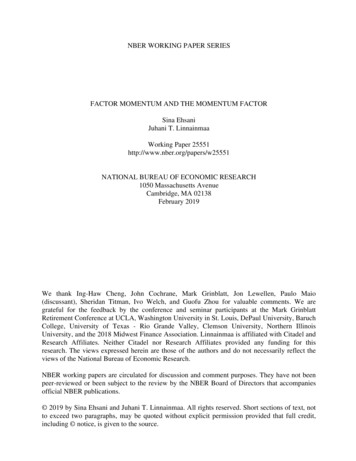
39.3% for the Nifty 200 Index. Since inception, theNifty200 Momentum 30 Index has had annualizedvolatility of 23.4% vs. 22.3% for its parent index.However, the Nifty200 Momentum 30 Index hasmaintained higher return-risk ratios on apoint-to-point basis even over periods where itsvolatility has exceeded that of the Nifty 200 Index. Forexample, it has a return-risk ratio of 0.80 sinceinception vs 0.57 for the Nifty 200 Index.Nifty200 Momentum 30 Index has consistently outperformed theNifty 200 Index on a daily rolling return basis over long and short horizonsExhibit 3: Instances of outperformance of Nifty200 Momentum 30 Index vs Nifty 200 Index on dailyrolling return basisPercentage of total instances of Outperformance and Underperformance vs Nifty 200 Indexon daily rolling return basisNifty200 Momentum 30 IndexInvestmentHorizonInstances of Outperformance vs Nifty 200 IndexExcess Return 0% CAGRExcess Return 0% CAGRExcess Return 4% CAGR)Excess Return(2-4% CAGR)Excess Return(0-2% CAGR)10 years100.0%0.0%100.0%0.0%0.0%7 years100.0%0.0%79.1%19.8%1.1%5 years98.3%1.7%65.5%21.6%11.1%3 years85.5%14.5%74.3%2.1%9.2%2 years83.4%16.6%73.4%7.6%2.3%1 year78.7%21.3%65.4%6.2%7.1%Source: NSE Indices. Instances of outperformance or underperformance calculated using daily rolling returns. Data as August 31, 2020Historically, for 5 year investment horizon, based ondaily rolling returns, the Nifty200 Momentum 30Index has outperformed the Nifty200 Index 98.3% ofthe time. The frequency of outperformance rises to100% when we consider longer time horizon of 7years and 10 years. This outperformance is alsoobserved over shorter periods. For example, for 1 yearinvestment horizon, based on daily rolling returnanalysis, the Index has outperformed the Nifty 200Index 78.7% of the time.From the table above, we observe that for the 5 yearinvestment horizon, based on daily rolling returnanalysis, the outperformance of the Nifty200Momentum 30 Index exceeds 4% per annum over theNifty 200 Index for 65.4%of the instances,04
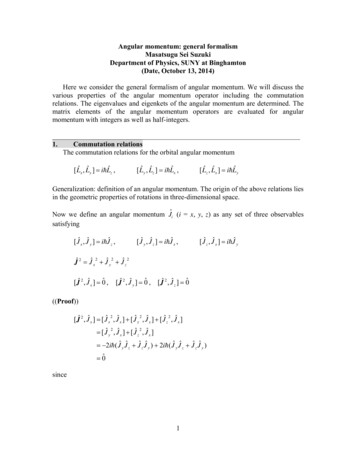
outperformance was in the range of 2-4% per annumfor 21.6% of theinstances and outperformance wasinthe range of 0-2% per annum for 11.1% of theinstances, leading to cumulative 98.3% instances ofoutperformance over the Nifty 200 Index.Nifty200 Momentum 30 Index has outperformed the Nifty 200 Index inCY 2020 till August 31, 2020, and over longer time horizons as wellOver a long horizon, the Nifty200 Momentum 30Index has shown strong consistency in itsoutperformance over the Nifty 200 Index. It hasoutperformed in 13 out of the last 16 calendar years.Thus, since the Global Financial Crisis of 2008-09, theNifty200 Momentum 30 Index has been able tooutperform its parent index during both bull and bearmarket phases. The Nifty200 Momentum 30 Indexhas outperformed the Nifty 200 Index during CY 2020till August 31, 2020 (2.3% vs -5.1% for the Nifty 200Index). The relatively higher weight in the defensiveConsumer Goods sector (27.3%) as of December2019 helped cushion the impact of the H1 2020pandemic related sell-off across rest of the portfolio.Exhibit 4: Performance of Nifty200 Momentum 30 Index and Nifty 200 Index by calendar150.0%100.0%50.0%0.0%-50.0%-100%2005 2006 2007 2008 2009 2010 2011 2012 2013 2014 2015 2016 2017 2018 2019 2020Nifty 200 Momentum 30Nifty 200Source: NSE Indices. Data as of August 31, 202005
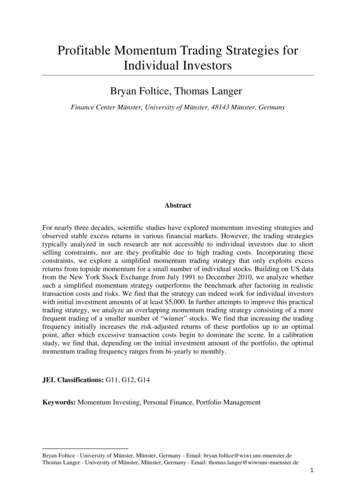
The Nifty200 Momentum 30 Index is currently overweight the ConsumerGoods and Pharma sectors and underweight the Financial Services sectorThe sector distribution and the difference in sector weights between the 2 indices is shown below.Exhibit 5: Comparison of sector exposure of the Nifty200 Momentum 30 Index and theNifty 200 Index (%)Nifty200 Momentum 30 Index36.132.58.84.3 3.32.83.42.2 1.03.31.7 10.42.30.20.8 1.00.4CONSUMER GOODSPHARMAOIL & GASTELECOMCHEMICALSAUTOMOBILECEMENTITFINANCIAL SERVICESINDUS. MANUF.POWERCONSTRUCTIONFERTILISERS & PESTICIDESHEALTHCARE SERVICESMEDIAMETALSERVICESTEXTILESSource: NSE Indices. Data as of August 31, 2020The Nifty200 Momentum 30 Index selects stockswhich have high normalised momentum scores,which in turn is based on their 6-month and 12-monthprice return, adjusted for daily price return volatility.During the first six months of 2020, several stocks inthe Consumer Goods and Pharma sectors witnessedhigh momentum, with their defensive nature enablingthem to perform relatively well during the pandemicrelated market volatility. Hence these two sectorscurrently have the highest sector weights in the06
Services sector relative to the Nifty 200 Index, as thissector has suffered due to the market sell-off in Q12020. As on August 31, 2020, the Financial Servicessector accounts for 2.2% weight in the Nifty200Momentum Index, compared to 32.2% in the Nifty200 Index.Nifty200 Momentum 30 Index. As on August 31,2020, the Consumer Goods sector has 36.1% weightand the Pharma sector has 32.5% weight in theNifty200 Momentum 30 Index as compared to 14.6%and 5.4% sector weights respectively in the Nifty 200Index. As on August 31, 2020, the Nifty200Momentum 30 Index is underweight in the FinancialExhibit 6: Change in Sector weights in Nifty200 Momentum 30 Index vis-à-vis Nifty 200 Index(%age points)40.030.0Higher weight in Nifty 200 Momentum 3020.010.00.0-10.0Lower weight in Nifty 200 Momentum tOunACoITnnaFielSacisceirvSource: NSE Indices. Data as of August 31, 2020As observed in the Exhibit above, the Nifty200Momentum 30 Index’s largest sector overweightsrelative to its parent Index are the Pharma andConsumer Goods sectors. Meanwhile FinancialService and IT are the two sectors it is mostunderweight relative to the Nifty 200 Index.The Nifty200 Momentum 30 Index adapts to changing market conditionsand increases the weight to current outperforming sectorsThe Momentum factor’s basic premise is that stocksthat have outperformed recently may continue tooutperform, and vice versa. Thus, the Nifty200Momentum 30 Index aims to overweightoutperforming stocks/sectors relative to its parentIndex and adapts itself as the market outperformerschange. The Exhibit below shows the sector weightsfor the Nifty200 Momentum 30 Index as on August31, 2020 and as on December 31, 2019. FinancialServices and Consumer Goods were the two largestsectors of the Nifty200 Momentum 30 Index as ofDecember 2019, compared with Consumer Goodsand Pharma as on August 31, 2020. The FinancialServices sector had outperformed the broader marketthrough 2019 – the Nifty Financial Services Indexreturned 24.4% vs 8.3% for the Nifty 200 in CY 2019.07
Momentum 30 Index has adapted itself, and currentlythe Pharma sector’s weight in the Index has increasedto 32.5% as of August 31, 2020, from 7.9% as ofDecember 31, 2019.Hence the Financial Services had a higher weight inthe Nifty200 Momentum 30 Index as of December2019. However, H1 2020 saw a change in marketleadership, with Financial Services underperformingand Pharma outperforming. Now the Nifty200Exhibit 7: Sector weight of the Nifty200 Momentum 30 Index on August 31, 2020 andDecember 31, 2019Nifty200 Momentum 30 (Aug’ 20)36.132.58.84.33.42.83.32.2 1.03.31.70.6Nifty200 Momentum 30 (Dec’ 19)27.37.913.85.14.735.94.0 0.80.6CONSUMER GOODSPHARMAOIL & GASTELECOMFINANCIAL ONIND. MANUF.Source: NSE Indices. Data as of August 31, 2020 and December 31, 2019Further examples of how the sector weights of theNifty200 Momentum 30 Index have varied throughtime are given below. Each column chart representsthe portfolio of the Index as on December 31 of therelevant calendar year.08
Exhibit 8: Sector weight of the Nifty200 Momentum 30 Index on December 31 for previous 5calendar 11.18.81.3 CHEMICALSCONSTRUCTIONCONSUMER GOODSFERTILISERSFINANCIAL SERVICESHEALTHCARE SERVICESINDUSTRIAL MANUF.ITMETALSOIL & GASPAPERPHARMAPOWERTELECOMTEXTILESSource: NSE IndicesIn the exhibit above, we can see how the sectorweights have changed through time. For example, onDecember 31, 2017, the Automobile sector had17.1% weight, but this reduced to zero as of end CY2018 and CY 2019. Additionally, the Index has alwayshad some exposure to the Consumer Goods andFinancial Services sectors over the last 5 years,though the weights have varied significantly throughthe periods. For example, as of end CY 2016,Consumer Goods had 8.2% weight and one year laterthe weight increased to 31.5%. The idea is thatNifty200 Momentum 30 Index seeks to capture thosesectors that exhibit higher momentum.09
Signing offThe Nifty200 Momentum 30 Indextracks the performance of stocks thatare part of the Nifty 200 Index, andhave high normalised momentumscoresThe normalised momentum scoreis based on 6-month and 12-monthprice return, adjusted for its dailyprice return volatilityThe Index adapts to changing marketconditions and increases the weightto current outperforming sectors –it is currently overweight ConsumerGoods and Pharma sectorsReturns outperformance is consistent it has outperformed its parent Nifty 200 Index13 out of the last 16 calendar years, 98.3%times on a rolling return basis for 5 yearinvestment horizons and also outperformedthe Nifty 200 during the pandemic inCY 2020 till August 31, 2020The Nifty200 Momentum 30 Index is expected toserve as a reference index, which can be tracked bypassive funds in the form of Exchange Traded Funds(ETFs), index funds and structured products.For more information on the Index methodology and factsheet, please visit us at www.nseindia.com10
About NSE Indices LimitedNSE Indices Limited (formerly known as India Index Services & Products Ltd. - IISL), a subsidiary of NSE,provides a variety of indices and index related services for the capital markets. The company focuses on theindex as a core product. The company owns and manages a portfolio of indices under the NIFTY brand of NSE,including the flagship index, the NIFTY 50. NIFTY equity indices comprises of broad-based benchmark indices,sectoral indices, strategy indices, thematic indices and customised indices. NSE Indices Limited also maintainsfixed income indices based on Government of India securities, corporate bonds, money market instrumentsand hybrid indices. Many investment products based on NIFTY indices have been developed within India andabroad. These include index based derivatives traded on NSE, NSE IFSC and Singapore Exchange Ltd. (SGX)and a number of index funds and exchange traded funds. The flagship 'NIFTY 50' index is widely tracked andtraded as the benchmark for Indian Capital Markets.For more information, please visit: www.niftyindices.comContact detailsAnalytical contactAman Singhania, CFA, FRMVice President and Head – Products (NSE- Indices) 91-22-26598214asinghania@nse.co.inBusiness Development contactRohit Kumar, FRMVice President & Head of Sales –Index & Market Data 91-22- 26598386rohitk@nse.co.inDisclaimer: All information contained herewith is provided for reference purpose only. NSE IndicesLimited (formerly known as India Index Services & Products Limited-IISL) ensures accuracy andreliability of the above information to the best of its endeavors. However, NSE makes no warranty orrepresentation as to the accuracy, completeness or reliability of any of the information contained hereinand disclaim any and all liability whatsoever to any person for any damage or loss of any nature arisingfrom or as a result of reliance on any of the information provided herein. The information contained inthis document is not intended to provide any professional advice.Contact:Email: indices@nse.co.inTel: 91 22 26598386Address: Exchange Plaza, Bandra Kurla Complex,Bandra (East), Mumbai– 400 051(India)11
normalised momentum score for each company is determined based on its 6-month and 12-month price return, adjusted for its daily price volatility. Stock weights are based on a combination of the stock's normalised momentum score and its free-float market capitalization. Introduction About the Nifty 200 Momentum 30 Index