Transcription
EXstream: Explaining Anomalies in Event StreamMonitoringHaopeng Zhang, Yanlei Diao, Alexandra MeliouCollege of Information and Computer Sciences, University of Massachusetts Amherst{haopeng, yanlei, ameli}@cs.umass.eduABSTRACTWe present two motivating applications as follows.In this paper, we present the EXstream system that provides high-quality explanations for anomalous behaviors thatusers annotate on CEP-based monitoring results. Giventhe new requirements for explanations, namely, conciseness,consistency with human interpretation, and prediction power,most existing techniques cannot produce explanations thatsatisfy all three of them. The key technical contributions ofthis work include a formal definition of optimally explaininganomalies in CEP monitoring, and three key techniques forgenerating sufficient feature space, characterizing the contribution of each feature to the explanation, and selecting asmall subset of features as the optimal explanation, respectively. Evaluation using two real-world use cases shows thatEXstream can outperform existing techniques significantlyin conciseness and consistency while achieving comparablehigh prediction power and retaining a highly efficient implementation of a data stream system.1.1 Motivating Applications1.Production Cluster Monitoring. Cluster monitoringis crucial to many enterprise businesses. For a concrete example, consider a production Hadoop cluster that executesa mix of Extract-Transform-Load (ETL) workloads, SQLqueries, and data stream tasks. The programming modelof Hadoop is MapReduce, where a MapReduce job is composed of a map function that performs data transformationand filtering, and a reduce function that performs aggregation or more complex analytics for all the data sharingthe same key. During job execution, the map tasks (calledmappers) read raw data and generate intermediate results,and the reduce tasks (reducers) read the output of mappersand generate final output. Many of the Hadoop jobs havedeadlines because any delay in these jobs will affect the entire daily operations of the enterprise business. As a result,monitoring of the progress of these Hadoop jobs has becomea crucial component of the business operations.However, the Hadoop system does not provide sufficientmonitoring functionality by itself. CEP technology has beenshown to be efficient and effective for monitoring a varietyof measures [26]. By utilizing the event logs generated byHadoop and system metrics collected by Ganglia[12], CEPqueries can be used to monitor Hadoop job progress; to findtasks that cause cluster imbalance; to find data pull stragglers; and to compute the statistics of lifetime of mappersand reducers. Consider a concrete example below, wherethe CEP query monitors the size of intermediate results thathave been queued between mappers and reducers.INTRODUCTIONComplex Event Processing (CEP) extracts useful information from large-volume event streams in real-time. Usersdefine interesting patterns in a CEP query language (e.g,.[3, 4]). With expressive query languages and high performance processing power, CEP technology is now at the coreof real-time monitoring in a variety of areas, including theInternet of Things [16], financial market analysis [16], andcluster monitoring [26].However, today’s CEP technology supports only passivemonitoring by requesting the monitoring application (or user)to explicitly define patterns of interest. There is a recent realization that many real-world applications demand a newservice beyond passive monitoring, that is, the ability of themonitoring system to identify interesting patterns (including anomalous behaviors), produce a concrete explanationfrom the raw data, and based on the explanation enable auser action to prevent or remedy the effect of an anomaly.We broadly refer to this new service as proactive monitoring.Example 1.1 (Data Queuing Monitoring). Collect all theevents capturing intermediate data generation/consumptionfor each Hadoop job. Return the accumulative intermediatedata size calculated from those events (Q1).Figure 1(a) shows the data queuing size of a monitoredHadoop job. The X-axis stands for the time elapsed sincethe beginning of the job, while the Y-axis represents the sizeof queued data. In this case, the job progress turns out tobe normal: the intermediate results output by the mappersstart to queue at the beginning and reach a peak after ashort period of time. This is because a number of mappershave completed in this period while the reducers have notbeen scheduled to consume the map output. Afterwards,the queued data size decreases and then stabilizes for a longperiod of time, meaning that the mappers and reducers areproducing and consuming data at constant rates, until thequeued data reduces to zero at the end of the job.c 2017, Copyright is with the authors. Published in Proc. 20th International Conference on Extending Database Technology (EDBT), March21-24, 2017 - Venice, Italy: ISBN 978-3-89318-073-8, on OpenProceedings.org. Distribution of this paper is permitted under the terms of the Creative Commons license CC-by-nc-nd 4.0Series ISSN: 2367-200515610.5441/002/edbt.2017.15
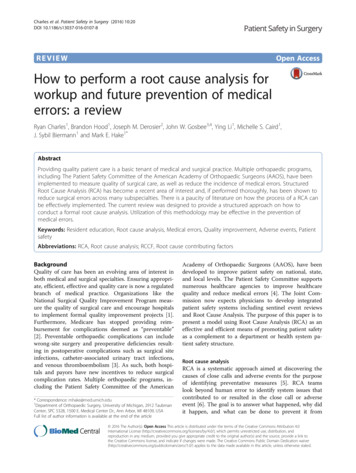
A CEP-based Monitoring SystemDataResultsCEPData sourceVisualizationAn Explanation EngineExplanationArchive(a) Data queuing size of a normal(b) Data queuing size of an abnor-Hadoop jobmal Hadoop jobAnnotationExplanation(c) Architecture of EXstreamFigure 1: Hadoop cluster monitoring: examples and system architecture.Suppose that a Hadoop user sees a different progress plot,as shown Figure 1(b), for the same job on another day: thereis a long initial period where the data queuing size increasesgradually but continually, and this phase causes the job completion time to be delayed by more than 500 seconds. Whenthe user sees the job with an odd shape in Figure 1(b), hemay start considering the following questions:tured during that period can have quality issues. When suchanomalies arise, it is a huge amount of work to investigatethe claims from customers given the complexity of manufacturing process and to analyze a large set of historical datato find explanations that are meaningful and actionable.I What is happening with the submitted job?I Should I wait for the job to complete or re-submit it?I Is the phenomenon caused by the bugs in the code orsome system anomalies?I What should I do to bring the job progress back tonormal?The overall goal of EXstream is to provide good explanations for anomalous behaviors that users annotate on CEPmonitoring results. We assume that an enterprise information system has CEP monitoring functionality: a CEP monitoring system offers a dashboard to illustrate high-level metrics computed by a CEP query, such as job progress, networktraffic, and data queuing. When a user observes an abnormal value in the monitoring results, he annotates the valuein the dashboard and requests EXstream to search for anexplanation from the archived raw data streams. EXstreamgenerates an optimal explanation(formalized in Section 2.2)by quickly replaying a fraction of the archived data streams.Then the explanation can be encoded into the system forproactive monitoring for similar anomalies in the future.Challenges. The challenges in the design of XStreamarise from the requirements for such explanations. Informedby the two real-world applications mentioned above, we consider three requirements in this work: (a) Conciseness: Thesystem should favor smaller explanations, which are easierfor humans to understand. (b) Consistency: The systemshould produce explanations that are consistent with human interpretation. In practice, this means that explanations should match the true reasons for an anomaly (groundtruth). (c) Prediction power : We prefer explanations thathave predictive value for future anomalies.It is difficult for existing techniques to meet all three requirements. In particular, prediction techniques such aslogistic regression and decision trees [2] suffer severely inconciseness or consistency as shown in our evaluation results. This is because these techniques were designed forprediction, but not for explanations with conciseness andconsistency requirements. Recent database research [25, 20]seeks to explain outliners in SQL query answers. This lineof work assumes that explanations can be found by searching through various subsets of the tuples that were used tocompute the query answers. This assumption does not suitreal-world stream systems for two reasons: As shown for ourexample, Q1, the explanation of memory usage contentionamong different jobs cannot be generated from only thoseevents that produced the monitoring results of Q1. Furthermore, the stream execution model does not allow us to1.2 Problem Statement and ContributionsToday’s CEP technology, unfortunately, does not provideany additional information that helps answer the above questions. The best practice is manual exploration by the Hadoopuser: he can dig into the complex Hadoop logs and manuallycorrelate the Hadoop events with the system metrics such asCPU and memory usage returned by a cluster monitoringtool like Ganglia [12]. If he is lucky to get help from thecluster administrator, he may collect additional informationsuch as the number of jobs executed concurrently with hisjob and the resources consumed by those jobs.For our example query, the odd shape in Figure 1(b) isdue to high memory usage of other programs in the Hadoopcluster. However, this fact is not obvious from the visualization of the user’s monitoring query, Q1. It requires analyzingadditional data beyond what is used to compute Q1 (whichused data relevant only to the user’s Hadoop job, but notall the jobs in the system). Furthermore, the discovery ofthe fact requires new tools that can automatically generateexplanations for the anomalies in monitoring results suchthat these explanations can be understood by the humanand lead to corrective / preventive actions in the future.Supply Chain Management. The second use case isderived from an aerospace company with a global supplychain. By talking with the experts in supply chain management, we identified an initial set of issues in the company’scomplex production process which may lead to imperfect orfaulty products. For instance, in the manufacturing process of a certain product the environmental features must tobe strictly controlled because they affect the quality of production. For example, the temperature and humidity needto be controlled in a certain range, and they are recordedby the sensors deployed in the environment. However, ifsome sensors stop working, the environmental features maynot be controlled properly and hence the products manufac-157
Event ording a Hadoop job startsRecording a Hadoop job finishesRecording the activities of generation(positive values) / consumption (negative values) of intermediate dataRecording the CPU usage for a nodein the clusterRecording the memory usage for anode in the umber,eventType, eventId, jobId, clusterNodeNumber)eventType, eventId, jobId, clusterNodeNumber)eventType, eventId, jobId, taskId, attemptId, clusterNdataSize)(timestamp, eventType, eventId, clusterNodeNumber, CPUUsage)(timestamp, eventType, eventId, clusterNodeNumber, memUsage)Figure 2: Example event types in Hadoop cluster monitoring. Event types can be specific to the Hadoop job (e.g.,JobStart, DataIO, JobEnd), or they may report system metrics (e.g., CPUUsage, FreeMemory).QPattern seq(Component1 , Component2 , . . . )Where [partitionAttribute] P red1 P red2 . . .Return (timestamp, partitionAttribute, derivedA1 ,derivedA2 , . . .)[]Q1Pattern seq(JobStart a, DataIO b[], JobEnd c)Where [jobId]Return (b[i].timestamp, a.jobId,sum(b[1· · · i].dataSize))[]Figure 3: Syntax of a query in SASE (on the left), and an example query for monitoring data activity (on the right).repeat query execution over different subsets of events orperform any precomputation in a given database [20].Contributions. In this work, we take an important steptowards discovering high-quality explanations for anomaliesobserved in monitoring results. Toward this goal, we makethe following contributions:slightly, delaying events processing by 0.4 second on average.2. EXPLAINING CEP ANOMALIESThe goal of EXstream is to provide good explanationsfor anomalous behaviors that users annotate on CEP-basedmonitoring results. We first describe the system setup, andgive examples of monitoring queries and anomalous observations that a user may annotate. We then discuss the requirements for providing explanations for such anomalies,and examine whether some existing approaches can deriveexplanations that fit these requirements. Finally, we definethe problem of optimally explaining anomalies in our setting.1) Formalizing explanations (Section 2): We provide aformal definition of optimally explaining anomalies in CEPmonitoring as a problem that maximizes the informationreward provided by the explanation.2) Sufficient feature space (Section 3): A key insightin our work is that discovering explanations first requires asufficient feature space that includes all necessary featuresfor explaining observed anomalies. EXstream includes a newmodule that automatically transforms raw data streams intoa richer feature space, F, to enable explanations.2.1CEP Monitoring System and QueriesIn this section, we describe the system setup for our problem setting. The overall architecture of EXstream is shownin Figure 1(c). Within the top dashed rectangle in Figure 1(c) is a CEP-based monitoring system. We consider adata source S, generating events of n types, E {E1 , E2 , . . . , En }.Events of these types are received by the CEP-based monitoring system continuously. Each event type follows a schema,comprised of a set of attributes; all event schemas sharea common timestamp attribute. The timestamp attributerecords the occurrence time of each event. Figure 2 showssome example event types in the Hadoop cluster monitoringuse case [26].We consider a CEP engine that monitors these eventsusing user-defined queries. For the purposes of this paper, monitoring queries are defined in the SASE query language [3], but this is not a restriction of our framework, andour results extend to other CEP query languages. Figure 3shows the general syntax of CEP queries in SASE, and anexample query, Q1 , from the Hadoop cluster monitoring usecase. Q1 collects all data-relevant events during the lifetimeof a Hadoop job. We now explain the main components ofa SASE query.3) Entropy-based, single-feature reward (Section 4):As a basis for building the information reward of an explanation, we model the reward that each feature, f F, maycontribute using a new entropy-based distance function.4) Optimal explanations via submodular optimization (Section 5): We next model the problem of finding anoptimal explanation from the feature space, F, as a submodular maximization problem. Since submodular optimizationis NP-hard, we design a heuristic algorithm that ranks andfilters features efficiently and effectively.5) Evaluation (Section 6): We have implemented EXstreamon top of the SASE stream engine [3, 26]. Experiments using two real-world use cases show promising results: (1) Ourentropy distance function outperforms state-of-the-art distance functions on time series by reducing the features considered by 94.6%. (2) EXstream significantly outperformslogistic regression [2], decision tree [2], majority voting [15]and data fusion [19] in consistency and conciseness of explanations while achieving comparable, high predication accuracy. Specifically, it outperforms others by improving consistency from 10.7% to 87.5% on average, and reduces 90.5%of features on average to ensure conciseness. (3) Our implementation is also efficient: with 2000 concurrent monitoringqueries, the triggered explanation analysis returns explanations within half a minute and affects the performance onlySequence. A query Q may specify a sequence using theSEQ operator, which requires components in the sequenceto occur in the specified order. One component is either asingle event or the Kleene closure of events. For example,Q1 specifies three components: the first component is a sin-158
gle event of the type JobStart; the second component is aKleene closure of a set of events of the type DataIO; andthe third component is a single event of type JobEnd.Predicates. Q can also specify a set of predicates in itsWhere clause. One special predicate among these is thebracketed partitionAttribute. The brackets apply an equivalence test on the attribute inside, which requires all selected events to have the same value for this attribute. ThepartitionAttribute tells the CEP engine which attribute topartition by. In Q1 , jobId is the partition attribute.Return matches. Q specifies the matches to return inthe Return clause. Matches comprise a series of events withraw or derived attributes; we assume timestamp and thepartitionAttribute are included in the returned events. Wedenote with m a match on one partition and with MQ theset of all matches. Q1 returns a series of events based onselected DataIO events, and the returned attributes includetimestamp, jobId, and a derived attribute— the total sizefor all selected DataIO events. In order to visualize resultsin real time, matches will be sent to the visualization moduleas events are collected.IAFigure 4: Abnormal (IA ) and reference (IR ) intervals.Visualizations and feedback. Our system visualizes matchesfrom monitoring queries on a dashboard that users can interact with. The visualizations typically display the (relative)occurrence time on the X-axis. The Y-axis represents one ofthe derived attributes in returned events. Users can specifysimple filters to focus on particular partitions. All returnedevents of MQ are stored in a relational table TMQ , and thedata to be visualized for a particular partition is specifiedas πt,attr i (σpartitionAttribute v (M )). Figure 1(a) shows thevisualization of a partition, which corresponds to a Hadoopjob for this query. In this visualization, the X-axis displaysthe time elapsed since the job started, and the Y-axis showsthe derived sum over the “DataSize” attribute.Users can interact with the visualizations by annotatinganomalies. For example, the visualization of Figure 1(b)demonstrates an unexpected behavior, with the queueingdata size growing slowly. A user can drag and draw rectangles on the visualization, to annotate the abnormal component, as well as reference intervals that demonstrate normal behavior. We show an example of these annotationsin Figure 4. A user may also annotate an entire periodas abnormal, and choose a reference interval in a differentpartition. The annotations will be sent to the explanationengine of EXstream, which is shown in the bottom dashedrectangle of Figure 1(c). The explanation engine will beintroduced in detail in following sections. We use IA todenote the annotated abnormal interval in a partition PA :IA (Q, [lower, upper], PA ). We use IR to denote the reference interval, which can be explicitly annotated by the user,or inferred by EXstream as the non-annotated parts of thepartition. We write IR (Q, [lower, upper], PR ), where PRand PA might be the same or different partitions.2.2IRthe abnormal behavior: (1) the free memory is lower thannormal, and (2) the free swap space is lower than normal.However, these reasons are not obvious from the visualization; rather, a Hadoop expert had to manually check a largevolume of logs to derive this explanation. Our goal is to automate this process, by designing a system that seamlesslyintegrates with CEP monitoring visualizations, and whichcan produce explanations for surprising observations.We define three desirable criteria for producing explanations in EXstream:1. Conciseness: The system should favor smaller, and thussimpler explanations. Conciseness follows the Occam’srazor principle, and produces explanations that are easierfor humans to understand.2. Consistency: The system should produce explanationsthat are consistent with human interpretation. In practice, this means that explanations should match the truereasons for an anomaly (ground truth).3. Prediction power: We prefer explanations that havepredictive value for future anomalies. Such explanationscan be used to perform proactive monitoring.Explanations through predictive models. The first stepof our study explored the viability of existing predictiontechniques for the task of producing explanations for CEPmonitoring anomalies. Prediction techniques typically learna model from training data; by using the anomaly and reference annotations as the training data, the produced modelcan be perceived as an explanation. For now, we will assumethat a sufficient set of features is provided for training (wediscuss how to construct the feature space in Section 3), andevaluate the explanations produced by two standard prediction techniques for the example of Figure 4.Logistic regression [2] produces models as weights over aset of features. The algorithm processes events from the twoannotated intervals as training data, and the trained prediction model — a classifier between abnormal and referenceclasses — can be considered an explanation to the anomaly.The resulting logistic regression model for this example isshown in Figure 5. While the model has good predictivepower, it is too complex, and cannot facilitate human understanding of the reported anomaly. The model assignsnon-zero weights to 30 out of 345 input features, and whilethe two ground truth explanations identified by the humanexpert are among these features (23 and 24), their weightsin this model are low. This model is too noisy to be of use,and it is not helpful as an explanation.Explaining AnomaliesMonitoring visualizations allow users to observe the evolution of various performance metrics in the system. While thevisualizations help indicate that something may be unusual(when an anomaly is observed), they do not offer clues thatpoint to the reasons for the unexpected behavior. In ourexample from Figure 4, there are two underlying reasons for159
85.-4.79E-07-3.28E-07.2.61E-10 4.7AbnormalMemFreeMean 4.5 1684942NormalAbnormal 1684942NormalFigure 6: Model Generated by Decision TreeDecision tree [2] builds a tree for prediction. Each non-leafnode of the tree is a predicate while leaf nodes are prediction decisions. Figure 6 shows the resulting tree for ourexample. The decision tree algorithm selects three featuresfor the non-leaf nodes, and only one of them is part of theground truth determined by our expert. The other two features happen to be coincidentally correlated with the twointervals, as revealed in our profiling. This model is moreconcise than the result of logistic regression, but it is notconsistent with the ground truth.The above analyses showed that prediction techniques arenot suitable for producing explanations in our setting. Whilethe produced models have good predictive power (as thisis what the techniques are designed for), they make poorexplanations, as they suffer in consistency and conciseness.Our goal is to design a method for deriving explanationsthat satisfies all three criteria (Figure 7).2.3Logistic regressionDecision odGoodnon-trivial components. First, we need to identify importantfeatures for the annotated intervals (e.g., M emF reeM ean,SwapF reeM ean); these features will be the basis of forming meaningful predicates for the explanations. Second, wehave to derive the best explanation given a metric of optimality. For example, the explanation (M emF reeM ean 1978482) is worse than (M emF reeM ean 1978482 SwapF reeM ean 361462), because, while it is smaller, itdoes not cover all issues that contribute to the anomaly, andis thus less consistent with the ground truth.Ultimately, explanations need to balance two somewhatconflicting goals: simplicity, which pushes explanations tosmaller sizes, and informativeness, which pushes explanations to larger sizes to increase the information content. Wemodel these goals through a reward function that modelsthe information that an explanation carries, and we definethe problem of deriving optimal explanations as the problemof maximizing this reward function.MapFinishNodeNumberMean 4.5Consistencythree criteria for explanations.annotated anomaly of Figure 4.PullFinishNodeNumberMeanConcisenessFigure 7: Performance of prediction methods on ourFigure 5: Model generated by logistic regression for the 4.7AlgorithmDefinition 2.2 (Optimal Explanation). Given an archive ofdata streams D for CEP, a user-annotated abnormal interval IA and a user-annotated reference interval IR , an optimalexplanation e is one that maximizes a non-monotone, submodular information reward R over the annotated intervals:argmaxe RIA ,IR (e)The reward function in Definition 2.2 is governed by animportant property: rewards are not additive, but submodular. This means that the sum of the reward of two explanations is greater than or equal to the reward of their union:RIA ,IR (e1 ) RIA ,IR (e2 ) RIA ,IR (e1 e2 ). The intuitionfor the submodularity property is based on the observationthat adding predicates to a conjunctive explanation offersdiminishing returns: the more features an explanation already has, the lower the reward of adding a new predicatetends to be. Moreover, R is non-monotone. This meansthat adding predicates to an explanation could decrease thereward. This is due to the conciseness requirement thatpenalizes big explanations. The optimal explanation problem (Definition 2.2) is therefore a submodular maximizationproblem, which is known to be NP-hard [11].Formalizing ExplanationsExplanations need to be understandable to human users,and thus need to have a simple format. EXstream buildsexplanations as a conjunction of predicates. In their generalformat, explanations are defined as follows.Definition 2.1 (Explanation). An explanation is a booleanexpression in Conjunctive Normal Form (CNF). It containsa conjunction of clauses, each clause is a disjunction of predicates, and each predicate is of the form {v o c}, where v is avariable value, c is a constant, and o is one of five operators:o { , , , , }.2.4Existing Approximation MethodsSubmodular optimization problems are commonly addressedwith greedy approximation techniques. We next investigatethe viability of these methods for our problem setting.For this analysis, we assume a reward function for explanations based on mutual information. Mutual information is a measure of mutual dependence between features.This is important in our problem setting, as features areoften correlated. For example, P ullStartF requency andP ullF inishF requency are highly correlated, because theyalways appear together for every pull operation. For thisprecise reason, Definition 2.2 demands a submodular rewardfunction. Mutual information satisfies the submodularityproperty. Greedy algorithms are often used in mutual infor-Example 2.1. The formal form of the true explanations forthe anomaly annotated in Figure 4 is (M emF reeM ean 1978482 SwapF reeM ean 361462), which is a conjunction of two predicates. It means that the average availablememory is less than 1.9GB and free swap space is less than360MB. The two predicates indicate that the memory usageis high in the system (due to resource contention), thus thejob runs slower than normal.Arriving at the explanation of Example 2.1 requires two160
igure 9: Sample events in the type of CP U U sage.Figure 8: Accumulative mutual information gain undersubmodular optimization is NP-hard, our goal is to designa heuristic to solve this problem. Our heuristic algorithmfirst uses the entropy-based, single-feature reward to rankfeatures, subsequently identifies a cut-off to reject featureswith low reward, and finally uses correlation-based filteringto eliminate features with information overlap (emulatingthe submodularity property). Our evaluation shows thatour heuristic method is extremely effective in practice.greedy and random strategies.mation maximization problems. The way they would workin this setting is the following: given an explanation e, whichis initially empty, at each greedy step, we select the featuref that maximizes the mutual information of e f .Figure 8 shows the performance of the greedy algorithmfor maximization of mutual information, with a strawmanalternative. The random algorithm selects a random featureat each step. The greedy strategy clearly outperforms the alternative by reaching higher mutual information gains withfewer features, but it still selects a large number of features(around 20-30 features before it levels off). This means thatthis method produces explanations that are too large, andunlikely to be useful for human understanding.2.53.DISCOVERING USEFUL FEATURESExplanations comprise of predicates on measurable properties of the CEP system. We call such properties features.Some features for our running example are DiskF reeM ean,M emF reeM ean, DataIOF requency, etc. In most existingwork on explanations, features are typically determined bythe query or the schema of the data (e.g., the query predicates in Scorpion [25]). In CEP monitoring, using as featuresthe query predicates or data attributes is not sufficient, because many factors that impact the observed performanceare due to other events and changes in the system. Thisposes an additional challenge in our problem setting, as theset of relevant features is non-trivial. In this section, we discuss how EXstream derives the space of featu
the fact requires new tools that can automatically generate . Syntax of a query in SASE (on the left), and an example query for monitoring data activity (on the right). repeat query execution over di erent subsets of events or perform any precomputation in a given database [20]. Contributions. In this work, we take an important step