Transcription
Exhibit 99.32nd Quarter Earnings Conference CallJuly 17, 2020
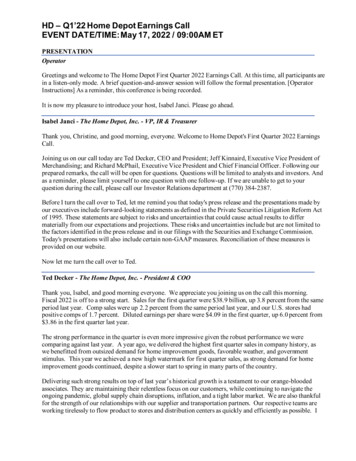
Responding to our communities,customers and associatesCommunities Committing 12M to advance programs and initiatives that promote racial equity andeconomic empowerment for communities of color Donating 5M toward COVID-19 relief and recovery efforts Donating previously purchased advertising time to food banks across our footprint Providing grants for several Community Development Financial Institutions andnonprofit organizations focused on helping small businesses in underserved areas toregain stabilityCustomers Supporting consumers with payment assistance and processing requests for paymentdeferrals for businesses Helping business customers access the Small Business Administration's PaycheckProtection Program Temporarily halting new foreclosures and repossessions, while also waiving certain feesAssociates Limiting branch activities to drive through services or in-office appointments; vastmajority have remained open during pandemic Providing additional compensation for certain branch and operationally essentialassociates as well as free COVID-19 testing and enhanced telehealth benefits for allassociates2
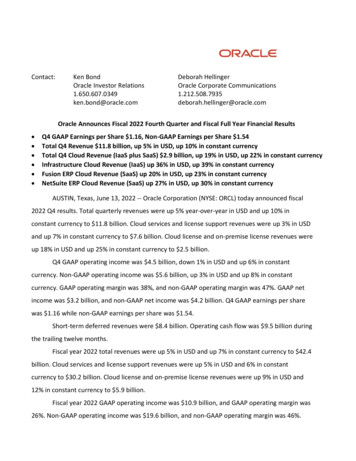
Second quarter 2020 overview( 237M)Net Loss Available toCommon Shareholders 1,544MAdjusted TotalRevenue(1) 898MAdjusted NonInterest Expense(1) 646MAdjusted Pre-Tax PreProvision Income(1) 700MProvision Expense inExcess of Net Charge-OffsGenerated highestadj. pre-tax preprovision income(1) inover a decade3(1) Non-GAAP, see appendix for reconciliation.
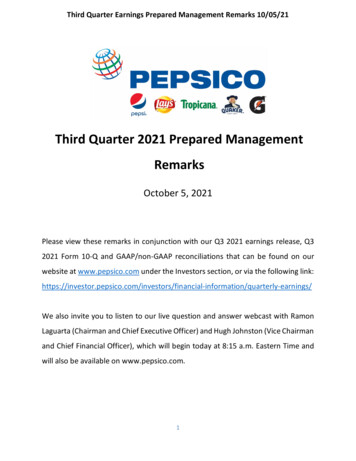
Supporting our customersSBA-PPP ResultsCustomer Loan Modifications(as of June 30, 2020)Approx # ofdeferralsBalances w/deferral ( inmillions)Deferral as %of total% makingpayment inlast 61 days(1)Mortgage (portfolio only)5,500 1,4229%34%Home 1%Indirect-Other Consumer5,500843%NA(3)Credit Card5,000272%56%Other Consumer4,000424%37%Total Consumer27,0001,9286%Total Business(4)14,0003,7636%Total41,000 5,6916%25% Began receiving PPPapplications April 3rd Through July 8th,funded 45,000loans totaling 5B Average loan size 106K 98% of funds tocompanies with 100 employees Supported over600,000 jobs(1) Represents period from 5/1/20 to 7/1/20 based on count. (2) Indirect vehicles deferral metrics include Dealer Financial Services andDirect auto only. (3) Limited information on payment in last 61 days for 3rd party portfolios serviced by others. (4) Business loan deferralmetrics include Ascentium Capital. Percentage making payment in last 61 days represents Corp Banking Segment, excluding Ascentium.4
Second quarter 2020 highlightsSummary of second quarter resultsQoQYoY2Q20 Change Change( amounts in millions, except pershare data)Net interest income9724.7%3.2%Provision for credit losses882136.5%858.7%Non-interest income57318.1%16.0%Non-interest expense92410.5%7.3% Income (loss) beforeincome taxesIncome tax expense(benefit)(261) (227.9)%(154.0)%(47) (211.9)%(150.5)%Net income (loss)(214) (232.1)%(154.9)%Preferred dividends23—%43.8%Net income (loss) availableto common shareholders (237) (270.5)%(163.4)%Diluted EPS (0.25) (278.6)%(167.6)%Selected items impacting the quarter2Q20(amounts in millions, except per share data)(1)Pre-tax adjusted items :Branch consolidation, property andequipment chargesProfessional and related fees associatedwith the purchase of Ascentium Capital (10)(8)Loss on early extinguishment of debt(6)Salaries and benefits related to severancecharges(2)Securities gains (losses), net1Total pre-tax adjusted items(1)(2)Diluted EPS impact(25) (0.02) (700)Pre-tax additional selected items(3):Provision in excess of net charge-offsCapital markets income - CVA/DVA34PPP loans net interest income16COVID-19 related expenses(19)MSR net hedge performance2(1) Non-GAAP, see appendix for reconciliation. (2) Based on income taxes at an approximate 25% incremental rate. (3) Items represent an outsizedor unusual impact to the quarter or quarterly trends, but are not considered non-GAAP adjustments.5
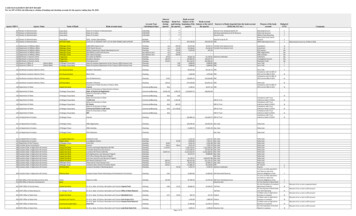
Average loansAdjusted average loans and leases(1)( in billions) 90.5 81.3 81.628.428.628.2QoQ highlights Adjusted average loans(1) increased 11% Drivers of growth include elevatedcommercial draw activity early in thequarter, acquisition of equipment financecompany Ascentium Capital, and PPP loans Remain focused on client selectivity and fullrelationships with appropriate risk-adjustedreturns53.153.062.1 Commercial line utilization levels normalizedending quarter at 44.6% Expect PPP loan forgiveness requests to beginin 3Q and continue into 4Q2Q191Q20Adjusted business loans(1)(1) Non-GAAP, see appendix for reconciliation.2Q20 Mortgage balances benefited recordproduction associated with historically lowmarket interest ratesAdjusted consumer loans(1)6
Average depositsAverage deposits by segment( in billions)QoQ highlights 110.90.48.4 95.7 95.01.38.11.67.936.426.626.265.759.759.3 Average deposits increased 16%; endingdeposits increased 17% Commercial customers maintainedexcess cash from line draws, PPP loans,and other government stimulus indeposit accounts Declining rates driving corporatecustomers to bring excess deposits backon balance sheet Consumer deposit growth driven bygovernment stimulus programs coupledwith lower overall spend2Q191Q202Q20Consumer BankCorporate BankWealth MgtOther(1) Deposits are expected to normalize insecond half of they year, exact timingremains uncertain(1) Other deposits represent non-customer balances primarily consisting of wholesale funding (for example, Eurodollar deposits, selected depositsand brokered time deposits).7
Net interest income and netinterest marginLiquidity Impacts in Near-termNII(1) and NIM( in millions) 956 9403.45%3.44% 9853.38%3.19%2Q191Q20NII(1)NIMNIM excl. PPP/CashElevated line-draws add 2% NII and -4 bps NIM PPP and cash account for -19 bps NIM degradation 7.4B early FHLB extinguishment and 650M bankdebt tender in the quarter directly reduce cashDrivers of Core PerformanceNo impact from short-term rate declines(2); protection from: NIM Attribution -4bps -5bps-7bps3.19%-19bpsComm. LowerOther PPP/CashLine Long-Term (Credit/Draws Rates(2) Loan Costs)Hedging program; 60M NII accrual in 2Q(3)Deposit pricing advantage; 27% beta, -21 bpsResidual exposure to long-term rates at low levels(2) 10bps1Q20 AscentiumAcquisition 2Q20 3.44%In 2Q, net interest income (NII) supported by elevatedbalance sheet from stimulus / liquidity in the system; netinterest margin (NIM) reducedFixed rate loan/securities production at lower ratesPremium amortization; from 26M 1Q to 33M 2QThe Ascentium acquisition, credit costs, and loan costaccretion also impacted the quarter3Q 2020 Expectations Core NII/NIM drivers(4) in 3Q are balance sheet deleveraging(normalization of line-draw), credit, and lower long-termrates; uncertain timing of PPP fee accel. to benefit NII/NIM NII expected -1.5% to -2.5% in 3Q; expect 95M from hedges Excluding PPP/cash, NIM expected in mid-to-high 3.30%s2Q20(1) Net interest income on a fully taxable equivalent basis. (2) 1m LIBOR -1.05% QoQ; 10yr US Treasury -0.69% QoQ. (3) Hedges remainactive; 1.9B unrealized, pre-tax gain, to be amortized into NII over the remaining life of hedges 5 years. (4) Assumes Fed Funds Targetremains 0%-0.25%, 1m LIBOR 0.15%-0.25%, and 10yr US Treasury is range-bound 0.50% - 0.90%.8
Non-interest incomeQoQ highlightsChange vs1Q202Q19( in millions)2Q20Service charges 131(26.4)%(27.6)%Card and ATM fees101(3.8)%(15.8)%Wealth management income79(6.0)%—%Capital markets income(excluding CVA/DVA)6141.9%32.6%Capital markets - CVA/DVA34NMNMMortgage income8220.6%164.5%Market Value adjustments(on employee benefit assets - other)16NMNMOther694.5%50.0%Total non-interest income 57318.1%16.0%Adjusted non-interestincome(1) 57218.4%11.5%(1) Non-GAAP; see appendix for reconciliation.NM - Not MeaningfulCVA/DVA - customer derivative credit and debit valuation adjustments Capital markets experienced a recordquarter driven by record debt & equityunderwriting fees and record feesgenerated from the placement ofpermanent financing for real estatecustomers; in current environment, expectrun rate of 40-50M per quarter, excl. CVA Mortgage increase driven by recordproduction volume associated with lowerrate environment; 2020 production on trackto exceed 2019 levels by 50% Remains a core business; strategicdecision to add mortgage bankerspaying off; expect mortgage toremain a strength for the remainderof 2020 Service charges and card & ATM feesimpacted by lower customer spend; whileimproved, if spend remains at June levelsexpect 10-15M per month negative impactfrom pre-March levels9
Non-interest expenseAdjusted non-interest expense(1)QoQ highlights( in millions) 21 15 898 (3) 41 Salaries and benefits increased 13%, drivenprimarily by liability impact associated withpositive market value adjustments onemployee benefit accounts 824Elevated production-based incentives,temporary COVID bonuses, the additionof 463 Ascentium associates and annualmerit also contributed to the increase Benefits from the Continuous Improvementprocess include reduced square footage,increased digital adoption, branchconsolidations, and reduced 3rd-party spend1Q20Chg. inmarket val.adj. onemployeebenefitaccountsChangein COVIDexpensesAscentiumexpensesOther(2)2Q20 Evaluating digital and technology spendpriorities to align with recent changes incustomer behavior Committed to adjusting the expense basecommensurate with the revenue environment 2Q20 adjusted efficiency ratio(1) improved 20bps to 57.7% QoQ(1) Non-GAAP; see appendix for reconciliation. (2) Other includes increased incentive-based compensation associated with recordmortgage and capital markets income, as well as merit increases offset by expense reductions associated with loan origination costdeferrals and lower payroll taxes.10
Asset qualityNet charge-offs and ratioCriticized business loans( in millions) 182( in millions)132 4,2250.80% 123 92630.59% 2,12437 2,5240.44%5560502Q191Q202Q20Consumer netcharge-offsBusiness servicesnet charge-offsNet charge-offsratioNPLs and ACL coverage ratio( in millions) 638 533 614395%169%1Q20NPLs - excluding LHFS(1) Non-GAAP; see appendix for reconciliation. Provision 882M ( 182M NCOs) resulting in ACL of 2.68%of total loans (2.82%(1) ex-PPP) 261%2Q192Q191Q202Q20 No substantial reserve builds anticipated for remainderof 2020; near-term NCOs expected to remain in linewith 2Q; 2Q NCOs increase reflects charges withinenergy & restaurant, as well as addition of Ascentium2Q20ACL coverageratioProvision includes 64M initial reserves for nonPCD loans in Ascentium acquisition Criticized business loans increased 67% reflectingdownward risk-rating revisions for loan deferralscombined with downgrades within energy, restaurant,hotel and retail11
Bottom up review informs and narrows COVID-19high-risk industry sectors (as of June 30, 2020)BAL (1)% ofBAL %Utilization(2) 1.37b1.5%66%—%80%6%48% 0.26b0.3%80%6%—%23%5% 1.13b1.2%72%4%4%32%4% 0.46b0.5%75%—%—%29%8%Restaurants – Full service, Special Food Services 0.80b0.9%86%21%40%29%32%Retail (non-essential) – Clothing 0.25b0.3%67%—%75%11%44%Travel and Leisure – Amusement, arts and recreation 0.65b0.7%80%37%48%17%17% 4.92b5.4%73%10%40%21%25%BAL (1)% ofBAL %Utilization(2)Hotels – Full service, limited service, extended stay 0.98b1.1%81%—%69%18%27%Retail (non-essential) – Primarily malls and outlet centers 2.53b2.8%65%—%77%9%25% 3.51b3.9%69%—%75%11%25%C&I PortfolioEnergy – Oil & Gas Extraction, Oilfield ServicesFreight transportation – Local General Freight, FreightArrangementHealthcare – Offices of Physicians and Other HealthPractitionersOther Consumer Services – Personal care services,Religious Organizations, Dry cleaning & Laundry ServicesTotalCRE related exposures including unsecured C&ITotalLeveragedSNC%%% of BAL % of BAL Deferral CriticizedLeveragedSNC%%% of BAL % of BAL Deferral CriticizedOngoing Portfolio Surveillance Proactive, frequent customer dialogue Closely monitoring most vulnerable customers Monitoring ratings migration Central reporting on enterprise-wide relief initiatives Established pandemic related monitoring Deferral requests Revolver draws(1) Amounts exclude PPP Loans, Operating Leases and Held For Sale exposure. (2) Borrowing Base Adjusted Commitments, excludesOperating Leases and Held For Sale.12
COVID-19 high-risk industry sectors waterfall( in billions)QoQ highlights 2.3 0.7 12.4 8.4 (6.3) Based on a deep dive of ourportfolios, COVID high-risk industrieswere further refined to thoseexhibiting higher levels of stress dueto COVID impact CRE Retail sector was updated toreflect all retail, not just malls(1) (0.7) Several sub-sectors were removedincluding but not limited 2)6/30/2020High-RiskBalances Energy sub-sectors other thanOFS and E&P Freight Transportation subsectors other than Trucking C&I Retail (non-essential) subsectors other than Clothing(1) CRE Retail sector was updated to reflect all retail, not just malls. (2) Other activity includes payments, charge-offs, new loans, moves toheld for sale and NAICs changes.13
Capital and liquidityTier 1 capital ratio(1)QoQ highlights Preliminary stress capital buffer for 4Q20-3Q21 estimated at3.0%; final stress capital buffer to be determined by August 3111.1%10.6%2Q191Q2010.4%2Q20Common equity Tier 1 ratio(1)9.4%8.9%1Q20 LQ decline in capital ratios driven primarily by 2Q netloss, purchase of Ascentium Capital, growth in RWA Issued 350M preferred equity in 2Q that mitigateddecline in Tier 1 capital Declared 149M in 2Q common dividends; no 2Q sharerepurchases - suspended repurchases through the end of 2020 Subject to Board approval, management will recommend 3Qdividend be maintained at current level; will monitor economicenvironment and adj. future capital distributions as appropriate9.9%2Q19 CET1 ratio of 8.9%(1); internal models informed by severelyadverse stress testing continue to indicate 9% is appropriatecapital level in normal conditions to ensure capital adequacy inperiods of stress, such as the current environment2Q20(1) Current quarter ratios are estimated. (2) Based on ending balances. 1B of pre-tax securities gains and 1.9B of pre-tax hedge gainsin OCI are not included in regulatory capital numbers but areavailable to absorb losses Historically high deposit balances contributed to 10 ppt declinein 2Q loan-to-deposit ratio ending quarter at 78%14
Appendix15
Proactive hedging strategyNotional cash flow derivatives at 6/30/20(1)( in billions) 21.50 21.75 22.75 22.75 22.75 18.50Securities and hedges(1) as %(4)ofearningassets50%40%30% 15.50Peer Median 27%20%Securities4Q191Q202Q20Legacy swapsCash-Flow HedgeNotional3Q204Q201Q21Program swaps2Q213Q21Program floorsPeer 13RFPeer 12Peer 11Peer 10Peer 9Peer 8Peer 7Peer 6Peer 5Peer 4Peer 3Peer 20% 6.25Peer 110%Cash flow hedges Comprehensive hedging strategy intended toprotect NII and promote earnings stability Majority of hedges active in 1H20; with 3B ofadditional protection beginning 3Q20 Program hedges mature 5 years from startdates, protecting against lower rates for longerFixed Rate/Strike(2)Inclusive of deferredG/L(3)2.18% Hedging stabilizes NII sensitivity profile toshort-term rates in 2020 and beyond1.74% Better protected than peer set both in size andduration of protectionProgram Swaps 11.0B2.15%Program Floors 6.75B2.08%Legacy Swaps 5.00B1.49%(1) Includes both active and forward starting swaps/floors entered into prior to 6/30/2020 that provide incremental NII protection. (2) Weightedaverage strike price for program floors excludes premiums paid. Swap and floor floating legs a blend of 1m/3m LIBOR, primarily 1m LIBOR. (3) Avg.receive fixed rate including amortization of deferred gains (losses) from terminated cash flow hedges. (4) 1Q20 data latest available whenpublished; Source: SEC reporting; peers include CFG, CMA, FHN, FITB, HBAN, HWC, KEY, MTB, PNC, SNV, USB, ZION, and TFC.16
Interest rate exposure of futurebusiness and long-term rates% Fixed Within the securities portfolio, reinvestment and premiumamortization contribute to a portion of Regions’ NII exposure tointerest rates Portfolio constructed to protect against lower market rates* 31% of securities portfolio in bullet-like collateral (CMBS,corporate bonds, and USTs), up from 27% at year-end 2018* Purchase MBS with loan characteristics that offer prepaymentprotection: lower loan balances, seasoning, and state-specificgeographic concentrationsPeer 13Peer 12Peer 11Peer 10Peer 9RFPeer 8Peer 7Peer 6Peer 5Peer 4* Exposure to fixed-rate assets in-line with peers ( 41% fixedexcluding hedges)Peer 3 Balance sheet mix is a reasonable proxy for long-end rate sensitivityPeer median 42%Peer 2* 10.5B fixed-rate loan production* 4B fixed-rate securities reinvestment100%90%80%70%60%50%40%30%20%10%0%Peer 1 The majority of Regions’ residual NII exposure to interest ratescomes from future business activities and cash-flow reinvestment;full-year 2020 estimate:Fixed / float loan mix(1)% VariableSecurities portfolio composition(2)Corporate Bonds:5.4%Non-Agency CMBS:2.4%Agency/UST: 0.9%Agency CMBS:23.2% 25.2B Book premium lower by over 32% since last time long-termrates hit lows in 2016(1) 3/31/2020 data latest available; Source: SEC reporting, Call Report data for loan repricing within 1 year; Peers include CFG, CMA, FHN, FITB,HBAN, HWC, KEY, MTB, PNC, SNV, USB, ZION, and TFC. (2) Includes AFS, the unrealized AFS gain, and HTM securities as of 6/30/2020.Agency MBS:68.1%17
CET1 Waterfall0.6%9.4%(0.1)%(0.3)%8.9%(0.7)%1Q20 CET1%Pre-tax preprovisionincome(2)CommondividendNote: Provision expense includes the impact of CECL deferral(1) Current quarter ratios are estimated. (2) Non-GAAP; see appendix for 2Q20 CET1%(1)18
Allowance for credit losses waterfall( in millions)QoQ highlights Q2 allowance increased 760M from Q1due primarily to: 382 136 2,425 242 Downgrades in Retail, Hotel, Energyand Restaurant sectors Continued economic uncertaintydue to COVID-19 pandemic Ascentium acquisition 1,6653/31/2020EconomicOutlook &RelatedAdjust.Risk RatingChangesPCD and NonPCD reservesfor Ascentiumpurchase6/30/2020 Given difficulties in modeling the currentmacroeconomic environment, portfoliospecific reviews were completed toensure appropriate alignment withpotential risks in the portfolios Given the focus on unemployment,additional analytics were performed inorder to provide a range of potentialmodel adjustments19
Base R&S Economic Outlook(as of June 19, 2020)Pre-R&Speriod2Q2020 3Q2020 4Q2020 1Q2021 2Q2021 3Q2021 4Q2021 1Q2022 2Q2022Real GDP, annualized % changeUnemployment rateHPI, year-over-year % changeS&P 500(37.9)%25.6%9.0%5.6%4.1 %3.0 %2.9%2.6%2.8%13.2 %9.9%9.1%8.6%7.9 %7.4 %7.0%6.7%6.5%5.7 533,2703,2833,3133,3473,3753,398 Economic forecasts represents Regions’ internal outlook for the economy over the reasonable &supportable forecast period. Given significant government relief programs and stimulus, as well as certain limitations in ourmodels in the current economic environment particularly the level of unemployment, managementdeveloped alternative analytics to support reductions to the modeled results. The June 30, 2020 allowance includes a reduction to the modeled Base forecast to adjust foroversensitivity within the models, specifically for unemployment. These adjustments must thereforebe taken into consideration when comparing these scenarios with the final allowance.20
Allowance AllocationAs of 6/30/20(in millions)C&ICRE-OO MortgageCRE-OO ConstructionTotal CommercialIRE MortgageIRE ConstructionTotal IRELoan Balance 47,6705,491314 53,47553As of 3/31/20ACLACL/Loans 1,1092.33%2494.53%206.25% 1,3782.58%Loan Balance 45,3885,550309 51,247ACLACL/Loans 5971.32%1803.24%175.50% 7941.55%5,2211,908 7,12913255 1872.53%2.89%2.62%5,0791,784 6,8635823 811.14%1.29%1.18%Residential First MortgageHome Equity LinesHome Equity LoansIndirect- VehiclesIndirect- Other ConsumerConsumer Credit CardOther ConsumerTotal Consumer15,3824,9532,9371,3313,0221,2131,106 29,944151146423427814366 5,2013,0001,5573,2021,3031,190 29,98896142332430012174 vernment Guaranteed PPP LoansTotal, Excluding PPP Loans(1) 90,5484,498 86,050 2,425— 2,4252.68%—%2.82% 88,098— 88,098 1,665— 1,6651.89%—1.89%(1) Non-GAAP; see appendix for reconciliation.Note - All PPP loans are included in C&I. Excluding PPP loans from that category would increase the ACL ratio for C&I loans to 2.57%.21
Commercial loansAs of 6/30/20( in millions)Administrative, Support, Waste & RepairAgricultureEducational ServicesEnergy - Oil, Gas & CoalFinancial Services53Government & Public SectorHealthcareInformationProfessional, Scientific & Technical ServicesReal EstateReligious, Leisure, Personal & Non-Profit ServicesRestaurant, Accommodation & LodgingRetail TradeTransportation & Total CommercialTotal Commitments ,9932,8185,0103,8774,6756,3509,333158 89,157 Includes Commercial and Commercial Real EstateOwner Occupied Loans Utilization % presented incorporates all loan structuresin the portfolio; utilization on revolving line structureswas 45% at 6/30/2020Outstanding Balances 2632,4803,1192,7011,9013,3485,176(212) 53,475% 70%41%53%55%N/A60% The Real Estate section includes REITs Commitments to make commitments are notincluded(1) Contains balances related to non-classifiable and invalid business industry codes offset by payments in process and fee accounts that are not available at the loan level.22
Leveraged portfolio(outstanding balances as of June 30, 2020)Leverage DefinitionLeveraged Balances by Industry Regions Leveraged Lending Definition - 6.1B in balances Commitments are 10MProfessionalServices 17% Leverage exceeds 3x senior debt; 4x total debtInformation 13% Includes investment & non-investment grade loansManufacturing 10%17%17% Healthcare 10% Regions’ leveraged lending exposure just below the peeraverage(1)Financial Services9%7% 6.1B8%13%Wholesale 9%10%9%9%10%Moody’s 2018 Regional Bank Survey Definition(1) - 3.0B inoutstanding balancesReligious, Leisure,Personal & NonProfit Services 8%Restaurant,Accommodation &Lodging 7%Other 17%(Portfolios 7% oftotal) Important Factors Not a strategic growth objective; used to support clientrelationships Sponsor-owned clients as a percentage of total portfoliocontinue to decline Enhanced centralized underwriting, servicing, and creditadjudication Very limited participation in the highest risk segments ofleveraged loans - Covenant Lite & Term Loan B Approximately 81% of leveraged loans outstanding arealso SNCs(1) As measured against TCE. Moody’s Investor Services – “Regional banks’ leveraged loan exposures are modest but growing”23
SNC portfolio(outstanding balances as of June 30, 2020)Shared National Credit Balances by Industry9% Portfolio Characteristics9%47%9% 21.5B8%6%6%6%Financial Services 9%Retail 9%Energy 9%Manufacturing 8%Information 6%Wholesale 6%Healthcare 6%Other 47% (Portfolios 6% of total) Diverse industry mix 31% of balances are investment grade 23% of balances are leveraged 24% of balances are sponsor-backed 8% of SNC balances are criticized24
Energy lendingAs of 6/30/20( in millions)# of Clients(2)Oilfield services and supply (OFS)162(1)TotalCommitments 516OutstandingBalances 360% Utilization70% Criticized 187% Criticized52%Exploration and production 1%13220%15533689726%-0%92877225%4360%PPP Loans1271313100%-0%Total direct446 4,303 2,19551% 83438%DownstreamOther(3) Leader in the Energy lending business for over 50 years No second lien exposure Throughout 2019 and 2020, growth in Energy commitmentsand outstandings have been essentially flat Midstream sector continues to benefit from protectivecontracts for gathering, transporting and storinghydrocarbons. EBITDA levels are projected to drop 2H20as throughput volumes decline. 85.8M in charge-offs for YTD 2020, 84.2M of which isassociated with four clients 10.5% allocated reserve for COVID-19 high-risk energy loans(2)(ex-PPP); 8.1% allocated reserve for total direct (ex-PPP) No Leveraged loans within the direct energy related balances Utilization rate has remained between 40-60% since 1Q15 Hedge positions are adequate for oil producers and strongfor natural gas providers. Average oil hedge position of59% and 35% of proved developed reserves (PDP) for 2020and 2021, respectively with natural gas providers hedgedat 73% and 84% of PDP for the same periods. Direct energy loans that are on non-accrual status are 6% ofenergy loans at 6/30/20(1) Represents the number of clients with loan balances outstanding. (2) OFS and E&P are designated as COVID-19 high-risk portfolios. (3) Othercategory is primarily related to Bituminous Coal Mining.25
Energy lending (continued)Balances by CategoryGross Losses 1,500 85.8 90 80 1,200 7053 60 900 (Millions) (Millions) 75.1 600 50 36.7 40 32.9 28.5 30 20 300 6.0 10 oaLOtPPP2Q2020 0 0.02014201520161207120812090D220YTE&POilfield ServicesMidstreamDownstreamOther**Other Losses include losses to MLP funds as well as losses related to coal.26
Restaurant lendingAs of 6/30/20OutstandingBalances 1,280% Utilization84% Criticized 168% ofOutstandingCriticized13%( in millions)Quick Service# of Clients*18,491TotalCommitments 1,521Casual Dining3156048787%25452%Other2316614990%2013%53PPP Loans2,548396396100%—0%Total Restaurants21,093 2,643 2,31287% 44219% Team of bankers in place with specialization in thisindustry Charge-offs were 21 million in 2019 and are 31.6million YTD 2020 Greater risk focus on quality of sponsor Quarantines, social distancing, and reduced businesstravel will result in lost demand, much of which may notbe recoverable 798M balances of full-service and special food servicesreflect COVID-19 high-risk loans; 7.1% allocated reserve(ex-PPP); 6.7% allocated reserve to total restaurantbalances (ex-PPP) Prior to the pandemic, Regions had strategically exitedsome higher risk restaurant relationships at par; throughnatural attrition and proactive risk management actions,we have reduced our exposure Casual dining is the sector under the most stress Quick service restaurants focus on fast food service andlimited menus. Same store sales have held up reasonablywell given the digital platform, drive thru and deliverycapabilities. 18% of Restaurant Outstandings are leveraged 131 million of balances and 138 million of commitments relating primarily to Traveler Accommodations have been excluded from the Restauranttotals and are reflected in the Hotel related exposure.*Represents the number of clients with loan balances outstanding.27
Hotel lendingAs of 6/30/20OutstandingBalances 714% Utilization80% Criticized 0% ofOutstandingCriticized0%( in millions)CRE-Unsecured# of Clients*12TotalCommitments 888IRE – Mortgage1724723896%23699%IRE – Construction3803139%31100%Consumer Services3,66613813195%11%3293737100%—0%4,027 1,390 1,15183% 26823%PPP LoansTotal Hotel related53 CRE – Unsecured outstanding balance is comprised of 12 REIT customers 59% of total hotel related loans are SNCs The REIT portfolio benefits from low leverage, strong liquidity, and diversity of property holdings. Companieshave also taken proactive steps to reduce CAPEX, cut dividends, and reduce overhead to preserve cash.*Represents the number of clients with loan balances outstandingConsumer services represents amounts relating primarily to Traveler Accommodations that have been excluded from the Restaurant totals and arereflected in the Hotel related exposure28
Commercial retail lendingAs of 6/30/20# of Clients*30TotalCommitments 3,114OutstandingBalances 1,789% Utilization57% Criticized92% 49555%292%1638122960%——%2,3201,26655%292%( in millions)REITsLeveragedNot 8848%16328%4,605334334100%00%34,802 8,909 5,54863% 84015%PPP LoansTotal Retail(1) Approximately 553 million of outstanding balances across theREIT and IRE portfolios relate to shopping malls and outletcenters, comprised of 338 million Class A and 215 millionClass B/C. Portfolio exposure to REITs specializing in enclosed malls consistsof a small number of credits. 48% of balances are Investment Grade with low leverage IRE portfolio is widely distributed; largest tenants typicallyinclude 'basic needs' anchors. However, almost all IRE Retaildowngraded to Criticized in May due to low rent collections andconcerns over tenant viability longer term. C&I retail portfolio is also widely distributed; largest categoriesinclude: Motor vehicle & parts dealers 325 million outstandingto 2,200 clients Building materials, garden equipment & supplies 240million outstanding to 1,100 clients Non-store retailers 150 million outstanding to 1,000clients CRE-OO portfolio consists primarily of small strip malls andconvenience stores and is largely term loans where a higherutilization rate is expected ABL portfolio is collateralized primarily by inventory andaccounts receivableSecurities portfolio includes 518 million (net of defeased loans) of post-financial crisis issued AAA rated CMBS with exposure to retail within thediversified collateral pool; protected with 50% credit enhancement (defease adjusted), and losses expected to be de minimis in severely adversescenario
Net interest income and net interest margin NII(1) and NIM ( in millions) (1) Net interest income on a fully taxable equivalent basis. (2) 1m LIBOR -1.05% QoQ; 10yr US Treasury -0.69% QoQ. (3) Hedges remain active; 1.9B unrealized, pre-tax gain, to be amortized into NII over the remaining life of hedges 5 years. (4) Assumes Fed Funds Target