Transcription
Molecular 23-2Selective GSK3β Inhibition Mediates an Nrf2‑IndependentAnti‑inflammatory Microglial ResponseMohamed H. Yousef1 · Mohamed Salama2 · Hassan A. N. El‑Fawal2 · Anwar Abdelnaser2Received: 13 February 2022 / Accepted: 10 June 2022 The Author(s) 2022AbstractGlycogen synthase kinase 3 (GSK3) is associated with the proinflammatory phenotype of microglia and has been shownto act in concert with nuclear factor kappa B (NF-κB). GSK3 is also a suppressor of nuclear factor erythroid 2-relatedfactor 2 (Nrf2), the principal regulator of redox homeostasis. Agreeing with the oxidative paradigm of aging, Nrf2 isoften deregulated in parainflammatory and neurodegenerative diseases. In this study, we aimed to explore a multimodaldisease-modifying utility of GSK3 inhibition, beyond neuronal proteopathologies. Furthermore, we aimed to underscorethe difference in therapeutic value between the two GSK3 paralogs by isoform-selective chemical inhibition. The antiinflammatory effects of paralog-selective GSK3 inhibitors were evaluated as a function of the reductive capacity ofeach to mitigate LPS-induced activation of SIM-A9 microglia. The Griess method was employed to detect the nitratelowering capacity of selective GSK3 inhibition. Real-time PCR was used to assess post-treatment expression levels ofpro-inflammatory markers and antioxidant genes; pro-inflammatory cytokines were assayed by ELISA. Nuclear lysatesof treated cells were examined for Nrf2 and NF-κB accumulation by immunoblotting. Finally, to infer whether thecounter-inflammatory activity of GSK3 inhibition was Nrf2-dependent, DsiRNA-mediated knockdown of Nrf2 wasattempted. Results from our experiments reveal a superior anti-inflammatory and anti-oxidative efficacy for GSK3βselective inhibition, compared to GSK3α-selective and non-selective pan-inhibition; hence, use of selective GSK3βinhibitors is likely to be more propitious than non-selective dual inhibitors administered at comparable doses. Moreover,our results suggest that the anti-inflammatory effects of GSK3 inhibition are not Nrf2 dependent.Keywords GSK3 · Paralog selectivity · Microglia · Neuroinflammation · Neurodegenerative diseases · Oxidative stress ·Nrf2 · NF-κBIntroduction and Literature ReviewUncontrolled chronic inflammatory responses are essentiallymaladaptive and conducive to extensive CNS damage thatcan go as far as promoting neuronal degeneration [1, 2].Evidence suggests that neuroinflammation is an integralcomponent of neurodegenerative diseases (NDs) suchas Alzheimer’s disease (AD), Parkinson’s disease (PD),* Anwar Abdelnaseranwar.abdelnaser@aucegypt.edu1School of Sciences and Engineering, BiotechnologyGraduate Program, The American University in Cairo, P.O.Box: 74, Cairo, Egypt2Institute of Global Health and Human Ecology, Schoolof Sciences and Engineering, The American Universityin Cairo, P.O. Box: 74, Cairo, Egyptand amyotrophic lateral sclerosis (ALS) [3–5]. Presently,microglia constitute the focus of neuroimmunology[6], and in turn, neuroinflammation [7]. Microglia areimmunocompetent cells of the monocyte lineage and theresident macrophages of the CNS [8]. If and when anaggravating stimulus is encountered, microglia assumean “activated state,” which is characterized by severalphenotypic changes [9]. Dysregulation of microglialactivation is a common pathological feature of NDs [10–14].Within a fairly complex signaling circuitry, glycogen synthase kinase 3 (GSK3), nuclear factor erythroid2-related factor 2 (Nrf2), and nuclear factor kappa-lightchain-enhancer of activated B cells (NF-κB) constitutea particularly important regulatory loop in neuroinflammation and NDs [15]. Multiple reports suggest signalingcooperativity between the Nrf2/ARE antioxidative pathway and the Wnt/β-catenin pathway, of which GSK3 is a13Vol.:(0123456789)
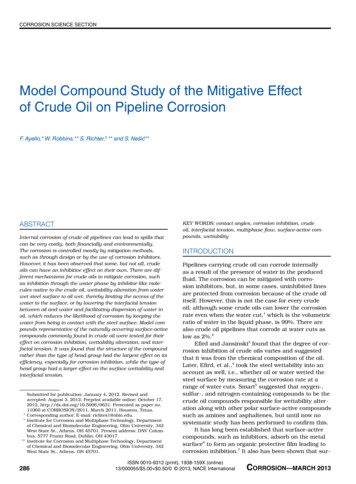
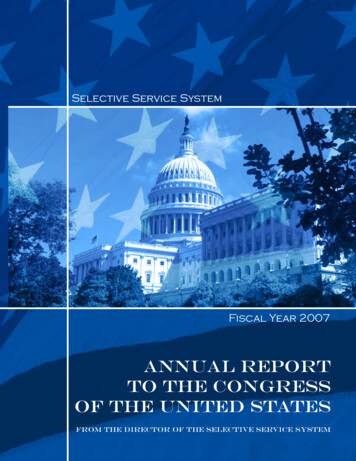
Molecular Neurobiologycentral regulator. The convergence of these two axes wasrecognized as consequential to glial-mediated inflammation, aging, and neuronal degeneration [16–22]. GSK3 hasindeed been proven to serve as a pivotal player within thisregulatory network, inhibiting the neuroprotective andantioxidant function of Nrf2 [23–26] and encouraging theinflammatory role of NF-κB [27, 28].GSK3 is a pleiotropic serine/threonine kinase that hasbeen recognized as the principal tau-phosphorylatingkinase, which led to a growing interest in GSK3 as atherapeutic target in neurodegenerative tauopathies [23,29, 30]. GSK3 was found to mediate the phosphorylationof the majority of abnormally phosphorylated residuesin AD [31, 32]. Henceforth, GSK3 has been recognizedas a pivotal regulator of toll-like receptor (TLR) signaling, maintaining the balance between proinflammatoryand anti-inflammatory responses [33]. GSK3 overactivityincites microglial activation and provokes overproduction of proinflammatory cytokines, chemokines, and nitricoxide (NO) [33–36]. Some studies have gone as far as toconclude that GSK3 gain-of-function is a primary driver inneuroinflammation-mediated neuronal loss [34, 37].Two isoforms (GSK3α and GSK3β) account for GSK3activity in all mammals [38]. The catalytic domain isconserved between the two GSK3 isoforms with 98%homology [39, 40]. However, within the hinge region, theATP-binding domain features a switch of the amino acidglutamate (E196) in GSK3α to the amino acid aspartate(D133) in GSK3β, resulting in significant topologicaland structural disparity between the two paralogs, due toan alteration of hydrogen bonding between the enzymedomains [41]. Unraveling such a subtle difference betweenGSK3 paralogs, Wagner et al. set out to exploit this topological dissimilitude between the isomers with the purposeof developing paralog-selective GSK3 inhibitors [41].The team thereupon developed a set of compounds withremarkable selectivity profiles (Fig. 1).In the current study, we utilize these GSK3 inhibitorsto selectively inhibit the GSK3 paralogs in the context ofmicroglial activation. GSK3 is multimodally inculpated inmediating etiopathogenic processes in NDs, both neuronal(proteopathic) and glial (inflammatory). Given the oxidativeand inflammatory nature of this disease group in all neuralsubsets, inhibition of GSK3 can entail a trilateral modulatory utility, whereby its suppression would stunt pathological phosphorylation events associated with injurious misfolded proteins, alleviate glia-mediated neuroinflammatoryprocesses through modulation of NF-kB, and mitigate oxidative damage in both neurons and neuroglia via its regulation of Nrf2. Moreover, given its inability to initiate thepro-malignant β-catenin-driven transcriptional program, theexamination of selective inhibition of GSK3α was pursuedin comparison with its long-studied paralog.Materials and MethodsMaterialsThe SIM-A9 murine microglial cell line (CRL-3265 )was purchased from the American Type Culture Collection (ATCC). BRD0705 (GSK3α inhibitor), BRD3731(GSK3β inhibitor), and BRD0320 (GSK3α/β inhibitor)were kindly provided by the Broad Institute, Inc (Cambridge, MA, USA) in accordance with a material transferagreement. Sulforaphane (SFN; 10,496) was purchased fromCayman Europe OÜ (Tallinn, Estonia). LPS (Escherichiacoli O111:B4; L2630) was purchased from Sigma Chemical Co. (MO, USA). Dulbecco’s modified Eagle medium/Nutrient Mixture F-12 Gibco DMEM/F-12, HEPES(31,330,038), Gibco Fetal Bovine Serum (10,270,106),Gibco Horse Serum, heat inactivated (26,050,070),Gibco DPBS, no calcium, no magnesium (14,190,094),dimethyl sulfoxide DMSO (67–68-5), chloroform (HPLCFig. 1 Chemical structure of BRD0705 (GSK3α inhibitor) (a), BRD3731 (GSK3β inhibitor) (b), and BRD0320 (GSK3α/β non-selective inhibitor) (c). Structures were drawn using MolView13
Molecular Neurobiologygrade; C607SK-1), isopropanol (HPLC grade; BP26324),ethanol (HPLC grade; 64–17-5), RevertAid cDNA kit(K1621), PowerUp SYBR Green (2X) Master Mix(A25741), mRNA (CD11b, IL-6, iNOS, TNF-α, GAPDH)primers (10,629,186; designed by NCBI primer blast tool),Pierce BCA Protein Assay Kit (23,225), and Pierce ECL Western Blotting Substrate (32,106) were all acquiredfrom ThermoFisher Scientific (MA, USA). MTT (M6494),Griess Reagent Kit (G7921), NuPAGE LDS SampleBuffer (NP0007), NuPAGE Reducing Agent (NP0009),NuPAGE 10%, Bis–Tris, 1.0 mm, Mini Protein Gels,10-well (NP0301), 20X NuPAGE MES Running Buffer(NP0002), NF-κB p65 polyclonal antibody (PA1-186), andBlocker BSA (10%) in PBS (37,525) were obtained fromInvitrogen (CA, USA). Penicillin–Streptomycin MixturePen/Strep (09-757F) and phosphate-buffered saline (10X)PBS (17-516Q) were supplied by Lonza-Bioscience (Basel,Switzerland). QiAzol lysis buffer (79,306) and nucleasefree water (129,114) were procured from Qiagen (Hilden,Germany). Protease Inhibitor Cocktail (5871), PhosphataseInhibitor Cocktail (5870), Prestained Protein Marker, BroadRange (11–190 kDa) (13,953), Nrf2 monoclonal antibody(12721 T), β-Catenin (D10A8) XP Rabbit mAb (8480),and secondary goat anti-rabbit HRP-conjugated antibody(7074P2) were all requisitioned from Cell Signaling (Danvers, MA, USA). 10 Towbin Buffer (42,558.02), 10 TBSBuffer (42,596.01), Tween 20 (39,796.01), and Methanol(45,631.02) were from SERVA Electrophoresis GmbH(Heidelberg, Germany). Mouse IL-1β ELISA Kit (E-ELM0037), Mouse IL-6 ELISA Kit (E-EL-M0044), MouseTNF-α ELISA Kit (E-EL-M0049), and Lamin B1 PolyclonalAntibody (E-AB-40257) were obtained from Elabscience(Houston, TX, USA). HERAPLUS SYBR Green qPCRKit (WF10308001) was purchased from Willowfort (Birmingham, UK) and primers IL-1β, Iba1, c-Myc, HO-1 andOsgin1 (S015950; designed by NCBI primer blast tool) wereordered from Synbio Technologies (Monmouth Junction, NJ,USA). TriFECTa RNAi Kit and PrimeTime Assays for Nrf2(Mm.PT.58.29108649) and HPRT (Mm.PT.39a.22214828)were supplied by Integrated DNA Technologies (Coralville,IA, USA), and the Minute Cytoplasmic and NuclearExtraction Kit for Cells (SC-003) was bought from InventBiotechnologies (Plymouth, MN, USA).Cell CultureSIM-A9 cells (CRL-3265 ) were maintained in Dulbecco’smodified Eagle medium/Nutrient Mixture F-12 (DMEM/F12) medium supplemented with 10% heat-inactivatedfetal bovine serum, 5% heat-inactivated donor horse serum,and 1% Pen-Strep (100 units/mL penicillin, and 100 μg/mLstreptomycin) in a 5% CO2 humidified incubator at 37 C.Cell Viability: MTT AssaySIM-A9 cells were seeded in 96-well microtiter plates at adensity of 1 105 cells/mL and allowed to acclimate overnight. To determine non-cytotoxic concentrations of theexperimental compounds, the cells were treated with different concentrations of GSK3 inhibitors (10 μM, 20 μM,40 μM and 80 μM) for 24 h. Sulforaphane (SFN), used asa positive control for countering inflammation and Nrf2activation, was also evaluated for its cytotoxicity at different molarities (1 μM, 5 μM, 10 μM). Additionally, varying concentrations (10 ng/mL, 100 ng/mL, and 1 μg/mL)of E. coli LPS (O111:B4) were similarly evaluated; toxicityfollowing treatment with 100 ng/mL in conjunction witheach GSK3 inhibitor or SFN was also assessed to simulatesubsequent experimental conditions. All treatments wereprepared in serum-free DMEM/F12 medium. Cell viabilityfollowing treatments was determined using the MTT colorimetric assay. Following a 24-h incubation of the treatmentswith the cells, the culture medium was aspirated off andreplaced with 100 μL of (1 mg/mL) MTT solution preparedin serum-free DMEM/F12 medium. Subsequent to a further 2-h incubation, the MTT solution was discarded, andthe insoluble formazan crystals formed were dissolved in100 μL DMSO. Absorbance was measured at 540 nm usingNanoSPECTROstar microplate reader (BMG LABTECH,Ortenberg, Germany), and cell viability was calculated relative to untreated controls.Determination of Nitrite: Griess MethodThe concentration of nitrite in the culture medium was determined using the Griess method. The Griess reaction wasperformed following a treatment protocol in which cellswere pretreated with GSK3 inhibitors (10 μM, 20 μM, and40 μM) or SFN (5 μM) for 2 h and then stimulated with100 ng/mL LPS for 24 h, with continued exposure to thecompounds. Thereafter, 150 μL of cell culture media werediluted with 130 μL of deionized water and 20 μL of theGriess reagent were added to the diluted supernatant. Following a 30-min incubation in the dark, the color of theformed azo chromophore was spectrophotometrically measured at 548 nm using Nano SPECTROstar microplate reader(BMG LABTECH, Ortenberg, Germany). The concentration of nitrite in each sample was computed using the linearequation generated from a standard curve, which was plottedusing the recorded absorbance values for various concentrations of a nitrite standard.Treatment and Isolation of Total RNASIM-A9 cells were seeded in 6-well plates at a density of1 106 cells/mL and allowed to acclimate overnight. The13
Molecular Neurobiologycells were then treated with GSK3 inhibitors (10 μM and20 μM), or SFN (5 μM) for 2 h. Afterwards, the media wereaspirated off and a treatment cocktail preserving the sameabovementioned concentrations of the compounds withthe addition of LPS at a concentration of 100 ng/mL wasadded to induce microglial activation in the presence of theGSK3 inhibitors or SFN. Following an additional 6 h incubation, total RNA was extracted by lysing the cells usingthe phenol/guanidine-based QIAzol Lysis Reagent. Firststrand cDNA was synthesized from 1 μg of RNA of eachsample using the RevertAid First Strand cDNA SynthesisKit in line with the manufacturer’s guidelines. The mRNAexpression levels of inflammation-related genes (CD11b,Iba1, iNOS, IL-1β, IL-6, TNF-α) and Nrf2 target genes(HO-1 and Osgin1) as well as c-Myc (transcriptional targetof β-catenin) were quantified by real-time quantitative polymerase chain reaction using the ABI Prism 7500 real-timePCR system (Applied Biosystems, CA, USA). Expressionwas normalized to GAPDH (or HPRT in post-knockdownqPCR assessment of proinflammatory markers), and relativefold gene expression was computed using the comparativeCT (ΔΔCT) method. Specific primer pairs were generatedvia the NCBI Primer-Blast tool (https:// www. ncbi. nlm. nih. gov/ tools/ primer- blast/) and purchased from ThermoFisheror Synbio Technologies; primer sequences are shown inTable 1.For post-knockdown qPCR experiments, PrimeTimeqPCR primers for Nrf2 and HPRT were purchased fromIntegrated DNA Technologies (Coralville, IA, United States)Table 1 List of primers usedfor qPCRQuantification of Secretory ProinflammatoryCytokines Using ELISAPre-coated micro-ELISA plates from Elabscience wereused to quantify the protein expression of the proinflammatory cytokines IL-1β, IL-6, and TNF-α in the supernatantof SIM-A9 cells stimulated with LPS in the presence ofGSK3 inhibitors or SFN, following the treatment protocolabove. In short, the cells were seeded in 6-well plates at adensity of 1 106 cells/mL. Following overnight incubation,the cells were pretreated with GSK3 inhibitors (20 μM) orSFN (5 μM) for 2 h. The media were then removed andTarget mRNASequence (5′-3′)CD11bForward Primer:Reverse Primer:Forward Primer:Reverse Primer:Forward Primer:Reverse Primer:Forward Primer:Reverse Primer:Forward Primer:Reverse Primer:Forward Primer:Reverse Primer:Forward Primer:Reverse Primer:Forward Primer:Reverse Primer:Forward Primer:Reverse Primer:Forward Primer:Reverse H13as predesigned primer assays. The PCR reactions were subjected to the following thermocycling conditions: an initialholding stage run at 95 C for 10 min, followed by 40 2-stepcycles of denaturation at 95 C for 15 s then annealing/extension for 60 s at 60 C; data collection was set to occurduring step 2. For every gene of interest, ΔCT values weredetermined for each sample as the difference between the CTvalues obtained for the target gene and the reporter gene inthe same sample, where GAPDH (or HPRT in post-knockdown qPCR assessment of proinflammatory markers) wasused as the housekeeping reporter gene. Relative changes inexpression of any given gene (ΔΔCT) were then calculatedas the difference between the ΔCT of each treatment groupand the average ΔCT of the untreated control group. Finally,fold change of expression was determined as 2 ΔΔCT, individually calculated for each group.Tm ( C)AAG CAG CTG AAT GGA GGA CGGG CCC CAT TGG TTT TGT GAA CCT GCA GAC TTC ATC CTC TCAGG CAT CAC TTC CAC ATC AGGAT GCT ACC AAA CTG GAT ATA ATC AGCTC TGA AGG ACT CTG GCT TTG AAA GCT CTC CAC CTC AAT GGTTG GGA TCC ACA CTC TCC AGGGA ACC TAC CAG CTC ACT CTGG TGC TGA AAC ATT TCC TGT GCTGT GAA CTC CAG GCG GTG CCT ATTGA GAG GGA GGC CAT TTG GGCAC AGA TGG CGT CAC TTC GTC GTG AGG ACC CAC TGG AGG AGCGG TGA CAT CGC CCA CTA CGCT CGG ACT TAG CCC ACT CAGC TGT TTG AAG GCT GGA TTCTG CTG TTG CTG GTG ATA GACTT TGT CAA GCT CAT TTC CTGG TCT TGC TCA GTG TCC TTG C5555575555585557636063636062626253555758
Molecular Neurobiologyreplaced with fresh media containing 100 ng/mL of LPSwhile maintaining the concentration of GSK3 inhibitors at20 μM and SFN at 5 μM. The culture media were collected24 h later, centrifuged at 1000 g for 20 min at 4 C and thesupernatant was transferred to clean microcentrifuge tubes.For IL-6 and TNF-α, the supernatant was diluted in a ratio of1:20 in buffered sample diluent, whereas undiluted sampleswere used for the detection of IL-1β. Optical density wasmeasured at 450 nm using a NanoSPECTROstar microplatereader (BMG LABTECH, Ortenberg, Germany).Fractionation of Total Cell Lysates into Nuclearand Cytoplasmic ExtractsIn order to differentially evaluate the effect of inhibitionof GSK3 paralogs on the transcriptional activity of Nrf2,NF-κB p65, and β-catenin, nuclear lysates of treated SIMA9 cells were extracted using Minute Cytoplasmic andNuclear Extraction Kit for Cells, according to the manufacturer’s instructions. Briefly, SIM-A9 cells seeded at a densityof 1 106 cells/mL in 6-well plates were pretreated withGSK3 inhibitors (20 μM) or SFN (5 μM) for 2 h. Following an additional 24 h incubation with 100 ng/mL LPS inthe presence of the test compounds, the cells were washedin ice-cold PBS buffer and 300 μL cytoplasmic extraction buffer, containing 1 Protease Inhibitor Cocktail and1 Phosphatase Inhibitor Cocktail, and were added to eachwell. Cell lysates were transferred to pre-chilled microcentrifuge tubes, vortexed vigorously, and centrifuged at12,000 g for 5 min at 4 C. The supernatant (cytosolic fraction) was transferred to a clean tube and stored at 80 Cfor future use. Nuclear extraction buffer (150 μL), also containing protease and phosphatase inhibitor cocktails, wasadded to the pelleted nuclei, the mixture forcefully vortexedand incubated on ice for 1 min. The last step was repeated4 times, alternating between vigorous vortexing and 1 minincubation on ice. The nuclear extracts were then transferredto pre-chilled filter cartridges mounted onto collection tubesand centrifuged at 16,000 g for 30 s. The filter cartridgeswere then discarded, and the collected nuclear extracts werestored at 80 C until future use.Quantification of Cytoplasmic and Nuclear ProteinsTotal protein content in the cytoplasmic and nuclear fractions was quantified using the Pierce BCA Protein AssayKit. In a 96-well microtiter plate, 25 μL of each sample andstandard dilution were added to the designated wells. Everysample or standard dilution was assayed in triplicates. Ineach well, 200 μL working BCA reagent were added, theplate was thoroughly mixed on an orbital shaker for 30 sand then incubated at 37 C for 30 min. The plate was thencooled down, and the absorbance of the formed coloredcomplexes was measured at 562 nm using NanoSPECTROstar microplate reader (BMG LABTECH, Ortenberg,Germany). Sample concentrations were computed from theline equation generated by plotting OD values for varyingconcentrations of a bovine serum albumin standard.Western BlottingWestern blotting was carried out in denaturing and reducing conditions. Samples were prepared in 1 NuPAGE LDS Sample Buffer and 1 NuPAGE Reducing Agentand completed to volume with deionized water. The samples were briefly vortexed, spun down, and heated at 70 Cfor 10 min. The samples were then run on NuPAGE 10%,Bis–Tris, 1.0 mm, Mini Protein Gels. Gels were run at 200 Vfor 35 min. For protein transfer, the gels were blotted ontomethanol-activated PVDF membranes. Protein transfer wasset to run for 1 h at 30 V. Following completion of the transfer, membranes were briefly washed in 1 TBST buffer andblocked using 5% BSA in 1X TBST for 1 h on an orbitalshaker. Following adequate washing, primary anti-mouseNrf2 monoclonal antibody (1:1000), anti-mouse β-cateninmonoclonal antibody (1:1000), anti-mouse NF-κB p65 polyclonal antibody (1:2000), or anti-mouse Lamin B1 polyclonal antibody (1:1000) were added to the membranes andincubated at 4 C overnight, on a rocking platform. Secondary goat anti-rabbit HRP-conjugated antibody (1:2500) wasthen added to the membranes and incubated on a shaker for1 h at room temperature. Pierce ECL Western BlottingSubstrate was added to the membranes, and chemiluminescence was measured using the ChemiDoc Imaging System(Bio-Rad , CAT# 12,003,153); densitometric analysis ofthe imaged bands was carried out using the Image Lab 6.1software, using Lamin B1 as a loading control.Transfection of SIM‑A9 Cells with Nrf2‑TargetingsiRNAsSIM-A9 cells were reverse transfected using 3 different predesigned Nrf2-targeting DsiRNAs, a non-targeting negative control DsiRNA, an HPRT-targeting positive controlDsiRNA and a TYE 563 Transfection Control DsiRNA. Forcomplexing, Lipofectamine 3000 and the DsiRNAs, bothdiluted in basal DMEM/F12 medium, were added to eachother in a 1:1 ratio, such that the manufacturer-recommendedvolume of Lipofectamine/well is maintained at 3.75 μL andthe formed lipid complex encapsulated 10 nM DsiRNA.The mixture was incubated for 20 min for complete complexing. Afterwards, 750 μL cell suspension (equivalent to6 105 cells/well) and 250 μL of the DsiRNA-lipid complex were added to each well. The plates were thoroughlymixed and incubated in a 5% CO2 humidified incubator at37 C for 24 h. Fluorescence in cells transfected with the13
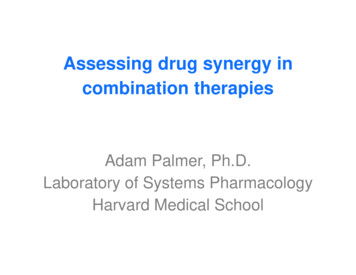
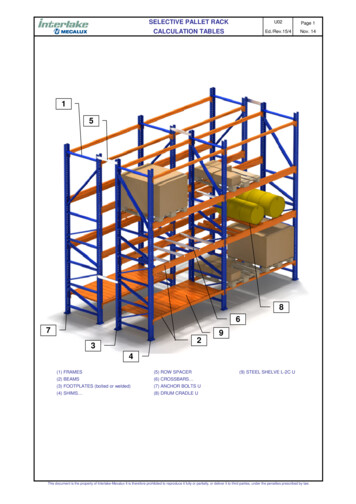
Molecular NeurobiologyTYE 563-labeled Transfection Control DsiRNA (Absorbance Maximum: 549 nm – Emission Maximum: 563 nm)was checked under Olympus IX70 Inverted FluorescentLight Microscope at 6 h and 24 h. The next day, the mediacontaining the transfection complex were discarded and thetreatment protocol was commenced as hereabove outlined.Following a 6 h incubation with LPS and GSK3 inhibitors(20 μM) or SFN (5 μM), the cells were lysed in QIAzol LysisReagent. Total RNA was thereafter extracted and processedfor qPCR experiments as previously described.Statistical AnalysisOne-way analysis of variance (ANOVA) followed by Student–Newman–Keuls post hoc test were applied to determine the statistical significance among the various studygroups. A threshold value of 0.5 was set for the probabilityvalue (P-value), with P 0.05 considered statistically significant. The data are presented as the means standard errorof the mean (SE) for the designated number of independently executed experiments. Comparative analysis amongstudy groups was carried out via SigmaPlot (Version 14.0;Systat Software, Chicago, IL, USA) and GraphPad Prism(Version 9.0.0; San Diego, CA, USA). Data was graphicallyrendered in GraphPad Prism.Table 2 Effect of LPS on the viability of SIM-A9 cellsSeeding density Cell viability for each LPS concentration(cells/mL)10 ng/mL100 ng/mL1 μg/mL0.5 1051 1052.5 1055 10594.97% 0.11100% 0.2796.96% 0.5696.50% 1.4466.11% 0.2694.28% 0.4292.73% 0.493.49% 0.9955.39% 0.2981.70% 0.1953.25% 0.2762.54% 2.61cytotoxicity across all cell densities. The percentage changein cell viability following LPS treatment is shown in Table 2.Given that treatment of cells seeded at 5 105 cells/mL withLPS at the 100 ng/mL concentration was associated with thehighest nitrite levels (as will be shown), while maintaining agood viability profile (Fig. 2), these conditions were adoptedfor subsequent experiments.Effect of BRD0705, BRD3731, BRD0320, and SFNon the Viability of SIM‑A9 CellsThe experimental GSK3 inhibitors BRD0705 (GSK3αinhibitor), BRD3731 (GSK3β inhibitor), and BRD0320(GSK3α/β inhibitor) were evaluated for their cytotoxicityin SIM-A9 cells via the MTT assay, following the hereinabove outlined treatment protocol, which uses 10, 20, 40,ResultsEffect of LPS on the Viability of SIM‑A9 CellsFor the purposes of this study, LPS was used to stimulate aproinflammatory program in SIM-A9 microglia. The MTTassay and the Griess method were conjointly employed todetermine the optimal concentration of LPS at which maximal microglial activation can be achieved, without compromising cell viability. To that end, SIM-A9 seeded at varyingdensities were treated with LPS at the following concentrations: 10 ng/mL, 100 ng/mL, and 1 μg/mL. Subsequent tomeasuring nitrite levels in the culture media from each groupto determine the LPS concentration/cell density combinationof the strongest proinflammatory response, the cellular viability of the cells was assayed using the MTT reagent as outlined above. Lower seeding densities were associated withincreased cytotoxicity at the 100 ng/mL and the 1 μg/mLconcentrations. Cells seeded at a density of 1 105 cells/mLfared considerably better (Table 2). On the other hand, seeding densities of 2.5 105 cells/mL and 5 105 cells/mL onlyexhibited a significant drop in viability at the 1 μg/mL LPSconcentration. However, cells seeded at both these densities maintained acceptable rates of viability for downstreamexperimentation when treated with 100 ng/mL LPS. LPSadministered at 10 ng/mL was not associated with significant13Fig. 2 Effect of LPS on viability of SIM-A9 cells. LPS cytotoxicitywas assessed using the MTT assay following treatment of SIM-A9cells (5 10.5 cells/mL) with 10 ng/mL, 100 ng/mL, and 1 μg/mLLPS. Data is expressed as means SEM. Group comparisons weredrawn using one-way ANOVA, followed by the Student–Newman–Keuls post hoc test; P-value 0.05 (relative to negative [untreated]controls)
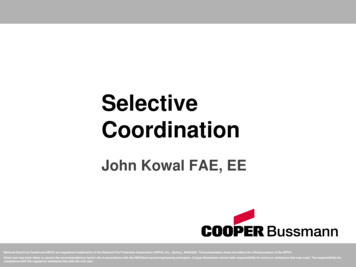
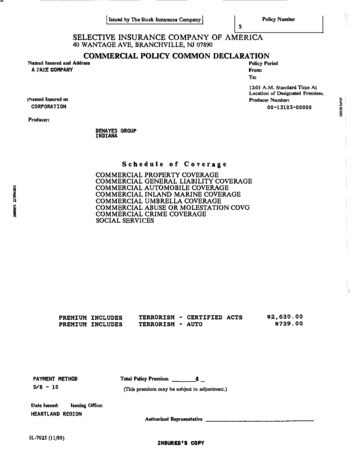
Molecular Neurobiologyand 80 μM concentrations of each compound alone or inconjunction with 100 ng/mL LPS. As evident in Fig. 3, noneof the compounds was significantly cytotoxic at any of thetested concentrations, either alone or in the presence of LPS.SFN, used as a positive control for countervailing inflammation and Nrf2 activation, was also assayed for its cytotoxicityat the treatment concentrations of 0.5 μM, 1 μM, 5 μM, and10 μM. Again, cellular viability was sustained across alltreatment concentrations.Effect of GSK3 Inhibitors on Nitrite Productionin LPS‑Stimulated SIM‑A9 CellsTo initially evaluate any potential anti-inflammatory effectassociated with the tested GSK3 inhibitors on a functional level, nitrite production was again measured in thecell culture media of SIM-A9 cells treated with LPS in thepresence of the GSK3 inhibitors, according to the protocol previously outlined. In this experiment, LPS significantly increased nitrite levels compared to control (Fig. 4).BRD0705 (GSK3α inhibitor) significantly inhibited theLPS-stimulated production of nitrites by 18.39%, 34.09%,and 35.43% at 10 μM, 20 μM, and 40 μM, respectively. TheGSK3β inhibitor, BRD3731, also significantly inhibitedLPS-stimulated nitrite production by 20.12%, 52.78%, and59.44% at 10 μM, 20 μM, and 40 μM, respectively. Theanti-nitrosative efficacy of the lowest concentration of theFig. 3 Effect of BRD0705, BRD3731, BRD0320, and SFN on viability of SIM-A9 cells. Cell viability was assessed using the MTTassay following treatment of SIM-A9 cells with BRD0705 (GSK3αinhibitor; a), BRD3731 (GSK3β inhibitor; b), BRD0320 (GSK3α/βFig. 4 Effect of GSK3 inhibitors on nitrite production in LPSstimulated SIM-A9 cells. SIM-A9 cell (5 10.5 cells/mL cell density) was stimulated with 100 ng/mL LPS for 24 h, in the presence of the GSK3 inhibitors and SFN. Nitrite production wasmeasured in the cell culture media using the Griess method. Datais expressed as means SEM. Group comparisons were drawnusing one-way ANOVA, followed by the Student–Newman–Keulspost hoc test; *P-value 0.05 (relative to the LPS-stimulatedgroup); P-value 0.05 (relative to negative [untreated] controls);#P-value 0.05 (BRD0705 at any given concentration relative toBRD3731 at the corresponding concentration)inhibitor; c), and SFN (d). All experimental compounds were thenreassessed in presence of 100 ng/mL LPS (e). Data is expressedas means SEM. Group comparisons were drawn using one-wayANOVA, followed by the Student–Newman–Keuls post hoc test13
Molecular NeurobiologyGSK3α/β inhibitor BRD0320 (10 μM) surpassed the highest of BRD0705 (GSK3α inhibitor; 40 μM) as it significantly inhibited the LPS-stimulated production of nitritesby 34.36%. Furthermore, BRD0320 (GSK3α/β inhibitor)significantly inhibited the LPS-stimulated production ofnitrites by 48.41% and 56.11% at 20 μM and 40 μM, respectively. Differences between the nitrite-lowering efficacy ofthe 20 μM and 40 μM concentrations of BRD0705 (GSK3αinhibitor) and BRD3731 (GSK3β inhibitor) were statistically significant, while only at the highest concentrationdid BRD0705 (GSK3α inhibitor) and BRD0320 (GSK3α/βinhibitor) exhibit any significant differences. Variationsbetween BRD3731 (GSK3β inhibitor) and BRD0320(GSK3α/β inhibitor) were insignificant across all concentrations. Lastly, SFN significantly inhibited the LPS-stimulatedproduction of nitrites by 98.65% at 5 μM.Effect of GSK3 Inhibitors on the mRNA Expressionof the Microglial Activation Markers CD11b and Iba1in LPS‑Stimulated SIM‑A9 CellsTo further investigate the putative anti-inflammatory effectsof selective and non-selective pharmacological GSK3 inhibition, gene expre
Abstract Glycogen synthase kinase 3 (GSK3) is associated with the proinammatory phenotype of microglia and has been shown to act in concert with nuclear factor kappa B (NF-κB). GSK3 is also a suppressor of nuclear factor erythroid 2-related factor 2 (Nrf2), the principal regulator of redox homeostasis.