Transcription
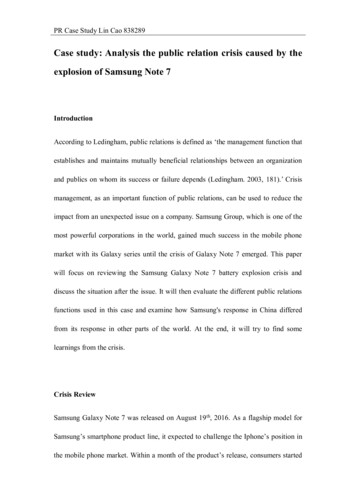
1-6 RelationsExpress each relation as a table, a graph, and a mapping. Then determine the domain and range.9. {(0, 0), (–3, 2), (6, 4), (–1, 1)}ANSWER:D { 3, 1, 0, 6}; R {0, 1, 2, 4}10. {(5, 2), (5, 6), (3, –2), (0, –2)}ANSWER:eSolutions Manual - Powered by CogneroPage 1
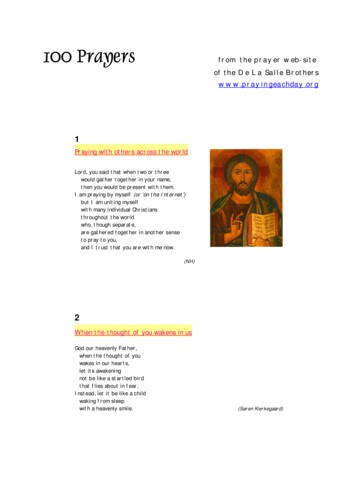
1-6 RelationsD { 3, 1, 0, 6}; R {0, 1, 2, 4}10. {(5, 2), (5, 6), (3, –2), (0, –2)}ANSWER:D {0, 3, 5}; R {–2, 2, 6}11. {(6, 1), (4, –3), (3, 2), (–1, –3)}ANSWER:eSolutions Manual - Powered by CogneroPage 2
1-6 RelationsD {0, 3, 5}; R {–2, 2, 6}11. {(6, 1), (4, –3), (3, 2), (–1, –3)}ANSWER:D { 1, 3, 4, 6}; R { 3, 1, 2}12. {(–1, 3), (3, –6), (–1, –8), (–3, –7)}ANSWER:eSolutions Manual - Powered by CogneroPage 3
1-6 RelationsD { 1, 3, 4, 6}; R { 3, 1, 2}12. {(–1, 3), (3, –6), (–1, –8), (–3, –7)}ANSWER:D {–3, –1, 3}; R {–8, –7, –6, 3}13. {(6, 7), (3, –2), (8, 8), (–6, 2), (2, –6)}ANSWER:eSolutions Manual - Powered by CogneroPage 4
1-6 RelationsD {–3, –1, 3}; R {–8, –7, –6, 3}13. {(6, 7), (3, –2), (8, 8), (–6, 2), (2, –6)}ANSWER:D {–6, 2, 3, 6, 8}; R {–6, –2, 2, 7, 8}14. {(4, –3), (1, 3), (7, –2), (2, –2), (1, 5)}ANSWER:eSolutions Manual - Powered by CogneroPage 5
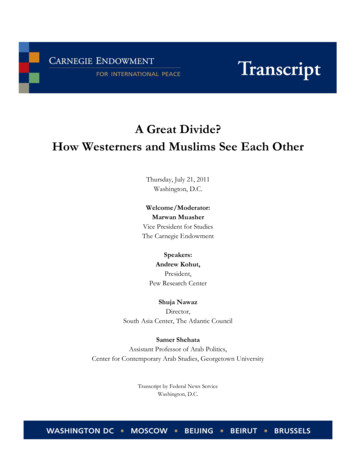
1-6 RelationsD {–6, 2, 3, 6, 8}; R {–6, –2, 2, 7, 8}14. {(4, –3), (1, 3), (7, –2), (2, –2), (1, 5)}ANSWER:D {1, 2, 4, 7}; R {–3, –2, 3, 5}Identify the independent and dependent variables for each relation.15. The Spanish classes are having a fiesta lunch. Each student that attends is to bring a Spanish side dish or dessert.The more students that attend, the more food there will be.ANSWER:I: the number of students who attend the fiesta; D: the amount of food that there will be at the fiesta16. The faster you drive your car, the longer it will take to come to a complete stop.ANSWER:I: the speed of the car; D: the length of time it takes to stop the carCCSS MODELING Describe what is happening in each graph.17. The graph represents the height of a bungee jumper.eSolutions Manual - Powered by CogneroPage 6
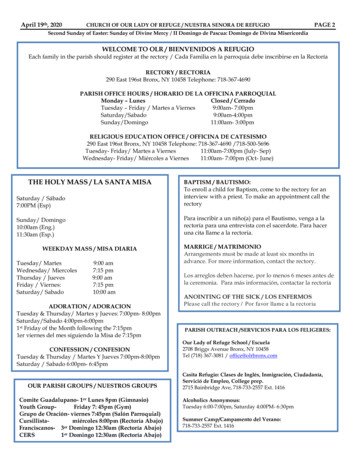
16. The faster you drive your car, the longer it will take to come to a complete stop.ANSWER:1-6 RelationsI: the speed of the car; D: the length of time it takes to stop the carCCSS MODELING Describe what is happening in each graph.17. The graph represents the height of a bungee jumper.ANSWER:The bungee jumper starts at the maximum height then jumps. After the initial jump, the jumper bounces up and downuntil coming to a rest.18. The graph represents the sales of lawn mowers.ANSWER:The positive slope of the first section of the graph indicates that lawn mower sales are increasing as time goes on.The next section of the graph is horizontal (zero slope) because sales are steady for that period of time.The next section of the graph has a steep positive slope showing that the rate of mower sales is quickly increasing.Then, the graph becomes horizontal as sales are high and steady. Finally, sales begin to quickly drop off as the graphtakes on a negative slope.The last section of the graph shows that sales continue to decrease, but at a slower rate. Sales continue to diminishuntil sales stop altogether at the end of the graph.CCSS MODELING Describe what is happening in each graph.19. The graph represents the value of a rare baseball card.ANSWER:The baseball card increases in value more rapidly over time.20. The graph represents the distance covered on an extended car ride.eSolutions Manual - Powered by CogneroPage 7
ANSWER:1-6 RelationsThe baseball card increases in value more rapidly over time.20. The graph represents the distance covered on an extended car ride.ANSWER:The graph shows the car moving, and then stopping, and then moving at a faster pace. The car stops a second timeand then continues moving.For Exercises 21–23, use the graph below.21. Name the ordered pair at point A and explain what it represents.ANSWER:(1, 5); The dog walker earns 5 for walking 1 dog.22. Name the ordered pair at point B and explain what it represents.ANSWER:(5, 25); The dog walker earns 25 for walking 5 dogs.23. Identify the independent and dependent variables for the relation.ANSWER:I: number of dogs walked; D: amount earnedFor Exercises 24–26, use the graph below.eSolutions Manual - Powered by CogneroPage 8
(5, 25); The dog walker earns 25 for walking 5 dogs.23. Identify the independent and dependent variables for the relation.ANSWER:1-6 RelationsI: number of dogs walked; D: amount earnedFor Exercises 24–26, use the graph below.24. Name the ordered pair at point C and explain what it represents.ANSWER:(3, 2); In the year 2003, sales were about 2 million.25. Name the ordered pair at point D and explain what it represents.ANSWER:(5, 6); In the year 2005, sales were about 6 million.26. Identify the independent and dependent variables.ANSWER:I: year; D: salesExpress each relation as a set of ordered pairs. Describe the domain and range.27.ANSWER:{(1, 2.50), (2, 4.50), (5, 10.50),(8, 16.50)}; D {1, 2, 5, 8}; R {2.50, 4.50, 10.50, 16.50}eSolutions Manual - Powered by Cognero28.ANSWER:Page 9
27.ANSWER:{(1, 2.50), (2, 4.50), (5, 10.50),1-6 Relations(8, 16.50)}; D {1, 2, 5, 8}; R {2.50, 4.50, 10.50, 16.50}28.ANSWER:{(–2, 3), (–1, 2), (0, –1), (1, –2), (2, 1)}; D {–2, –1, 0, 1, 2}; R {3, 2, –1, –2, 1}Express the relation in each table, mapping, or graph as a set of ordered pairs.29.ANSWER:{(4, –1), (8, 9), (–2, –6), (7, –3)}30.ANSWER:{(–5, 6), (–4, 9), (2, 1), (3, 9)}31.ANSWER:{(4, –2), (–1, 3), (–2, –1), (1, 4)}32. SPORTS In a triathlon, athletes swim 2.4 miles, bicycle 112 miles, and then run 26.2 miles. Their total time includestransition time from one activity to the next. Which graph best represents a participant in a triathlon? Explain.eSolutions Manual - Powered by CogneroPage 10
31.ANSWER:1-6 Relations{(4, –2), (–1, 3), (–2, –1), (1, 4)}32. SPORTS In a triathlon, athletes swim 2.4 miles, bicycle 112 miles, and then run 26.2 miles. Their total time includestransition time from one activity to the next. Which graph best represents a participant in a triathlon? Explain.ANSWER:Graph B; the graph indicates 2 stopping periods where the athlete prepared for the next event.Draw a graph to represent each situation.33. ANTIQUES A grandfather clock that is over 100 years old has increased in value from when it was firstpurchased.ANSWER:Sample answer:34. CAR A car depreciates in value. The value decreases quickly in the first few years.ANSWER:eSolutions Manual - Powered by CogneroPage 11
1-6 Relations34. CAR A car depreciates in value. The value decreases quickly in the first few years.ANSWER:35. REAL ESTATE A house typically increases in value over time.ANSWER:36. EXERCISE An athlete alternates between running and walking during a workout.ANSWER:eSolutions Manual - Powered by CogneroPage 12
EXERCISE An athlete alternates between running and walking during a workout. 16:(5 eSolutions Manual - Powered by Cognero Page 1 1-6 Relations. Express each relation as a table, a graph, and a mapping. Then determine t