Transcription
Guide to the 2018 ACT /SAT Concordance
What Is Concordance?The term “concordance” refers to establishing a relationship between scores on assessments that measuresimilar (but not identical) constructs. A technically sound concordance allows students and professionals tocompare scores from similar assessments to inform decisions. A concorded score is not a perfect predictionof how a student would perform on the other test.How Were the ACT/SAT Concordance Tables Developed?ACT and the College Board periodically produce ACT /SAT concordance tables to show how scores oneach test compare. With the redesign of the SAT in 2016, researchers from the College Board and ACT, incollaboration with the NCAA Technical Advisory Board, developed updated, technically sound concordancetables that will serve the needs of students and institutions going forward. The 2018 ACT/SAT concordancetables in this document are now the only official concordance tables and should be the single source ofreference moving forward when comparing SAT scores to ACT scores for students applying for terms afterfall 2018. These tables replace the concordance tables released in 2016.The concordance tables show ACT and SAT scores with the same percentile rank for a group of studentswho took both tests. The sample of students used to develop the concordance tables took the ACT test andthe new SAT test. For students who took the ACT and/or the SAT more than once, their ACT and SAT scoreswith the closest test dates were used. The tables were produced using data from 589,753 students who weregraduating seniors in 2017 and who took both the ACT and the new SAT tests between February 2016 (forthe ACT) or March 2016 (for the SAT) and June 2017. The sample was statistically weighted to reflect thedemographics, school attributes, and high school grade point average (GPA) of all students who are likely totake the ACT, SAT, or both tests.Which Concordance Tables Are Provided?The concordance tables are based on ACT and SAT tests that cover similar content and show a strongstatistical relationship between scores. A description of the content measured by the new SAT and the ACT isprovided in the Appendix. The table below lists the three sets of concordances.TablesSAT scoreSAT-to-ACT-ACT-to-SATACT CompositeSAT TotalTable A1Table A2ACT MathematicsSAT MathTable B1Table B2ACT English ReadingSAT ERWTable C1Table C2ACT scoreNote: Concordance tables for the ACT Composite were derived from concordances of the ACT sum score.Note: ERW Evidence-Based Reading and Writing.Tables are provided in both directions (ACT-to-SAT and SAT-to-ACT). Each ACT score is related to a range ofSAT scores (or vice versa). For users who want to concord an ACT score to a single SAT score point (or viceversa), the most appropriate score point within the range is also provided. 2018 The College Board, ACT, Inc.1
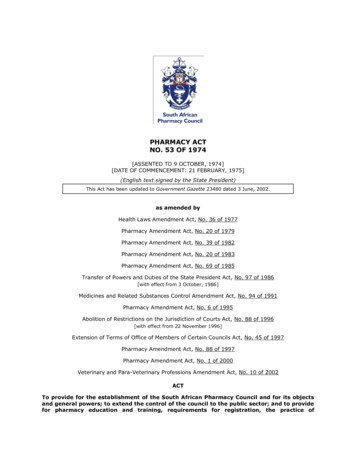
2018 Concordance TablesTable A1: SAT Total to ACT CompositeTable A2 : ACT Composite to SAT TotalSATACTSATACTSATACTACTSATSAT 7940176009*128027*93017*590912702792017126027*Use this SAT score when a single score point comparison is needed.Note: Concordance tables for the ACT Composite were derived from concordances of the ACT sum score. 2018 The College Board, ACT, Inc.2
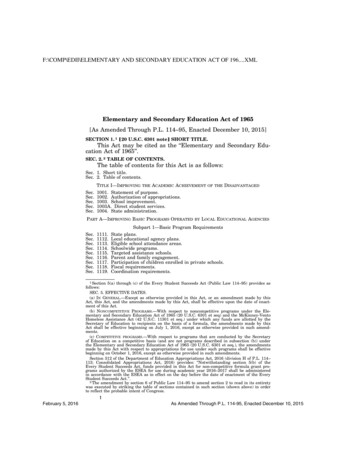
Table B1: SAT Math to ACT MathSATACT80036790SATTable B2 : ACT Math to SAT 5023112805402210260530215202051019*Use this SAT score when a single score point comparison is needed. 2018 The College Board, ACT, Inc.3
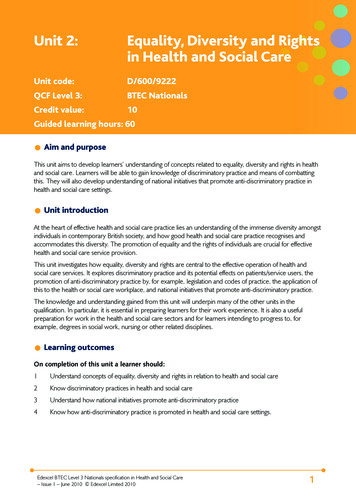
Table C1: SAT ERW to ACT English ReadingTable C2 : ACT English Reading to SAT ote: ERW Evidence-Based Reading and Writing.Note: ERW Evidence-Based Reading and Writing.ACT English Reading scores range from 2 to 72.ACT English Reading scores range from 2 to 72.*Use this SAT score when a single score point comparison is needed.*Use this ACT score when a single score point comparison is needed. 2018 The College Board, ACT, Inc.4
What Are the Potential Uses of Concordance Tables?A variety of stakeholders use concordance tables to compare scores across the ACT and the SAT to informpolicies, processes, and decisions. College counselors, students, and their families use concordance tables toinform college searches and explorations. Policymakers, researchers, and K–12 educators use concordancetables to aggregate scores across tests to measure college readiness for groups of students. Colleges,universities, scholarship organizations, and athletic conferences also use concordances in a variety of ways,including determining eligibility for a program or scholarship.§ Comparing SAT and ACT scores across different students. When scores from either test are accepted,concordance tables can help institutions or other stakeholders who need to compare scores.§ Establishing a policy using comparable scores from both tests. An institution, scholarship, orprogram may use a specific test score as one factor to establish eligibility.§ Converting scores for use in a predictive model or index. Many colleges and universities havebuilt indices or models to predict the likelihood that individual students will apply, enroll, or succeedacademically. These models typically include a variety of factors, including test scores, high school GPA,and course rigor. Institutions can apply the concordance tables in these prediction models.What Are the Key Considerations and Limitations When Using theConcordance Tables?Using SAT and ACT scores in a consistent, psychometrically appropriate way as one component of a holisticadmission process will help ensure all students are treated fairly in the admission process. While theconcordance tables can be used for a variety of purposes, higher education professionals should keep thefollowing considerations and limitations in mind:§ The ACT and the SAT are different tests. The ACT and the SAT measure similar, but not identical,content and skills. A concorded score is not a perfect prediction of how a student would perform on theother test. Concorded scores should be interpreted as the scores with the same rank within a group ofstudents who take the tests at approximately the same time.§ Concordances are used to compare individual scores, not aggregate scores. Users should avoidconverting aggregate scores (e.g., mean, median, ranges) using concordance tables, as this couldintroduce additional sources of error.§ Users should avoid making decisions based solely on a concorded score. Admission and enrollmentprofessionals should use multiple reliable and valid measures when making decisions to account for themany factors that impact academic performance in college.§ Note the prediction error (more details below). Users should consider this when using theconcordance tables to predict how a student would have performed on the ACT or the SAT.§ Concordances are sample-dependent. While concordance results can vary by sample, the ACT/SATconcordance sample was statistically weighted to more closely reflect the demographics, school attributes,and high school GPA of the population of students who take the ACT, SAT, or both tests.§ Institutions should not superscore across the SAT and ACT tests. Superscoring across 2 differenttests is an imprecise way of understanding whether a student meets a certain academic threshold.Combining scores from the ACT and the SAT in a single superscore is strongly discouraged. 2018 The College Board, ACT, Inc.5
Additional Notes and Technical SpecificationsLike all concordance tables, the ACT/SAT concordance tables are somewhat dependent on the sampleof students who took both tests. The concordance tables reported here were produced using data from589,753 students who were graduating seniors in 2017 and who took the ACT and the new SAT test betweenFebruary 2016 (for the ACT) or March 2016 (for the SAT) and June 2017. International students, students withdisabilities who tested with special accommodations, and students who took the ACT or SAT under stateor district testing programs were included. For students who took the ACT and/or the SAT more than once,their ACT and SAT scores from the closest test dates were used.To produce the concordance, statistical weighting procedures were used to accomplish two goals. Thefirst goal was to reflect the demographics, school attributes (size, locale, geographic region, public/privateaffiliation, and percentage eligible for free or reduced-price lunch), and high school GPA of the studentstaking the ACT only, the SAT only, or both tests (i.e., the entire population of test takers). The second goalwas to minimize the time between students’ ACT and SAT testing and also ensure the students who tookthe ACT before the SAT and the students who took the SAT before the ACT were counterbalanced. The ACTand SAT scores were linked using equipercentile methods on the weighted ACT and SAT score distributions.To the extent that the goals for the statistical weighting were accomplished, the concordance tables arerepresentative of graduating seniors who took either test or both tests.As mentioned above, concordance tables should not be expected to provide perfect predictions of astudent’s SAT score from their ACT score, or their ACT score from their SAT score. To convey the uncertaintiesassociated with use of the table for predicting SAT or ACT scores that are close in time, we provide errorintervals for the SAT and ACT scales. These error intervals reflect the variability of students’ ACT scores fromthe SAT-to-ACT concordance, and the variability of students’ SAT scores from the ACT-to-SAT concordance.The size of these error intervals depends on the correlation of the ACT and SAT scores and the reportingscale ranges of the ACT and the SAT.§ When using the SAT Total and ACT Composite concordance table to estimate a student’s proximalACT Composite score from their SAT Total score, the estimates in the table have a standard error ofapproximately 2.26 (2) ACT Composite score points on its 1–36 point scale. When using this table toestimate a student’s proximal SAT Total score from their ACT Composite score, the estimates have astandard error of approximately 79.57 (80) SAT Total score points on its 400–1600 point scale.§ When using the SAT Math and ACT Mathematics concordance table to estimate a student’s proximalACT Mathematics score from their SAT Math score, the estimates in the table have a standard error ofapproximately 2.65 (3) ACT Mathematics score points on its 1–36 point scale. When using this table toestimate a student’s proximal SAT Math score from their ACT Mathematics score, the estimates have astandard error of approximately 50.33 (50) SAT Math score points on its 200–800 point scale.§ When using the SAT ERW and ACT English Reading concordance table to estimate a student’s proximalACT English Reading score from their SAT ERW score, the estimates in the table have a standard errorof approximately 5.93 (6) ACT English Reading score points on its 2–72 point scale. When usingthis table to estimate a student’s proximal SAT ERW score from their ACT English Reading score, theestimates have a standard error of approximately 46.66 (50) SAT ERW score points on its 200–800point scale. 2018 The College Board, ACT, Inc.6
SAT and ACT Item Counts and TestContent DescriptionsContent experts at ACT and the College Board jointly agreed that the SAT Math Test and the ACTMathematics Test are sufficiently similar in what they are measuring to justify a concordance. An additionalcriterion for concordance is the strength of the relationship between two such measures: our researchdemonstrates that the correlation between ACT and SAT math scores for the concordance sample was 0.885,which met this criterion (i.e., a correlation of 0.866 or higher). The content similarity and score correlationsprovide sufficient evidence to support a concordance between the math tests.The experts at the two organizations also jointly agreed that the SAT Reading Test and SAT Writingand Language Test are sufficiently similar to the ACT Reading Test and the ACT English Test to justify aconcordance. The correlations between the combined tests, SAT Evidence-Based Reading and Writing andACT Reading and English, was 0.884.The table below provides the item counts for each of the concorded tests. Additional descriptions of thetest content for the SAT can be found at collegeboard.org/SATtestcontent. Additional descriptions of testcontent for the ACT can be found at act.org/theACTcontent.Item CountsACTConcorded ComponentsTotal/Composite*SATACT Composite Score is theaverage of the four ACT test scores(215 items total):SAT Total Score is basedon the three SAT test scores(154 items total):§ English Test§ Reading Test§ Reading Test§ Writing and Language Test§ Mathematics Test§ Math Test§ Science TestReading and Writing**ACT English Test (75 items)ACT Reading Test (40 items)SAT Evidence-Based Readingand Writing§ Reading Test (52 items)§ Writing and Language Test(44 items)MathACT Mathematics Test (60 items)SAT Math Test (58 items)*Concordance tables for the ACT Composite were derived from concordances of the ACT sum score (i.e., the sum of the English, Reading,Mathematics and Science Tests).**Does not include the optional ACT Writing Test or the optional SAT Essay 2018 The College Board, ACT, Inc.00989-0067
including determining eligibility for a program or scholarship. §Comparing SAT and ACT scores across different students. When scores from either test are accepted, concordance tables can help institutions or other stakeholders who need to compare scores. §Establishing a policy using comparable scores from both tests. An institution .