Transcription
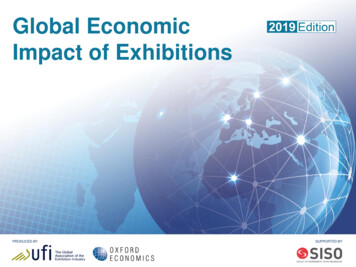
Global EconomicImpact of ExhibitionsPRODUCED BYSUPPORTED BY
UFI Research: An Analysing the global exhibition industrywith global comparisons.Regular market overviews on UFI‘schapter regions.Focused reports on challenges anddevelopments within the exhibition industry.Global Barometer – Bi-annual report onEuro Fair Statistics - Annual list ofindustry developments.certified data for Europe by country.Global Visitor Insights & GlobalExhibitor Insights - Data drivenWorld Map of Venues – Annual reportThe Trade Fair Industry in Asia –on trends in venue space and projectdevelopments globally.Annual analysis of market developments forAsia/Pacific by country.Economic Impact Study – Report onThe Exhibition Industry in MEA –the value of exhibitions globally andregionally.Overview of the exhibition market in the MEAregion.research reports on visitor feedback andexhibitor expectations.Best Practices Compendiums –Case studies of successful industrydevelopments.Global Digitisation Index –An overview tracking digitisationdevelopments within the industry.UFI Research Patron:Freeman is the world’s leading brand experience company. They help their clientsdesign, plan, and deliver immersive experiences for their most important audiences.Through comprehensive solutions including strategy, creative, logistics, digital solutions,and event technology, Freeman helps increase engagement and drive business results.What makes them different is their collaborative culture, intuitive knowledge, globalperspective, and personalized approach.UFI Research is available atwww.ufi.org/research
Table of contentsExecutive summary4Section 1: Exhibitions volume and direct spending8Section 2: Economic impact of exhibitions18Section 3: Methods28UFI Oxford Economics3
Executive summaryOverviewTo quantify the economic significance of exhibitions globally, OxfordEconomics has prepared a comprehensive model of global exhibitionsactivity that references recent studies on their economic significance.The results of this study show the scope of the global exhibition sectorin terms of direct spending and jobs, as well as the total impacts ofexhibitions in the broader economy.As part of this analysis, Oxford Economics took the following steps: Analysed existing data on exhibitions maintained by UFI, includingnet square meters sold, visitors, and exhibitors; Analysed historic data on the exhibition industry maintained byUFI and referenced published studies on exhibition impacts in 13countries, as well as third-party industry data across more than180 countries; Developed an econometric model of the relationship betweeneconomic and travel-industry data sets and exhibition industryimpacts to estimate exhibition activity in countries in which theexhibition industry has not been previously quantified; and Combined the results of existing studies and modeledrelationships to prepare global estimates. Previous country-levelanalyses of exhibitions activity accounted for more than threequarters of the estimated global total, providing a solid researchfoundation.UFI Oxford EconomicsThis document presents key elements of the research and findings.It is organized in four sections:1.2.3.4.Exhibition industry metrics and direct spendingEconomic impact analysisMethodsIndustry comparisonsIndividual country profile reports can be produced for UFI MemberAssociations and will be added as appendices to the global study.For more information, please contact Christian Druart, UFI’sResearch Manager (chris@ufi.org).4
Executive summaryWhat qualifies as an exhibition?What are the main components of economic impact?UFI follows the ISO 25639-1:2008 (E/F) definitions which are alsoadopted here. For the purposes of this study, an exhibition, show, orfair is an event in which products, services, or information aredisplayed and disseminated. Exhibitions differ from “conference”,“conventions” or “seminars”, or other business and consumer events.Exhibitions exclude flea markets and street markets. Exhibitionsinclude:Direct impacts consist of the direct spending and jobs that aredirectly involved in planning and producing exhibitions, and forparticipants and exhibitors to travel to exhibitions, as well as otherexhibition-related spending. Trade exhibitions: exhibitions that promotes trade and commerceand are attended primarily by trade visitors. A trade exhibition canbe opened to the public at specific times. Public exhibitions: exhibitions open primarily to general publicvisitors. A public exhibition is sometimes also known as aconsumer show.For more information about the methodology used for this study,please see page 29.UFI Oxford EconomicsIndirect impacts represent downstream supplier industry impacts,also referred to as supply chain impacts. For example, the facilitiesat which exhibitions occur require inputs such as energy and foodingredients. Also, many exhibition venues contract with specialisedservice providers, such as marketing, equipment upkeep, cleaning,technology support, accounting, and legal and financial services.These are examples of indirect impacts.Induced impacts occur as employees spend their wages andsalaries in the broader economy. For example, as hotel employeesspend money on rent, transportation, food and beverage, andentertainment.Impacts are expressed in terms of economic output, which includesall business sales, GDP (gross domestic product), which is definedas business sales less intermediate inputs, and jobs.5
Executive summaryDirect impacts of exhibitions (2018) Number of exhibitions, visitors & exhibitors: Approximately32,000 exhibitions directly involved 303 million visitors and nearlyfive million exhibitors across more than 180 countries. Direct spending (business sales): Exhibitions generated morethan 115.9 ( 136.9) billion of direct spending by visitors,exhibitors and additional exhibitions-related expenditures. Direct GDP (gross domestic product) and employment:Exhibitions supported 1.3 million direct jobs globally andgenerated 68.7 ( 81.1) billion of direct GDP. Based on approximately 4.5 million exhibitors worldwide and 115.9 ( 136.9) billion of direct spending, exhibitions generatednearly 25,600 ( 30,200) in direct spending per exhibitor on aglobal basis. Based on its 68.7 ( 81.1) billion direct GDP impact, theexhibitions sector would rank as the 72nd largest economyglobally.UFI Oxford EconomicsTotal impacts of global exhibitions (2018)After accounting for indirect and induced impacts, exhibitionssupported a total global economic impact in 2018 of: 275.1 ( 325.0) billion of output (business sales) 3.2 million jobs 167.2 ( 197.5) billion of GDP (representing contribution toglobal gross domestic product).Based on a total economic impact of 275.1 ( 325.0) billion and aglobal total of 34.68 million sqm of capacity (as reported in the UFIWorld Map of Exhibition Venues 2017), total output per sqm ofcapacity amounted to approximately 7,900 ( 9,400) in 2018.Global exhibitions directly generated more output (business sales)than many large global sectors, including machine tools and medical& surgical equipment.The 167.2 ( 197.5) billion of total GDP supported by the globalexhibitions sector would rank the sector as the 56th largest economyglobally, larger than the economies of countries such as Hungary,Kuwait, Sri Lanka, and Ecuador.6
Executive summaryTotal ImpactsDirect Impacts303 million visitors 275 ( 325) billion in total output(business sales)across more than 180 countries including direct, indirect, and induced output 116 ( 137) billion in directspending (business sales) 167 ( 198) billion in total GDP including direct, indirect, and induced GDP impactsrepresenting spending to plan and produceexhibitions, exhibitions-related travel, and otherdirect spending, such as spending by visitors andexhibitors Indirect &Induced Impacts3.2 million total jobs 69 ( 81) billion in direct GDP (gross domestic product)directly and indirectly supported byglobal exhibitions1.3 million jobs 60,700 ( 71,700) of total impactper exhibiting companydirectly supported by exhibitions globally 7,900 total impact per sqm ( 870 per sqf)of venue gross indoor exhibition spaceUFI Oxford Economics7
1. Exhibitions volume and direct spending
Overview of exhibitionsvolume and directspendingThis section summarises the size and scope of exhibitions sectoractivity worldwide. The primary measures presented are: Amount of exhibitions direct spendingSpace sold (net square meters)Number of visitors and exhibitorsNumber of exhibitions direct jobsDefinition of an exhibitionUFI follows the ISO 25639-1:2008 (E/F) definitions which are alsoadopted here. For the purposes of this study, an exhibition, show,or fair is an event in which products, services, or information aredisplayedand disseminated. Exhibitions differ from “conference”,North“conventions”America or “seminars”, or other business and consumerAsia/events. Exhibitions exclude flea markets and street markets.PacificExhibitions include:AfricaExhibition data on space sold, visitors, and exhibitors was provided byUFI. Data on estimated exhibitions direct spending is based oneconometric modeling by Oxford Economics. Trade exhibitions: exhibitions that promotes trade andcommerceand are attended primarily by trade visitors. A tradeCentralexhibition&canbe opened to the public at specific times.SouthExhibitions direct spending represents spending directly incurred inthe planning and production of exhibitions, travel to exhibitions, andaccompanying exhibitions-related activities. As a basic description thisincludes spending by participants to attend the exhibition (e.g. traveland registration), organiser-paid travel, spending by exhibitors (e.g.sponsorships, exhibit production, off-site events), spending byexhibition organisers and hosts, and certain other exhibitions-relatedspending. Public exhibitions: exhibitions open primarily to general publicvisitors. A public exhibition is sometimes also known as aconsumer show.Exhibitions direct spending provides the clearest measure of theeconomic significance of exhibitions because it captures the full scopeof services and goods directly provided by a range of industries. Forthis reason, much of our summary analysis focuses on exhibitionsdirect spending and the number of exhibitions participants.AmericaRegions of analysisExhibition data, estimates of direct spending, and overall impactswere analyzed at the regional and global levels. The map on thefollowing page provides a breakdown of the regions included in thestudy: Africa Asia/Pacific Central & South America Europe Middle East North AmericaUFI Oxford Economics9
Map of sia/PacificAsia/PacificCentral& SouthAmericaCentral& SouthAmericaNOTE: Russia can be considered as both in Europe (West of theOural mountains) and Asia (rest of the country). As a large part of thenational activity is concentrated in the Western part of the country,Russia is considered as in Europe for the purpose of this study.UFI Oxford Economics10
Exhibitionssummary dataExhibitions generated 115.9 billion ofdirect spending and sold nearly 138 millionnet square meters in 2018.Summary of exhibitions activity, 2018In 2018, approximately 32,000 exhibitions sold nearly 138 millionnet square meters (1.5 billion square feet) across more than 180countries. Exhibitions generated nearly 116.0 ( 136.9) billion ofdirect spending, by visitors, exhibitors and additional exhibitionsrelated expenditure. North America and Europe ranked first andsecond in direct spending, representing 44% and 34% of totalglobal direct spending in 2018, respectively.Exhibitions welcomed nearly 303 million visitors and 4.5 millionexhibitors in 2018. Europe ranked first in terms of total visitors with112.0 million visitors and 1.3 million exhibitors. North Americafollowed with 91.2 million visitors and 1.6 million exhibitors.Space sold(net sq.meters,millions)Direct spendingShare of total(billionsEuros)(billionsUS )DirectspendingSpacesold137.5 115.9 136.9100.0%100.0%North America48.0 50.6 59.743.6%34.9%Europe46.5 39.5 46.734.1%33.8%Asia/Pacific33.8 22.4 26.419.3%24.6%Central & South America5.2 1.8 2.21.6%3.8%Middle East3.0 1.2 1.41.0%2.2%Africa1.0 0.4 0.50.4%0.7%Global totalBy regionShare of totalVisitors(000's)Global 34100.0%100.0%By regionEuropeUFI Oxford Economics112,0001,34037.0%29.6%North 026.9%26.7%Central & South America9,9002173.3%4.8%Middle East6,2501252.1%2.8%Africa2,100420.7%0.9%Source: Oxford Economics & UFI (2019)11
Exhibitionsdirect spendingExhibitions in North America generated 50.6 ( 59.7) billion ofexhibitions direct spending in 2018, as shown in the accompanyingchart, representing 43.6% of global exhibitions direct spending.Exhibitions in Europe and Asia/Pacific generated 39.5 ( 46.7)billion and 22.4 ( 26.4) billion in direct spending, representing34.1% and 19.3% of global direct spending, respectively.North America and Europe are the topregions in terms of exhibitions directspending.Exhibitions direct spending by regionIn billions, Euros, 2018 50.6 39.5 22.4 1.8NorthAmericaEurope1.6% 1.2Asia/Pacific Central & Middle EastSouthAmerica1.0% 0.4% 0.4AfricaNorth AmericaEurope19.3%Asia/Pacific43.6%Central & SouthAmerica34.1%Middle EastAfricaSource: Oxford Economics (2019)UFI Oxford Economics12
ExhibitionsvisitorsEurope was the largest market in terms of exhibition participants,hosting 112.0 million visitors, representing more than one-third oftotal visitors worldwide in 2018. North America ranked second,hosting 91.2 million visitors (30.1% of worldwide visitors) in 2018.Asia/Pacific ranked third with 81.5 million visitors, representing26.9% of global visitors. Central & South America, the Middle East,and Africa followed, each hosting less than 10 million exhibitionvisitors in 2018.In terms of number of participants, Europerepresents the largest region.Exhibitions visitors by regionIn millions, c2.1% 0.7%9.96.32.1Central &SouthAmericaMiddleEastAfricaEuropeNorth America37.0%26.9%Asia/PacificCentral & SouthAmericaMiddle East30.1%AfricaSource: UFI (2019)UFI Oxford Economics13
ExhibitionsexhibitorsNorth America was the largest market in terms of exhibitionexhibitors, hosting 1.6 million exhibitors, representing more than35% of total exhibitors worldwide. Europe ranked second, hosting1.3 million exhibitors (29.6% of worldwide visitors) in 2018.Asia/Pacific ranked third with 1.2 million exhibitors, representing26.7% of global exhibitors. Central & South America, the MiddleEast, and Africa followed, each hosting less than 250,000 exhibitorsin 2018.In terms of number of exhibitors, NorthAmerica represents the largest region with1.6 million exhibitors in 2018.Exhibitions exhibitors by regionIn millions, ific2.8% 0.9%0.13Central & Middle EastSouthAmerica0.04AfricaNorth AmericaEurope35.3%Asia/Pacific26.7%Central & SouthAmericaMiddle East29.6%AfricaSource: UFI (2019)UFI Oxford Economics14
Exhibitionsdirect GDP and jobsimpactExhibitions generated 68.7 billion of directGDP and more than 1.3 million direct jobsin 2018.Exhibitions generated 68.7 ( 81.1) billion of direct GDP and morethan 1.3 million direct jobs in 2018. Approximately 0.5 million of thedirect jobs are maintained by the exhibitions industry alone.Exhibitions in North America generated 32.5 ( 38.4) billion indirect GDP, representing 47.4% of global exhibitions GDP. NorthAmerica is also the largest market in terms of jobs, with 539,000direct jobs.Exhibitions direct GDP and jobs impact by regionEurope ranks second in terms of direct GDP impact, with 20.0( 23.6) billion in GDP, supporting 358,000 direct jobs. Asia/Pacificranked third with 14.1 ( 16.7) billion in direct GDP, supporting356,000 direct jobs.By regionShare of direct GDP impacts by region1.7% 0.9% 0.4%North AmericaGlobal totalDirect spendingDirect GDP(billions (billionsEuros)US )(billions (billionsEuros)US ) 115.9 136.9Directjobs(000s) 68.7 81.11,314Share of totalDirectspendingDirectGDP100.0% 100.0% 100.0%North America 50.6 59.7 32.5 38.453943.6%47.4%41.1%Europe 39.5 46.7 20.0 23.635834.1%29.1%27.3%Asia/Pacific 22.4 26.4 14.1 16.735619.3%20.5%27.1%Central & South America 1.8 2.2 1.2 1.4381.6%1.7%2.9%Middle East 1.2 1.4 0.6 0.8141.0%0.9%1.1%Africa 0.4 0.5 0.3 0.380.4%0.4%0.6%Source: Oxford Economics (2019)Europe20.5%Asia/Pacific47.4%Central & SouthAmerica29.1%Middle EastAfricaUFI Oxford EconomicsDirectjobs15
Exhibitionsdirect spending perexhibitorExhibitions generated 115.9 ( 136.9) billion of direct spending in2018. Based on a global total of 4.5 million exhibitors in 2018,direct spending per exhibitor amounted to 25,569 ( 30,201).North America ranked first with 31,601 ( 37,325) in directspending per exhibitor. Europe and Asia/Pacific followed with 29,512 ( 34,858) and 18,482 ( 21,830) in direct spending perexhibitor, respectively.Exhibitions generated approximately 25,600 ( 30,200) in direct spending perexhibitor on a global basis in 2018.Exhibitions direct spending per exhibitorDirect spendingDirect spendingper exhibitor(billionsEuros)(billionsUS )(Euros)(US )4,534 115.9 136.9 25,569 30,201North America1,600 50.6 59.7 31,601 37,325Europe1,340 39.5 46.7 29,512 34,858Asia/Pacific1,210 22.4 26.4 18,482 21,830Central & South America217 1.8 2.2 8,433 9,961Middle East125 1.2 1.4 9,461 11,17442 0.4 0.5 10,663 12,594Exhibitors(000's)Global totalBy regionAfricaIn Euros, 2018 31,601 29,512 18,482 10,663NorthAmericaEuropeAsia/PacificAfrica 9,461 8,433Middle East Central &SouthAmericaSource: Oxford Economics & UFI (2019)UFI Oxford Economics16
Exhibitions directspending per squaremeter of venue capacityExhibitions generated 115.9 ( 136.9) billion of direct spending in2018. Based on a global total of 34.68 million square meters ofvenue capacity measured in terms of gross indoor exhibition space(as reported in the UFI World Map of Exhibition Venues), directspending per square meter of venue capacity amounted to 3,343( 3,948).North America ranked first with 6,189 ( 7,310) in direct spendingper square meter of venue capacity. Asia/Pacific and Europefollowed with 2,717 ( 3,210) and 2,519 ( 2,975) in directspending per square meter of venue capacity, respectively.Exhibitions generated 3,300 ( 3,900) indirect spending per square meter of venuecapacity on a global basis in 2018.Exhibitions direct spending per square meter of capacityDirect spendingDirect spendingper squaremeter ofcapacity(billions (billionsEuros)US )(Euros)373.29 115.9 136.9 3,343 3,948 311 367Capacity Capacity(million (millionsquare squaremeters)feet)Global total34.68Direct spendingper square footof capacity(US ) (Euros) (US )By region8.1787.94 50.6 59.7 6,189 7,310 575 67915.70168.99 39.5 46.7 2,519 2,975 234 276Asia/Pacific8.2388.59 22.4 26.4 2,717 3,210 252 298Central & South America1.2012.92 1.8 2.2 1,525 1,801 142 167Middle East0.859.15 1.2 1.4 1,391 1,643 129 153Africa0.535.70 0.4 0.5 78 93North AmericaEurope 845 998In Euros, 2018 6,189 2,717NorthAmericaUFI Oxford EconomicsAsia/Pacific 2,519EuropeSource: Oxford Economics & UFI (2019) 1,525 1,391Central & Middle EastSouthAmerica 845Africa17
2. Economic impact of exhibitions
Economic impactapproachOur analysis of exhibitions direct spending served as an input for theeconomic impact model we used to estimate exhibitions-sector directemployment and labor income, and the downstream impacts of thesector. This model is also referred to as an input-output (I-O) model.Components of economic impact analysisThere are three main components of a sector’s overall economicimpact: Direct impacts consist of the direct spending and jobs that areinvolved in planning and producing exhibitions, and for participantsto travel to exhibitions, as well as other exhibitions-relatedspending. Given the characteristics of the exhibitions sector, muchof this direct activity occurs across a variety of sectors. Forexample, the production of an exhibition frequently involvesemployees onsite at a hotel or other venue, including banquet staffas well as audio-visual/staging and technical staff, and other thirdparty contracted service providers, such asentertainment/production services, décor, speakers and trainers,advertising and promotion. These employees all represent directjobs supported by the exhibitions sector. Meanwhile, participants’travel to the exhibition, and accommodation during the event,supports direct spending and jobs across a range of serviceproviders in the travel sector. Though this spending is occurringacross businesses in a range of industry sectors, it all representsactivity that is supported by exhibitions direct spending, and is partof the exhibition sector’s direct impacts.UFI Oxford Economics Indirect impacts represent downstream supplier industryimpacts, also referred to as supply chain impacts. For example,the facilities at which exhibitions occur require inputs such asenergy and food ingredients. Also, many exhibition venuescontract with specialized service providers, such as marketing,equipment upkeep, cleaning, technology support, accounting, andlegal and financial services. These are examples of indirectimpacts. Induced impacts occur as employees spend their wages andsalaries in the broader economy. For example, as hotelemployees spend money on rent, transportation, food andbeverage, and entertainment.Indirect and induced impacts may also be referred to collectively asindirect effects.To conduct the impact analysis, we used country-level economicimpact multipliers from the existing exhibitions impact studies. Forcountries where exhibitions impact multipliers were either unavailableor appeared inconsistent with reference data, we used travel andtourism multipliers maintained by WTTC (World Travel and TourismCouncil) and Oxford Economics. WTTC multipliers are based oninput-output tables for each country and were sourced from either theOECD (Organisation for Economic Co-operation and Development),or when not available, national statistical offices. From the input-outputtables, multiplier matrices were developed for each economy, detailingthe flow of spending in an economy that occurs as a consequence ofspending in a given industry.19
Economic impactsOverall, the total global economic impact of the exhibitions sector in2018 is summarized as follows:The global exhibitions sector supportedmore than 275.1 ( 325.0) billion of totaloutput (business sales) in 2018.Exhibitions sector global economic impactsAmounts in billions of euros and billions of US dollars, except jobs 275.1 ( 325.0) billion of economic output (business sales) 167.2 ( 197.5) billion in total GDP contribution; and More than 3.2 million total jobs.These totals represent the combination of direct impacts within theexhibitions sector (e.g. 115.9 ( 136.9) billion of exhibitions directspending, and 1.3 million direct jobs), plus the estimated indirect andinduced effects.The resulting output multiplier for the exhibitions sector is 2.37,implying that each 1.00 ( 1.00) in direct exhibition spendinggenerates an additional 1.37 ( 1.37) in indirect and inducedexpenditures in the global economy.2018(Euros & jobs)2018(US & jobs) 115,9 136,9Direct exhibitions sector im pactOutput (exhibitions direct spending)EmploymentGDP1,314,0001,314,000 68,7 81,1 275,1 325,0Total exhibitions sector im pactOutputEmploymentGDP3,240,000 167,23,240,000 197,5Source: Oxford Economics (2019)UFI Oxford Economics20
Economic impacts byregion – total outputExhibitions in North America generated 118.8 ( 140.4) billion oftotal output in 2018, as shown in the accompanying chart,representing 43.2% of the total output impact of the globalexhibitions sector. Exhibitions in Europe and Asia/Pacificgenerated 92.3 billion ( 109.0) and 56.6 ( 66.8) billion in directspending, representing 33.5% and 20.6% of the sector’s globaloutput impact.North America and Europe are the topregions in terms of total output impacts.Economic impacts by region – total output impactsIn billions, Euros, 2018 118.83 92.27 56.58 4.12NorthAmericaEuropeAsia/Pacific 2.39Central & Middle EastSouthAmerica1.5% 0.9% 0.3% 0.94AfricaNorth AmericaEurope20.6%Asia/Pacific43.2%Central & SouthAmericaMiddle East33.5%AfricaSource: Oxford Economics (2019)UFI Oxford Economics21
Economic impactsby region – total GDPExhibitions in North America generated 78.2 ( 92.3) billion of totalGDP in 2018, as shown in the accompanying chart, representing46.8% of the global exhibitions sector’s total GDP impact.Exhibitions in Europe and Asia/Pacific generated 48.6 ( 57.3)billion and 36.0 ( 42.6) billion in direct spending, representing29.0% and 21.5% of the sector’s total GDP impact, respectively.The global exhibitions sector supportedmore than 167.2 ( 197.5) billion of totalGDP in 2018.Economic impacts by region – total GDP impactsIn billions, Euros, 2018 78.17 48.55NorthAmericaEurope 36.03Asia/Pacific1.6% 0.7% 0.3% 2.74 1.17 0.54Central &SouthAmericaMiddle EastAfricaNorth AmericaEurope21.5%Asia/Pacific46.8%Central & SouthAmericaMiddle East29.0%AfricaSource: Oxford Economics (2019)UFI Oxford Economics22
Economic impacts byregion – total employmentExhibitions in North America generated more than 1.3 million totaljobs in 2018, as shown in the accompanying chart, representing40.2% of the global exhibitions sector’s total job impact. Exhibitionsin Asia/Pacific and Europe generated 980,000 and 824,000 totaljobs, representing 30.2% and 25.4% of the sector’s total job impact,respectively.The global exhibitions sector supportedmore than 3.2 million total jobs in 2018.Economic impacts by region – total job impactsIn thousands of 9Central &SouthAmericaMiddle EastAfrica2.6% 1.0% 0.6%North AmericaAsia/Pacific25.4%40.2%EuropeCentral & SouthAmericaMiddle East30.2%AfricaSource: Oxford Economics (2019)UFI Oxford Economics23
Economic impacts:total output per exhibitorExhibitions generated 275.1 ( 325.0) billion of total output (totalbusiness sales) in 2018. Based on a global total of 4.5 millionexhibitors in 2018, total output per exhibitor amounted to 60,680( 71,671).North America ranked first with 74,268 ( 87,720) in total outputper exhibitor. Europe and Asia/Pacific followed with 68,858( 81,331) and 46,757 ( 55,227) in total output per exhibitor,respectively.Exhibitions generated approximately 60,700 ( 71,700) in total output perexhibitor on a global basis in 2018.Exhibitions total output per exhibitorTotal outputper exhibitorTotal outputExhibitors(000's)(billions (billionsEuros)US )(Euros)(US )4,534 275.1 325.0 60,680 71,671North America1,600 118.8 140.4 74,268 87,720Europe1,340 92.3 109.0 68,858 81,331Asia/Pacific1,210 56.6 66.8 46,757 55,227Central & South America217 4.1 4.9 18,989 22,428Middle East125 2.4 2.8 19,104 22,56442 0.9 1.1 22,362 26,412Global totalBy regionAfricaIn Euros, 2018 74,268 68,858 46,757 22,362NorthAmericaEuropeAsia/PacificAfrica 19,104 18,989Middle East Central &SouthAmericaSource: Oxford Economics & UFI (2019)UFI Oxford Economics24
Economic impacts:total output per squaremeter of venue capacityExhibitions generated 275.1 ( 325.0) billion of total output (totalbusiness sales) in 2018. Based on a global total of 34.68 millionsquare meters (373.29 million square feet) of venue capacitymeasured in terms of gross indoor exhibition space (as reported inthe UFI World Map of Exhibition Venues 2017), total output persquare meter of venue capacity amounted to approximately 7,900( 9,400), while total output per square foot of venue capacityamounted to approximately 740 ( 870) .North America ranked first with 14,544 ( 17,179) in total outputper square meter of venue capacity and 1,351 ( 1,596) per squarefoot of venue capacity . Asia/Pacific followed with 6,874 ( 8,120)in total output per square meter of venue capacity and 639 ( 754)per square foot of venue capacity.Exhibitions generated approximately 7,900 ( 9,400) in total output per squaremeter of capacity and 740 ( 870) persquare foot of capacity on a global basis in2018.Exhibitions total output per sqm of capacityCapacity Capacity Total output(million (millionsquare square (billions (billionsUS )meters)feet) Euros)Global total34.68373.29 275.1 325.08.1787.94 118.8 140.4Total output persquare meter ofcapacityTotal output persquare foot ofcapacity(Euros)(US )(Euros)(US ) 7,933 9,370 737 871By regionNorth America 14,544 17,179 1,351 1,59615.70168.99 92.3 109.0 5,877 6,942 546 645Asia/Pacific8.2388.59 56.6 66.8 6,874 8,120 639 754Central & South America1.2012.92 4.1 4.9 3,434 4,056 319 377Middle East0.859.15 2.4 2.8 2,809 3,318 261 308Africa0.535.70 0.9 1.1 1,772 2,093 165 194EuropeIn Euros, 2018 14,544 6,874NorthAmericaAsia/Pacific 5,877Europe 3,434 2,809Central & Middle EastSouthAmerica 1,772AfricaSource: Oxford Economics & UFI (2019)UFI Oxford Economics25
Global exhibitionsimpact rankingThe global exhibitions sector’s total GDPimpact would rank it as the 56th largesteconomy globally.The global exhibitions sector directly generated more output(business sales) than many large global sectors, including machinetools and medical & surgical equipment.The 167.2 ( 197.5) billion of total GDP supported by exhibitionsglobally would rank the sector as the 56th largest economy globally,larger than the economies of countries such as Hungary, Kuwait,Sri Lanka, and Ecuador. The table on the following page comparesthe global exhibitions sector
The Exhibition Industry in MEA - Overview of the exhibition market in the MEA region. UFI Research Patron: Freeman is the world's leading brand experience company. They help their clients design, plan, and deliver immersive experiences for their most important audiences.