Transcription
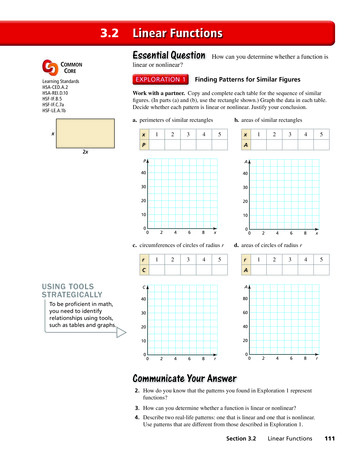
3.2Linear FunctionsEssential QuestionCOMMONCOREHow can you determine whether a function islinear or nonlinear?Finding Patterns for Similar FiguresLearning .7aHSF-LE.A.1bWork with a partner. Copy and complete each table for the sequence of similarfigures. (In parts (a) and (b), use the rectangle shown.) Graph the data in each table.Decide whether each pattern is linear or nonlinear. Justify your conclusion.a. perimeters of similar rectanglesxx123b. areas of similar c. circumferences of circles of radius rrUSING TOOLSSTRATEGICALLYTo be proficient in math,you need to identifyrelationships using tools,such as tables and graphs.1234r5ACA40803060204010200246824xd. areas of circles of radius rC000r1022434685rCommunicate Your Answer2. How do you know that the patterns you found in Exploration 1 representfunctions?3. How can you determine whether a function is linear or nonlinear?4. Describe two real-life patterns: one that is linear and one that is nonlinear.Use patterns that are different from those described in Exploration 1.Section 3.2Linear Functions111
3.2 LessonWhat You Will LearnIdentify linear functions using graphs, tables, and equations.Graph linear functions using discrete and continuous data.Core VocabulVocabularylarryWrite real-life problems to fit data.linear equation intwo variables, p. 112linear function, p. 112nonlinear function, p. 112solution of a linear equationin two variables, p. 114discrete domain, p. 114continuous domain, p. 114Identifying Linear FunctionsA linear equation in two variables, x and y, is an equation that can be written inthe form y mx b, where m and b are constants. The graph of a linear equation isa line. Likewise, a linear function is a function whose graph is a nonvertical line.A linear function has a constant rate of change and can be represented by a linearequation in two variables. A nonlinear function does not have a constant rate ofchange. So, its graph is not a line.Previouswhole numberIdentifying Linear Functions Using GraphsDoes the graph represent a linear or nonlinear function? Explain.a.3b.y3y11 2 2x2x2 3 3SOLUTIONa. The graph is not a line.b. The graph is a line.So, the function is nonlinear.So, the function is linear.Identifying Linear Functions Using TablesDoes the table represent a linear or nonlinear function? Explain.a.x36912y36302418b.x1357y292035SOLUTION 3 3a.REMEMBERA constant rate of changedescribes a quantity thatchanges by equal amountsover equal intervals. 3x36912y36302418 6 6 2 2 6As x increases by 3, y decreases by6. The rate of change is constant.b. 2x1357y292035 7 11 15As x increases by 2, y increases bydifferent amounts. The rate of changeis not constant.So, the function is linear.So, the function is nonlinear.112Chapter 3Graphing Linear Functions
Monitoring ProgressHelp in English and Spanish at BigIdeasMath.comDoes the graph or table represent a linear or nonlinear function? Explain.1.2.y3y21 2 2x2x2 2 33.x0123y35794.x1234y16842Identifying Linear Functions Using EquationsWhich of the following equations represent linear functions? Explain.2—y 3.8, y x , y 3x, y —, y 6(x 1), and x 2 y 0xSOLUTION2—You cannot rewrite the equations y x , y 3x, y —, and x 2 y 0 in the formxy mx b. So, these equations cannot represent linear functions.You can rewrite the equation y 3.8 as y 0x 3.8 and the equationy 6(x 1) as y 6x 6. So, they represent linear functions.Monitoring ProgressHelp in English and Spanish at BigIdeasMath.comDoes the equation represent a linear or nonlinear function? Explain.3x55. y x 96. y —7. y 5 2x 2Concept SummaryRepresentations of FunctionsWords An output is 3 more than the input.Equationy x 3Input-Output TableInput, xOutput, y 12031425Mapping DiagramInput, xOutput, y 10122345Graph642 2Section 3.2y2Linear Functions4 x113
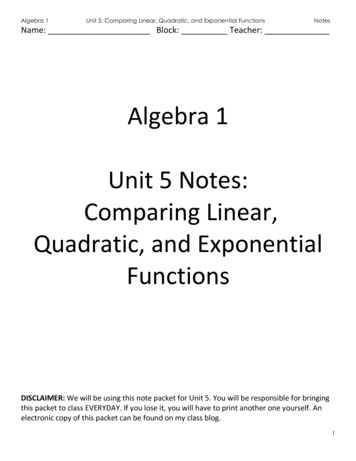
Graphing Linear FunctionsA solution of a linear equation in two variables is an ordered pair (x, y) that makesthe equation true. The graph of a linear equation in two variables is the set of points(x, y) in a coordinate plane that represents all solutions of the equation. Sometimesthe points are distinct, and other times the points are connected.Core ConceptDiscrete and Continuous DomainsA discrete domain is a set of input values that consists of only certain numbersin an interval.Example: Integers from 1 to 5 2 10123456A continuous domain is a set of input values that consists of all numbers inan interval.Example: All numbers from 1 to 5 2 10123456Graphing Discrete DataThe linear function y 15.95x represents the cost y (in dollars) of x tickets for amuseum. Each customer can buy a maximum of four tickets.STUDY TIPa. Find the domain of the function. Is the domain discrete or continuous? Explain.The domain of a functiondepends on the real-lifecontext of the function,not just the equation thatrepresents the function.b. Graph the function using its domain.SOLUTIONa. You cannot buy part of a ticket, only a certain number of tickets. Becausex represents the number of tickets, it must be a whole number. The maximumnumber of tickets a customer can buy is four.So, the domain is 0, 1, 2, 3, and 4, and it is discrete.b. Step 1 Make an input-output table to find the ordered pairs.Cost (dollars)Museum Ticketsy706050403020100(4, 63.8)(3, 47.85)(2, 31.9)(1, 15.95)(0, 0)0 1 2 3 4 5 6 xNumber of ticketsInput, x15.95xOutput, y(x, y)015.95(0)0(0, 0)115.95(1)15.95(1, 15.95)215.95(2)31.9(2, 31.9)315.95(3)47.85(3, 47.85)415.95(4)63.8(4, 63.8)Step 2 Plot the ordered pairs. The domain is discrete. So, the graph consists ofindividual points.Monitoring ProgressHelp in English and Spanish at BigIdeasMath.com8. The linear function m 50 9d represents the amount m (in dollars) of moneyyou have after buying d DVDs. (a) Find the domain of the function. Is the domaindiscrete or continuous? Explain. (b) Graph the function using its domain.114Chapter 3Graphing Linear Functions
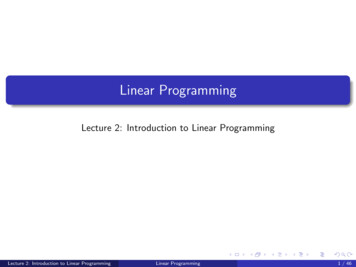
Graphing Continuous DataA cereal bar contains 130 calories. The number c of calories consumed is a functionof the number b of bars eaten.a. Does this situation represent a linear function? Explain.b. Find the domain of the function. Is the domain discrete or continuous? Explain.STUDY TIPWhen the domain ofa linear function is notspecified or cannot beobtained from a real-lifecontext, it is understoodto be all real numbers.c. Graph the function using its domain.SOLUTIONa. As b increases by 1, c increases by 130. The rate of change is constant.So, this situation represents a linear function.b. You can eat part of a cereal bar. The number b of bars eaten can be any valuegreater than or equal to 0.So, the domain is b 0, and it is continuous.c. Step 1 Make an input-output table to find ordered pairs.Calories consumedCereal Bar Caloriesc7006005004003002001000(4, 520)(3, 390)(2, 260)(1, 130)(0, 0)0 1 2 3 4 5 6bNumber ofbars eatenInput, bOutput, c(b, c)00(0, 0)1130(1, 130)2260(2, 260)3390(3, 390)4520(4, 520)Step 2 Plot the ordered pairs.Step 3 Draw a line through the points. The line should start at (0, 0) and continueto the right. Use an arrow to indicate that the line continues without end,as shown. The domain is continuous. So, the graph is a line with a domainof b 0.Monitoring ProgressHelp in English and Spanish at BigIdeasMath.com9. Is the domain discrete or continuous? Explain.InputNumber of stories, x123OutputHeight of building (feet), y12243610. A 20-gallon bathtub is draining at a rate of 2.5 gallons per minute. The number gof gallons remaining is a function of the number m of minutes.a. Does this situation represent a linear function? Explain.b. Find the domain of the function. Is the domain discrete or continuous?Explain.c. Graph the function using its domain.Section 3.2Linear Functions115
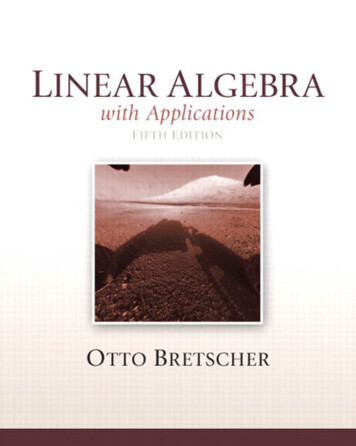
Writing Real-Life ProblemsWriting Real-Life ProblemsWrite a real-life problem to fit the data shown in each graph. Is the domain of eachfunction discrete or continuous? Explain.a.b.y8866442242y428 x68 x6SOLUTIONa. You want to think of a real-life situation in which there are two variables, x and y.Using the graph, notice that the sum of the variables is always 6, and the value ofeach variable must be a whole number from 0 to 6.x0123456y6543210Discrete domainOne possibility is two people bidding against each other on six coins at anauction. Each coin will be purchased by one of the two people. Because it isnot possible to purchase part of a coin, the domain is discrete.b. You want to think of a real-life situation in which there are two variables, x and y.Using the graph, notice that the sum of the variables is always 6, and the value ofeach variable can be any real number from 0 to 6.x y 6ory x 6Continuous domainOne possibility is two people bidding against each other on 6 ounces of golddust at an auction. All the dust will be purchased by the two people. Because itis possible to purchase any portion of the dust, the domain is continuous.Monitoring ProgressHelp in English and Spanish at BigIdeasMath.comWrite a real-life problem to fit the data shown in the graph. Is the domain ofthe function discrete or continuous? Explain.11.8y12.6644222116Chapter 38Graphing Linear Functions468 xy2468 x
Exercises3.2Dynamic Solutions available at BigIdeasMath.comVocabulary and Core Conceptp Check1. COMPLETE THE SENTENCE A linear equation in two variables is an equation that can be writtenin the form , where m and b are constants.2. VOCABULARY Compare linear functions and nonlinear functions.3. VOCABULARY Compare discrete domains and continuous domains.4. WRITING How can you tell whether a graph shows a discrete domain or a continuous domain?Monitoring Progress and Modeling with Mathematics13.In Exercises 5–10, determine whether the graphrepresents a linear or nonlinear function. Explain.(See Example 1.)5.6.y3y14.2 22 3x 1 27.3x8.32y15.1 22 2x 21216y161271x 1012y35205 102x 26y2 2x2468y41664256 4 4As x increases by 2, y increasesby a constant factor of 4. So,the function is linear.4x2 3246xIn Exercises 11–14, determine whether the tablerepresents a linear or nonlinear function. Explain.(See Example 2.)x1234y5101520x57911y 9 3 1316. y2 22x 2The graph is a line. So, the graphrepresents a linear function.Section 3.2HSCC Alg1 PE 03.02.indd 117 2 410.y 212.8 3111.4ERROR ANALYSIS In Exercises 15 and 16, describe andcorrect the error in determining whether the table orgraph represents a linear function. 3y9.1xLinear Functions1175/27/14 4:21 PM
31.In Exercises 17–24, determine whether the equationrepresents a linear or nonlinear function. Explain.(See Example 3.)17. y x 2 133—21. 2 1—6 yOutputDistance (miles), y18. y 7 3x19. y 8 x20. y 4x(8 x) 3x 432.2—3 y22. y x 2x 23. 18x 2y 2624. 2x 3y 9xy25. CLASSIFYING FUNCTIONS Which of the followingequations do not represent linear functions? Explain.A 12 2x2 4y2 B y x 3 x C x 8 3D x 9 —y 45xE y — 11InputTime (hours), xy 1048ERROR ANALYSIS In Exercises 33 and 34, describe andcorrect the error in the statement about the domain.33. 4y3212534.In Exercises 27 and 28, find the domain of the functionrepresented by the graph. Determine whether thedomain is discrete or continuous. Explain.28.24y18301220610y30.1188y62InputBags, x246OutputMarbles, y2040604668x8x35. MODELING WITH MATHEMATICS The linear functionm 55 8.5b represents the amount m (in dollars)of money that you have after buying b books.(See Example 4.)a. Find the domain of the function. Is the domaindiscrete or continuous? Explain.b. Graph the function using its domain.InputYears, x123OutputHeight of tree (feet), y6912Chapter 34The graph ends at x 6,so the domain is discrete.16 x128x2In Exercises 29–32, determine whether the domain isdiscrete or continuous. Explain.29. 286440442.5 is in the domain.1127.450OutputAthletes, y2203002linear function.15150126. USING STRUCTURE Fill in the table so it represents a1090F y x 3 56InputRelay teams, x—x3Graphing Linear Functions
36. MODELING WITH MATHEMATICS The number yof calories burned after x hours of rock climbing isrepresented by the linear function y 650x.a. Find the domain ofthe function. Is thedomain discrete orcontinuous? Explain.WRITING In Exercises 39–42, write a real-life problemto fit the data shown in the graph. Determine whetherthe domain of the function is discrete or continuous.Explain. (See Example 6.)39.40.8yy4b. Graph the functionusing its domain.62437. MODELING WITH MATHEMATICS You are researchingthe speed of sound waves in dry air at 86 F. The tableshows the distances d (in miles) sound waves travelin t seconds. (See Example 5.)Time(seconds), tDistance(miles), d20.43440.86861.30281.736102.170a. Does this situation represent a linear function?Explain.b. Find the domain of the function. Is the domaindiscrete or continuous? Explain.c. Graph the function using its domain.38. MODELING WITH MATHEMATICS The functiony 30 5x represents the cost y (in dollars) ofhaving your dog groomed and buying x extra services.Pampered PupsExtra Grooming ServicesPaw TreatmentTeeth BrushingNail PolishDesheddingEar Treatmenta. Does this situation represent a linear function?Explain.b. Find the domain of the function. Is the domaindiscrete or continuous? Explain.c. Graph the function using its domain.7x422 228x6441.42.y4010x20y30 10020 20010412816 x43. USING STRUCTURE The table shows your earningsy (in dollars) for working x hours.a. What is the missingy-value that makesthe table represent alinear function?Time(hours), xEarnings(dollars), y440.805b. What is your hourlypay rate?661.20771.4044. MAKING AN ARGUMENT The linear functiond 50t represents the distance d (in miles) Car A isfrom a car rental store after t hours. The table showsthe distances Car B is from the rental store.Time(hours), tDistance(miles), d16031805310a. Does the table represent a linear or nonlinearfunction? Explain.b. Your friend claims Car B is moving at a faster rate.Is your friend correct? Explain.Section 3.2Linear Functions119
MATHEMATICAL CONNECTIONS In Exercises 45– 48, tellwhether the volume of the solid is a linear or nonlinearfunction of the missing dimension(s). Explain.45.51. CLASSIFYING A FUNCTION Is the functionrepresented by the ordered pairs linear or nonlinear?Explain your reasoning.46.(0, 2), (3, 14), (5, 22), (9, 38), (11, 46)52. HOW DO YOU SEE IT? You and your friend gos9m4 in.sbRunning Distancer48.2 cmDistance (miles)47.running. The graph shows the distances you andyour friend run.3 in.15 fthy6543210YouFriend01020304050xMinutes49. REASONING A water company fills two different-sized jugs. The first jug can hold x gallons of water.The second jug can hold y gallons of water. Thecompany fills A jugs of the first size and B jugs of thesecond size. What does each expressionrepresent? Does each expression representa set of discrete or continuous values?a. Describe your run and your friend’s run. Whoruns at a constant rate? How do you know?Why might a person not run at a constant rate?b. Find the domain of each function. Describe thedomains using the context of the problem.a. x yb. A BWRITING In Exercises 53 and 54, describe a real-lifec. Axsituation for the constraints.d. Ax By53. The function has at least one negative number in thedomain. The domain is continuous.54. The function gives at least one negative number as an50. THOUGHT PROVOKING You go to a farmer’s marketoutput. The domain is discrete.to buy tomatoes. Graph a function that represents thecost of buying tomatoes. Explain your reasoning.Maintaining Mathematical ProficiencyReviewing what you learned in previous grades and lessonsTell whether x and y show direct variation. Explain your reasoning.(Skills Review Handbook)55.57.56.y3y3y21 31 23x 212x 2 32 3Evaluate the expression when x 2. (Skills Review Handbook)58. 6x 8120Chapter 359.10 2x 8Graphing Linear Functions60.4(x 2 5x)61.x2— 5x 7x
114 Chapter 3 Graphing Linear Functions Graphing Linear Functions A solution of a linear equation in two variables is an ordered pair (x, y) that makes the equation true. The graph of a linear equation in two variables is the set of points (x, y) in a coordinate plane that represents all solutions of the equation.Sometimes the points are distinct, and other times the points are connected.