Transcription
Learning Dota 2 Team CompositionsAtish Agarwalaatisha@stanford.eduMichael Pearcepearcemt@stanford.eduAbstractDota 2 is a multiplayer online game in which two teams of five players control“heroes” and compete to earn gold and destroy enemy structures. Teamwork isessential and heroes are chosen to create a balanced team that will counter theopponents’ selections. We studied how the win rate depends on hero selection byperforming logistic regression with models that incorporate interactions betweenheroes. Our models did not match the naive model without interactions which hada 62% win prediction rate, suggesting cleaner data or better models are needed.1IntroductionWith the decreasing cost of high performance personal computers and increased access to broadbandinternet, competitive gaming has taken off as both a hobby and a viable career. In particular, themultiplayer online game, Dota 2, attracts nearly 10 million unique users each month and has thelargest professional e-sports tournaments with prize pools of over 10 million.In light of the growing interest in competitive Dota, it remains an open problem to develop a goodstatistical understanding of the game. Starting with baseball in the 80’s and 90’s, professional sportshave been undergoing an analytics revolution that is changing the way teams operate and the wayfans consume the game. Competitive gaming in general and Dota in particular are ripe for theirown statistical study due to their large popularity, monetary incentives for good play, and alreadydigitized game information.Dota 2 pits two teams of five players against each other on a standardized map. Each player controlsone “hero,” a character who can gain gold and experience in order to upgrade abilities and buyitems to increase their effectiveness on the battlefield. The object of the game is to destroy theother players’ “Ancient,” a fortified structure protected by a total of 10 towers, as well as computercontrolled “creeps” which respawn every 30 seconds and travel predetermined paths to the enemy’sancient.Previous work in this field has focused on regression models incorporating one or more variablesfor each hero. [1] However, since there are 109 possible heroes to choose from, it becomes acomputationally difficult task to incorporate interaction effects between different heroes.In high level Dota matches, understanding these interactions is key to drafting a good team. Teamstake turns picking and banning heroes in a draft, and must stick with the heroes they end up with.Games can be won or lost in the drafting stage itself. Improving our understanding of the game in aquantitative way could push the development of strategy at high levels of play.2DatasetValve, the game developer of Dota 2, keeps records of end-game match statistics and makes thempublicly available through their web API. We downloaded information on 40,000 matches in thetime period from 10/1/14 to 12/3/14. This interval was chosen so that all the games were played onthe same balance patch, meaning that hero stats remained unchanged.1
Table 1: Features used for hero t hitsDeniesTotal goldGold/minXP/minLevelHero damageTower damageHero healingDamage TakenNeutralEnemy heroes killedTotal deaths, any causeEnemies killed by teammate nearbyEnemy creeps killedFriendly creeps killedGold spent in-gameGold gathered per minuteExperience points per minuteHighest level achievedDamage dealt to enemy heroesDamage dealt to enemy towersDamage healed on friendly heroesDamage taken by heroGold from neutral creepsThe match statistics contain end-game data on team results (who won, which towers were destroyed),individual performances (the statistics in Table 1, for each player), and match parameters (date,match duration, game mode).We gathered data only for matches where no player left before the game ended. We also focusedon two game modes: All Pick and Captain’s Mode. All pick is the most popular format, wherethe entire hero pool is open for selection in any order. Captain’s Mode involves sequential picksand bans from a limited pool of heroes, and is the primary format for professional play. These twomodes were chosen for their ubiquity and similarity to the types of Dota that are played most oftenat the highest level.Unfortunately, we were unable to condition on player skill because the corresponding feature of theweb API was broken by a previous update. Our match data contained a mix of low, middle, and highlevel play which may have added noise to the data.We also gathered professional player data from the same time period via DatDota, a public repositoryof professional Dota statistics [2]. Here we gathered average statistics for each hero, again as inTable 1. The statistics were gathered from around 1500 matches.3Features and preprocessingWe first normalized the average hero statistics from professional play to have mean 0 and variance 1.We then ran PCA on the average statistics to derive vectors x of composite statistics for each hero.For each game in the public match data, we extracted the hero composition of each team. Thiscombined with the x gave us a feature set for our data. All of our models used some subset of thesefeatures. We also stored the identity of the winning team as a binary label.The public match data was then split randomly 90% - 10% into a training and testing set for ourlogistic regression models.We also attempted to extract features by clustering end-game stats for the public match data usingthe k-means algorithm. We had hoped to find different kinds of play styles and then match heroesto the play styles they were most often used for. We evaluated the gap statistic [3] and the silhouettestatistic [4] for the clustering. we found that our data did not cluster into different play styles possiblybecause of the noise associated with having a mix of various levels of play.4ModelsWe ran logistic regression to predict the winning team with 3 different models:2
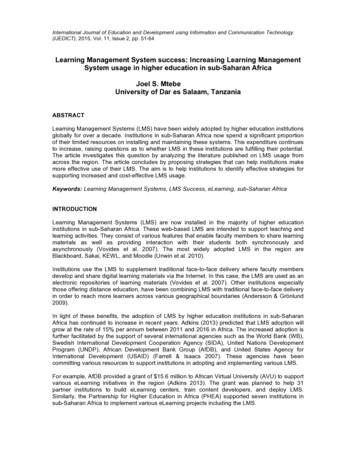
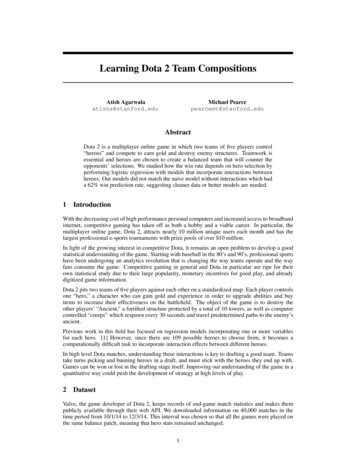
4.1Full Heroes ModelLogistic regression with a term for each hero’s presence on a team. Let v be our feature vector,where if hero i is on team 1 1(1)vi 1 if hero i is on team 2 0otherwiseOur hypothesis function h ishθ ( v ) Xθi (1{vi 1} 1{vi 1}) .(2)iThis model was previously studied in [1]. We have antisymmetrized the model so that it does notdepend on the ordering of the teams.4.22nd Order PCA(i)Logistic regression on a second order polynomial of PCA scores. Let xa be the ath PCA score forP (i)P (i)(i)hero i on team 1. Let ya be similarly defined for team 2. Define xa i xa and ya i ya .Then,XXXhθ,γ,ψ (x, y) θa (xa ya ) γ ab xa yb ψ ab (xa xb ya yb )(3)aa,ba,bwhere γ is antisymmetric. The symmetry properties were chosen so that the hypothesis functionis symmetric under permutation of player positions in a team, and antisymmetric under swappingteams.This model gives some non-linear interaction terms while taking advantage of PCA to give dimensionality reduction. If d PCA components are used, the model has d2 d unique coefficients.4.3Sorted PCAIn studying the PCA components of each hero, we learned that the first PCA component roughlycorresponded to the strength of the hero in the late game. The heroes with the highest values for thefirst PCA component were most likely to be what the Dota community defines as “carries”: heroesweak in the early game, but essential to victory in the late game. A foundational tenent of Dota 2strategy is the need to balance supports and carries.Accordingly, we came up with the following model: let {x(i) } and {y (i) } be the PCA scores of theheroes in teams 1 and 2 respectively, sorted in descending order of first PCA coefficient. ThenX(k)hθ (x, y) θak (x(k)(4)a ya ).a,kUnlike the sorted heroes model, this model can be optimized by a team composition whose PCAcomponents are quite different. Across teams, it compares strengths of heroes with other heroeswho are likely playing similar roles.The total number of coefficients for this model is 5d.5Results and DiscussionFor the 2nd Order and Sorted PCA models, the optimal number of PCA dimensions (d) to includewas determined by maximizing the prediction accuracy on the test set. Figure 1 shows the predictionaccuracy vs. number of PCA dimensions for the Sorted PCA model, resulting in an optimal numberd 7. The 2nd Order PCA model similarly had an optimal number d 7.Figure 1 shows the resulting learning curves for logistic regression using our three models. The fullheroes model had a prediction accuracy of 62% while both PCA models had an accuracy of 57%.3
Sorted PCA ModelLearning Curves0.57Prediction AccuracyPrediction Accuracy0.580.560.55Training SetTest Set0.540246PCA Dimension80.600.580.56Sorted PCA2nd Order PCAFull Heroes0.54010500010 000 15 000 20 000 25 000 30 000Training Set SizeFigure 1: The left plot shows the determination of the optimal number of PCA dimensions bymaximizing the prediction accuracy, resulting in d 7 for the 2nd Order PCA model. The right plotshows the learning curves of the three models as a function of training set size.Our two PCA models failed to match the accuracy of the Full Heroes Model. The PCA models werebased on average hero stats which may not be as informative as whether a particular hero was on ateam. For example, some heroes can be used in multiple roles, which would result in different endgame stats. Average stats would no longer be a good representation of how a hero is played.Preliminary explorations show that the best teams predicted by the full heroes model are in generalmuch less realistic than the best teams predicted by the PCA models. The best team predictedby the full heroes model (Omniknight, Necrophos, Abaddon, Zeus, Ogre Magi) is a collection ofheroes who individually have high win rates, but occupy similar roles (strongest in the midgame,not reliant on teammates). In contrast, the best teams predicted by the sorted PCA model (Pudge,Io, Abaddon, Dazzle, Spectre) and the 2nd order PCA model (Abaddon, Io, Spectre, Naga, Zeus)are more balanced collections of heroes with very different roles.Both PCA models resulted in similar prediction accuracies and optimal numbers of dimensionsdespite representing very different models of hero interactions. In the 2nd Order PCA, each teammember is treated equally and the averages and covariances of the PCA components xa on a teamare related to the probability of winning. In the Sorted PCA model, team members are ranked by x1and treated differently in the regression.The fact that both PCA models behaved similarly and underperformed the Full Heroes Model indicate that our models are not capturing important interaction effects. The issue with numerical stats(as used for our PCA) is determining the appropriate features. A hero that gets many kills might pairwell with a hero that gets many assists, but it is not clear how that depends on the number of killsand number of assists. Ideally, we could classify the heroes into types and then consider a modelsimilar to the Full Heroes one but with higher order terms. In this case, the features would be thepresence of certain combinations of heroes on a team.6ConclusionsWe used PCA analysis of publically available Dota 2 match data in order to study how team composition affects win probabilities. Using data from professional games, we constructed two logisticregression models that included interactions between heroes. Both of our models predicted at 57%accuracy for 7 PCA dimensions, compared to the 62% accuracy for the full model.However, the strongest teams under our PCA models more closely resembled teams that are actuallysuccessful in Dota 2. This suggests that much of the accuracy of the full heroes model comesfrom the fact that players are usually choosing teams with reasonable hero balance; at that point,the marginal strengths of each hero can give us predictive power. In fact, the top 5 heroes in thefull heroes model are the top 5 heroes by winrate in the current patch. [5] The full heroes modelleverages the imbalance of the game to make win predictions.4
Our PCA models are therefore capturing more about the interactions between heroes than the fullheroes model did. The PCA components are still missing specific information about each hero whichcontribute to a hero’s relative strength.7Future workOriginally, we had planned to analyze team compositions at different skill levels. Unfortunately,the Dota2 API functionality to search for matches based on player skill level was broken by the lastupdate. When this bug gets patched, we hope to train our models on a narrower set of games. Wehope that this both improves the performance of both of our models, and gives us insight into howteam compositions change with player skill level.We also plan on seeing if we can combine the best of both the full heroes model and our variousPCA models. We hope to combine the higher accuracy of the full heroes model with the better teamcomposition selections of our PCA models to both better predict match outcomes, as well as suggestteam compositions that may be currently underutilized in the metagame.References[1] K. Conley and D. Perry, “How does he saw me? a recommendation engine for picking heroes in dota 2,”CS229 Previous Projects, 2013.[2] M. Decoud, “datdota,” Dec. 2014. http://www.datdota.com.[3] R. Tibshirani, G. Walther, and T. Hastie, “Estimating the number of clusters in a data set via the gapstatistic,” J. R. Statist. Soc. B, vol. 63, pp. 411–423, 2001.[4] L. Kaufman and P. Roussseeuw, Finding Groups in Data: An Introduction to Cluster Analysis. Wiley,1990.[5] DotaBuff, “Highest win rate, this month,” Dec. 2014.winning.5http://www.dotabuff.com/heroes/
We first normalized the average hero statistics from professional play to have mean 0 and variance 1. We then ran PCA on the average statistics to derive vectors xof composite statistics for each hero. For each game in the public match data, we extracted the hero composition of each team. T